REVIEW 3 major objections 5 minor 99 references
Secret of Longevity: Protoplanetary Disks as a Source of Gas in Debris Disks
T0 review · 3 major / 5 minor · reviewed 2026-08-12 · deepseek-v4-flash
Pith's one-line read The paper argues that gas-rich debris disks can be primordial remnants: initially massive, weakly turbulent, small-grain-depleted protoplanetary disks survive beyond 10 Myr, peak in lifetime near 2 solar masses, and keep accreting as long…
desk verdict A careful 1D extension of the authors' 0D small-grain-depleted disk model: the conditional longevity claim is internally supported, but the whole result leans on an unmodeled premise—early and persistent small-grain depletion that switches off FUV photoevaporation. read the letter →
The pith
A machine-rendered reading of the paper's core claim, the machinery that carries it, and where it could break.
The reading
What carries the argument
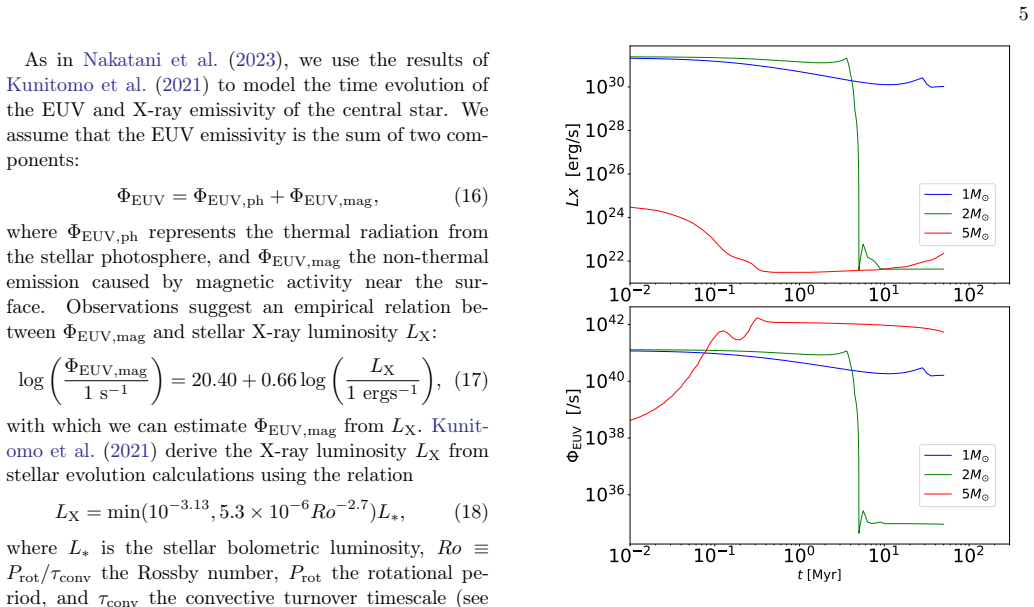
The machinery is a one-dimensional secular evolution equation for the gas surface density with separate terms for turbulent accretion, magnetohydrodynamic disk winds, and photoevaporation, using the standard $\alpha$-parameter prescription in which turbulent stress is set by a dimensionless number $\alpha$. The load-bearing element is stellar evolution: for a $2\,M_\odot$ star the disappearance of the surface convective layer at about 4 Myr sharply cuts the X-ray and magnetic EUV radiation that powers photoevaporation, while for 1 and 5 solar-mass stars the radiation stays strong at different epochs. With weak turbulence ($\alpha \sim 8 \times 10^{-5}$), accretion is slow enough that this radiation drop lets the disk survive far beyond the usual few-million-year dispersal timescale; the assumed early depletion of small grains and PAHs is what removes far-ultraviolet photoevaporation from the competition.
What would settle it
Run the same disk evolution with a self-consistent model of carbonaceous grain growth, radial drift, and far-ultraviolet photoelectric heating: if realistic starting grain populations do not fall below roughly 0.1--1 percent of interstellar abundance before the far-ultraviolet luminosity rises at 1--3 Myr, the long-lived population becomes too rare to explain the observed gas-rich debris disks.
Extended reading notes
Core claim
The central claim is that a protoplanetary disk with a depleted population of very small grains and carbon-rich molecules (PAHs) can evolve into a gas-rich debris disk instead of dispersing within 10 Myr. In the model, weak turbulent stress ($\alpha \sim 8 \times 10^{-5}$) and a massive initial disk ($M_{\mathrm{disk}}\sim 0.1\,M_*$) let gas persist; for a $2\,M_\odot$ host, the surface convective zone disappears around 4 Myr, collapsing the stellar X-ray and magnetic EUV output and therefore the photoevaporation rate, so the disk retains gas at 10--1000 au for more than 100 Myr. The same model predicts that accretion continues as long as the disk survives, with rates around $10^{-11}$--$10^{-10}\,M_\odot\,\mathrm{yr}^{-1}$ for $2\,M_\odot$ hosts after 10 Myr, and it estimates CO masses comparable to the most massive gas-rich debris disks around early A stars.
Load-bearing premise
The load-bearing premise is that the very smallest dust grains and carbon-rich molecules are removed early and stay gone, so far-ultraviolet starlight cannot heat the disk and drive photoevaporation; that removal is not modeled self-consistently.
Editorial extensions
If this is right
- Gas can survive beyond 10 Myr for all stellar masses considered, provided the disk starts massive ($M_{\mathrm{disk}}\sim 0.1\,M_*$) and weakly turbulent ($\alpha \ll 10^{-2}$), with the longest lifetimes exceeding 100 Myr at $2\,M_\odot$.
- The long-lived gas sits at roughly 10--1000 au, matching the ring-like radial extents of gas observed in gas-rich debris disks.
- Accretion persists as long as the disk survives, so searching for accretion signatures is a direct way to distinguish primordial from secondary gas origins.
- The estimated CO masses in the long-lived models overlap the observed range for the most massive gas-rich debris disks around early A stars.
- The same evolution can explain old accreting disks around low-mass stars, including Peter Pan disks.
Reading between the lines
- The paper does not model small-grain depletion; an explicit consequence of its logic is that the timing and completeness of that depletion, rather than initial disk mass alone, selects which disks become long-lived. Coupling grain growth and drift to the same evolution calculation would turn the scenario into a predicted population fraction.
- The 2--3 solar-mass peak implies a physical filter: only intermediate-mass stars lose their surface convective zone early enough to cut X-ray and EUV photoevaporation before the disk is gone, so the observed A-star bias in gas-rich debris disks may be partly a longevity selection effect rather than only a detection bias.
- The appendix's result that accretion-generated EUV can shorten lifetimes toward 10 Myr suggests the longest survivors may need accretion-inhibiting processes such as inner planets or magnetization; future accretion observations could therefore constrain unseen planetary architecture, not just gas origin.
- For low-CO debris disks, the secondary-origin scenario may still win; the model's parameter requirements make primordial gas a minority outcome, so a mixed population is the most plausible observational reality.
Editorial analysis
A structured set of objections, weighed in public.
Referee Report
Summary. This paper explores the primordial-origin scenario for gas in debris disks by simulating 1D secular evolution of protoplanetary disks that are assumed to be depleted in very small grains and PAHs. The model includes viscous accretion, MHD disk winds, EUV/X-ray photoevaporation with time-dependent stellar evolution, and wind shielding. The authors find that initially massive disks (M_disk ~ 0.1 M_*) with weak turbulence (alpha << 1e-2) can survive beyond 10 Myr, with the longest lifetimes around 2 M_sun, that gas persists at roughly 10-1000 au, and that accretion continues as long as the disk survives. They compare estimated CO masses to gas-rich debris disks and argue that searching for accretion signatures can distinguish primordial from secondary gas origins. The paper is an extension of the one-zone model of Nakatani et al. (2023) to a spatially resolved model and is framed as a plausibility study for a specific, long-lived disk population.
Significance. If the results hold, the paper provides a concrete pathway for the primordial-origin scenario, explaining the relatively high incidence of gas-rich debris disks around early A stars and offering a unified explanation for long-lived accreting disks including Peter Pan disks. The work is valuable for its systematic parameter survey, its inclusion of MHD wind shielding, its spatial predictions that can be compared with ALMA observations, and its explicit, falsifiable prediction that accretion should persist in old gas disks. The simulations are internally consistent and the parameter variations are transparent; the conditional claim 'if small grains are depleted early and persistently and alpha is small, disks can survive beyond 10 Myr' is defensible. The main weakness is that the central premise, early and persistent small-grain depletion, is not modeled self-consistently, so the paper's broader conclusions about observational plausibility rest on an external, unverified condition.
major comments (3)
- [Sections 2.3 and 4.3] The central claim that disks survive beyond 10 Myr depends on neglecting FUV-driven photoevaporation, justified by the assumption that very small grains and PAHs are depleted. This depletion is not simulated: the paper states in Section 4.3 that the threshold abundance of 0.1-1% of ISM is uncertain and that no self-consistent calculation including grain growth and FUV photoevaporation is performed. The same section notes that FUV photoevaporation becomes significant at 1-3 Myr for 2-3 M_sun stars as FUV luminosity rises with stellar evolution. For the longevity result to apply, depletion must occur before this rise and persist across the disk. The observational evidence cited is suggestive but does not establish the required timing or spatial extent. This is the load-bearing external condition of the paper, and it needs to be addressed directly, for example by coupling a grain evolution model or by computing the epoch of depletion relative to the FUV rise, or by explicitly restricting the conclusions to disks where such early depletion can be demonstrated.
- [Appendix A and Figure 14] The main-text claim of a pronounced lifetime peak at 2 M_sun is substantially weakened by the authors' own EUVACC models, where 4% of accretion energy converted to EUV radiation flattens the stellar-mass dependence and reduces lifetimes to about 10 Myr for all stellar masses. Since the model predicts ongoing accretion, accretion-generated EUV is not a negligible perturbation; it removes the distinctive A-star peak that the paper emphasizes in the abstract and introduction. The appendix is clearly written, but the main conclusions and the abstract should be qualified to reflect that a plausible and internally motivated process erases the central longevity trend. At minimum, the abstract should state that the >10 Myr lifetimes and the 2 M_sun peak apply only when accretion-generated EUV is small.
- [Section 4.2 and Figure 13] The estimated CO masses of 0.06-0.6 M_Earth are quoted as comparable to the most massive gas-rich debris disks, but this estimate assumes interstellar carbon abundance and neglects photodissociation and carbon chemistry. The authors do describe this as an upper limit in the text, but the abstract and Section 5 present the alignment without this caveat. The comparison is therefore weaker than the summary suggests. I recommend rewording the conclusions to state that the predicted CO masses are order-of-magnitude upper limits that are consistent with the most massive observed disks only if CO survives efficiently, and that thermochemical modeling is needed for a quantitative comparison.
minor comments (5)
- [Section 3.3] The text uses 'MIRact-2' once in the discussion of Figure 9; this should be 'MRIact-2' for consistency with Table 1 and the rest of the paper.
- [Section 3.1.1] The sentence 'The remaining mass in 10-100 au disperses finally, which is no later than 2 Myr' appears inconsistent with Figure 3 and with the quoted lifetimes of roughly 15-20 Myr for FID-1 and FID-5; this is likely a typo for '20 Myr' and should be corrected.
- [Section 2.2, Equation (6)] In the paragraph following Equation (6), the second occurrence of 'On the left-hand side, the first and second terms' should read 'On the right-hand side' to match the physical meaning.
- [Table 1] The entry 'Rcut1-N' lists rcut as '30 × N', which is ambiguous because N denotes the stellar mass suffix; the caption or table should explicitly state that rcut = 30 au × (M_*/M_sun).
- [Section 4.1] The phrase 'unless such a survey has not already been undertaken' is confusing; it should be rephrased to state whether such a survey has already been conducted or to recommend one without the double negative.
Circularity Check
No significant circularity: longevity and accretion are computed outcomes of the stated 1D transport equations, not reconstructions of the target observations; the small-grain-depletion premise is an acknowledged modeling limitation rather than a fitted prediction.
full rationale
The paper's derivation chain is a 1D numerical integration of Eq. (11), with the viscous stress (Eq. 2), MHD disk wind (Eqs. 3-10), and EUV/X-ray photoevaporation (Eqs. 12-18) all specified from explicit prescriptions and prior literature. The headline claim, that initially massive, low-alpha, small-grain-depleted disks can survive beyond 10 Myr with a lifetime peak near M* = 2 M_sun, is not obtained by fitting any parameter to the debris-disk observations used for comparison. The CO-mass estimates are rough post-hoc conversions using interstellar abundances, and the accretion-rate comparison with observations is likewise a comparison, not a calibration. The only element that could superficially look inherited is the omission of FUV photoevaporation, justified by small-grain depletion in Section 2.3 ('Following Nakatani et al. 2023, we do not incorporate FUV photoevaporation in the present study, as we are primarily interested in small-grain-depleted disks, where FUV photoevaporation is ineffective.') and cited to the authors' prior work for the depletion threshold. That is a premise and a caveat, not a circular reduction: the 1D calculation still must show that EUV, X-ray, and wind-driven dispersal alone do not destroy the disk within 10 Myr, and the result depends quantitatively on the stellar-evolution tracks and photoevaporation rates used. Section 4.3 explicitly acknowledges that the depletion threshold is uncertain and that no self-consistent calculation including both grain growth and FUV photoevaporation has been performed. This makes the central claim externally conditional, but the claim is not equivalent to its inputs by construction, and no output is recovered from the target data by fitting. Self-citations to Nakatani et al. 2018a,b and Nakatani et al. 2023 are present and are load-bearing in setting the small-grain-depletion premise, but they are prior published calculations of the heating threshold rather than an unverified assertion, and the present paper extends their 0D scenario to a 1D model with independent spatial and temporal structure. Therefore no specific circular step can be exhibited; the main risk is model dependence on an unmodeled physical condition, which is a robustness concern, not circularity.
Assumptions & free parameters
free parameters (8)
- MRI turbulent stress alpha_rphi =
8e-5 inactive, 8e-3 active
- MHD wind mass-loading floor Cw_0 =
1e-5 inactive, 2e-5 active
- X-ray photoevaporation suppression factor =
0.1
- MHD wind shielding column thresholds =
1e19 cm^-2 EUV, 1e21 cm^-2 X-ray
- Initial disk-to-star mass ratio Mdisk,0/M* =
0.1 fiducial, 0.03 and 0.01 variants
- Initial disk cutoff radius rcut =
30 au fiducial, 60 au in Rcut1
- Stellar rotation period Prot =
3 days
- Accretion-generated EUV conversion efficiency =
4% in EUVACC models
assumptions (9)
- domain assumption FUV photoevaporation is negligible in small-grain-depleted disks.
- domain assumption Stellar X-ray and EUV evolution follows Kunitomo et al. (2021) tracks.
- domain assumption EUV and X-ray photoevaporation rates and suppression factors are correct.
- domain assumption MHD wind formulations of Suzuki et al. (2016) apply.
- domain assumption Shielding of stellar radiation by MHD wind column density follows simple thresholds.
- domain assumption No FUV, external photoevaporation, late infall, planet gaps, or chemistry are active in the relevant systems.
- domain assumption Initial disk surface density profile is a power law with exponential cutoff rcut=30 au.
- domain assumption Standard dust opacity and dust-to-gas ratio remain valid despite assuming small-grain depletion.
- domain assumption CO mass estimate uses the interstellar carbon abundance of about 1e-4 as an upper limit.
Cite this review
Pith. "Pith review of Secret of Longevity: Protoplanetary Disks as a Source of Gas in Debris Disks." pith.science (2026). https://pith.science/paper/QRCQAHNF
@misc{pith2026241117114,
  author       = {Pith},
  title        = {Pith review of: Secret of Longevity: Protoplanetary Disks as a Source of Gas in Debris Disks},
  year         = {2026},
  howpublished = {\url{https://pith.science/paper/QRCQAHNF}},
  note         = {Machine review of arXiv:2411.17114}
}
abstract
While protoplanetary disks (PPDs) are generally thought to disperse within several million years, recent observations have revealed gas in their older counterparts, debris disks. The origin of this gas remains uncertain, with one possibility being the unexpectedly long survival of PPDs (the primordial-origin scenario). To explore the plausibility of this scenario, we conduct 1D disk evolution simulations, varying parameters like stellar mass, disk mass, turbulent stress, and the model of magnetohydrodynamic winds, while incorporating stellar evolution to account for time-varying photoevaporation rates. Our focus is on disks where small grains are depleted, as these are potentially long-lived due to reduced far-ultraviolet photoevaporation. Our results show that gas in these disks can survive beyond 10 Myr regardless of the stellar mass, provided they are initially massive ($M_{\mathrm{disk}}\approx 0.1M_*$) with relatively weak turbulent stress ($\alpha \ll 10^{-2}$). The longest lifetimes are consistently found for $M_* = 2 M_{\odot}$ across a wide parameter space, with gas typically persisting at $\sim 10$--$10^3$ au. Roughly estimated CO masses for these disks fall within the observed range for the most massive gas-rich debris disks around early A~stars. These alignments support the plausibility of the primordial-origin scenario. Additionally, our model predicts that accretion persists for as long as the disk survives, which could explain the accretion signatures detected in old disks hosted by low-mass stars, including Peter Pan disks. Our finding also suggests that ongoing accretion may exist in gas-rich debris disks. Thus, searching for accretion signatures could be a key to determining the origins of gas in debris disks.
Figures


Figures from the paper (13 more)


Reference graph
Works this paper leans on
-
[1]
2010, ApJ, 718, 558, doi: 10.1088/0004-637X/718/1/558
Acke, B., Bouwman, J., Juhász, A., et al. 2010, ApJ, 718, 558, doi: 10.1088/0004-637X/718/1/558
-
[2]
2014, in Protostars and Planets VI, ed
Cieza, L. 2014, in Protostars and Planets VI, ed. H. Beuther, R. S. Klessen, C. P. Dullemond, & T. Henning, 475–496, doi: 10.2458/azu_uapress_9780816531240-ch021
-
[3]
Alexander, R. D., Clarke, C. J., & Pringle, J. E. 2006, MNRAS, 369, 229, doi: 10.1111/j.1365-2966.2006.10294.x
arXiv 2006
-
[4]
Armitage, P. J., Simon, J. B., & Martin, R. G. 2013, ApJL, 778, L14, doi: 10.1088/2041-8205/778/1/L14
-
[5]
2019, AJ, 157, 159, doi: 10.3847/1538-3881/ab0ca1
Arun, R., Mathew, B., Manoj, P., et al. 2019, AJ, 157, 159, doi: 10.3847/1538-3881/ab0ca1
-
[6]
2013, ApJ, 772, 96, doi: 10.1088/0004-637X/772/2/96
Bai, X.-N. 2013, ApJ, 772, 96, doi: 10.1088/0004-637X/772/2/96
-
[7]
2016, ApJ, 818, 152, doi: 10.3847/0004-637X/818/2/152
Bai, X.-N., Ye, J., Goodman, J., & Yuan, F. 2016, ApJ, 818, 152, doi: 10.3847/0004-637X/818/2/152
-
[8]
Birnstiel, T., Ormel, C. W., & Dullemond, C. P. 2011, A&A, 525, A11, doi: 10.1051/0004-6361/201015228 Boutéraon, T., Habart, E., Ysard, N., et al. 2019, A&A, 623, A135, doi: 10.1051/0004-6361/201834016
Show all 99 references
-
[9]
Waters, L. B. F. M. 2023, SSRv, 219, 7, doi: 10.1007/s11214-023-00949-z
2023 doi
- [10]
-
[11]
E., Henning, T., et al
Carmona, A., van den Ancker, M. E., Henning, T., et al. 2007, A&A, 476, 853, doi: 10.1051/0004-6361:20078536
2007 doi
-
[12]
2020, ApJ, 892, 99, doi: 10.3847/1538-4357/ab7cc7
Cataldi, G., Wu, Y., Brandeker, A., et al. 2020, ApJ, 892, 99, doi: 10.3847/1538-4357/ab7cc7
2020 doi
-
[13]
2023, ApJ, 951, 111, doi: 10.3847/1538-4357/acd6f3
Cataldi, G., Aikawa, Y., Iwasaki, K., et al. 2023, ApJ, 951, 111, doi: 10.3847/1538-4357/acd6f3
2023 doi
-
[14]
J., Gendrin, A., & Sotomayor, M
Clarke, C. J., Gendrin, A., & Sotomayor, M. 2001, MNRAS, 328, 485, doi: 10.1046/j.1365-8711.2001.04891.x
2001
-
[15]
Coleman, G. A. L., & Haworth, T. J. 2020, MNRAS, 496, L111, doi: 10.1093/mnrasl/slaa098
2020 doi
- [16]
-
[17]
P., Küffmeier, M., Goicovic, F., et al
Dullemond, C. P., Küffmeier, M., Goicovic, F., et al. 2019, A&A, 628, A20, doi: 10.1051/0004-6361/201832632
2019 doi
-
[18]
P., Birnstiel, T., Huang, J., et al
Dullemond, C. P., Birnstiel, T., Huang, J., et al. 2018, ApJL, 869, L46, doi: 10.3847/2041-8213/aaf742
2018 doi
-
[19]
2017, MNRAS, 472, 4117, doi: 10.1093/mnras/stx2294
Ercolano, B., Jennings, J., Rosotti, G., & Birnstiel, T. 2017, MNRAS, 472, 4117, doi: 10.1093/mnras/stx2294
2017 doi
-
[20]
2017, Royal Society Open Science, 4, 170114, doi: 10.1098/rsos.170114
Ercolano, B., & Pascucci, I. 2017, Royal Society Open Science, 4, 170114, doi: 10.1098/rsos.170114
2017 doi
-
[21]
Jayawardhana, R., & Oliveira, J. M. 2010, A&A, 510, A72, doi: 10.1051/0004-6361/200912810
2010 doi
-
[22]
Feiden, G. A. 2016, A&A, 593, A99, doi: 10.1051/0004-6361/201527613
2016 doi
-
[23]
M., Hughes, A
Flaherty, K. M., Hughes, A. M., Rosenfeld, K. A., et al. 2015, ApJ, 813, 99, doi: 10.1088/0004-637X/813/2/99
2015 doi
-
[24]
2006, ApJS, 165, 568, doi: 10.1086/505468
Furlan, E., Hartmann, L., Calvet, N., et al. 2006, ApJS, 165, 568, doi: 10.1086/505468
2006 doi
-
[25]
L., Espaillat, C., et al
Furlan, E., Luhman, K. L., Espaillat, C., et al. 2011, ApJS, 195, 3, doi: 10.1088/0067-0049/195/1/3 Garcia Lopez, R., Natta, A., Testi, L., & Habart, E. 2006, A&A, 459, 837, doi: 10.1051/0004-6361:20065575
2011 doi
-
[26]
C., van Dishoeck, E
Geers, V. C., van Dishoeck, E. F., Visser, R., et al. 2007, A&A, 476, 279, doi: 10.1051/0004-6361:20078466
2007 doi
-
[27]
C., Augereau, J
Geers, V. C., Augereau, J. C., Pontoppidan, K. M., et al. 2006, A&A, 459, 545, doi: 10.1051/0004-6361:20064830
2006 doi
-
[28]
Gorti, U., Hollenbach, D., & Dullemond, C. P. 2015, ApJ, 804, 29, doi: 10.1088/0004-637X/804/1/29
2015 doi
-
[29]
L., Stapper, L
Grant, S. L., Stapper, L. M., Hogerheijde, M. R., et al. 2023, AJ, 166, 147, doi: 10.3847/1538-3881/acf128
2023 doi
-
[30]
M., Sándor, Z., Ronco, M
Guilera, O. M., Sándor, Z., Ronco, M. P., Venturini, J., & Miller Bertolami, M. M. 2020, A&A, 642, A140, doi: 10.1051/0004-6361/202038458
2020 doi
-
[31]
A., & Lada, C
Haisch, Karl E., J., Lada, E. A., & Lada, C. J. 2001, ApJL, 553, L153, doi: 10.1086/320685
2001 doi
-
[32]
R., Millman, K
Harris, C. R., Millman, K. J., van der Walt, S. J., et al. 2020, Nature, 585, 357, doi: 10.1038/s41586-020-2649-2 Hernández, J., Hartmann, L., Megeath, T., et al. 2007, ApJ, 662, 1067, doi: 10.1086/513735
2020 doi
-
[33]
E., Oya, Y., & Yamamoto, S
Higuchi, A. E., Oya, Y., & Yamamoto, S. 2019a, ApJL, 885, L39, doi: 10.3847/2041-8213/ab518d
-
[34]
E., Sato, A., Tsukagoshi, T., et al
Higuchi, A. E., Sato, A., Tsukagoshi, T., et al. 2017, ApJL, 839, L14, doi: 10.3847/2041-8213/aa67f4
2017 doi
-
[35]
E., Saigo, K., Kobayashi, H., et al
Higuchi, A. E., Saigo, K., Kobayashi, H., et al. 2019b, ApJ, 883, 180, doi: 10.3847/1538-4357/ab3d26
-
[36]
1994, ApJ, 428, 654, doi: 10.1086/174276
Hollenbach, D., Johnstone, D., Lizano, S., & Shu, F. 1994, ApJ, 428, 654, doi: 10.1086/174276
1994 doi
-
[37]
M., Duchêne, G., & Matthews, B
Hughes, A. M., Duchêne, G., & Matthews, B. C. 2018, ARA&A, 56, 541, doi: 10.1146/annurev-astro-081817-052035
2018 doi
-
[38]
M., Lieman-Sifry, J., Flaherty, K
Hughes, A. M., Lieman-Sifry, J., Flaherty, K. M., et al. 2017, ApJ, 839, 86, doi: 10.3847/1538-4357/aa6b04
2017 doi
-
[39]
Hunter, J. D. 2007, Computing in Science & Engineering, 9, 90, doi: 10.1109/MCSE.2007.55
2007 doi
-
[40]
E., & Aikawa, Y
Iwasaki, K., Kobayashi, H., Higuchi, A. E., & Aikawa, Y. 2023, ApJ, 950, 36, doi: 10.3847/1538-4357/acc524
2023 doi
-
[41]
M., & Kenyon, S
Kennedy, G. M., & Kenyon, S. J. 2009, ApJ, 695, 1210, doi: 10.1088/0004-637X/695/2/1210
2009 doi
-
[42]
S., Kunitomo, M., & Takahashi, S
Kimura, S. S., Kunitomo, M., & Takahashi, S. Z. 2016, MNRAS, 461, 2257, doi: 10.1093/mnras/stw1531
2016 doi
- [43]
-
[44]
2021, ApJ, 910, 51, doi: 10.3847/1538-4357/abe2af Kóspál, Á., Moór, A., Juhász, A., et al
Komaki, A., Nakatani, R., & Yoshida, N. 2021, ApJ, 910, 51, doi: 10.3847/1538-4357/abe2af Kóspál, Á., Moór, A., Juhász, A., et al. 2013, ApJ, 776, 77, doi: 10.1088/0004-637X/776/2/77
2021 doi
-
[45]
C., Kama, M., & Matrà, L
Kral, Q., Marino, S., Wyatt, M. C., Kama, M., & Matrà, L. 2019, MNRAS, 489, 3670, doi: 10.1093/mnras/sty2923
2019 doi
-
[46]
F., et al
Kral, Q., Wyatt, M., Carswell, R. F., et al. 2016, MNRAS, 461, 845, doi: 10.1093/mnras/stw1361
2016 doi
-
[47]
2021, ApJ, 909, 109, doi: 10.3847/1538-4357/abdb2a
Kunitomo, M., Ida, S., Takeuchi, T., et al. 2021, ApJ, 909, 109, doi: 10.3847/1538-4357/abdb2a
2021 doi
-
[48]
K., & Inutsuka, S.-i
Kunitomo, M., Suzuki, T. K., & Inutsuka, S.-i. 2020, MNRAS, 492, 3849, doi: 10.1093/mnras/staa087
2020 doi
-
[49]
M., Carpenter, J
Lieman-Sifry, J., Hughes, A. M., Carpenter, J. M., et al. 2016, ApJ, 828, 25, doi: 10.3847/0004-637X/828/1/25
2016 doi
-
[50]
2003, PASA, 20, 337, doi: 10.1071/AS03019
Liffman, K. 2003, PASA, 20, 337, doi: 10.1071/AS03019
2003 doi
-
[51]
Lynden-Bell, D., & Pringle, J. E. 1974, MNRAS, 168, 603, doi: 10.1093/mnras/168.3.603
1974 doi
-
[52]
Mamajek, E. E. 2009, in American Institute of Physics Conference Series, Vol. 1158, Exoplanets and Disks: Their Formation and Diversity, ed. T. Usuda, M. Tamura, & M. Ishii (AIP), 3–10, doi: 10.1063/1.3215910
2009 doi
- [53]
-
[54]
F., Mordasini, C., Testi, L., et al
Manara, C. F., Mordasini, C., Testi, L., et al. 2019, A&A, 631, L2, doi: 10.1051/0004-6361/201936488
2019 doi
-
[55]
F., Natta, A., Rosotti, G
Manara, C. F., Natta, A., Rosotti, G. P., et al. 2020, A&A, 639, A58, doi: 10.1051/0004-6361/202037949
2020 doi
-
[56]
Wyatt, M. C. 2022, MNRAS, 515, 507, doi: 10.1093/mnras/stac1756
2022 doi
-
[57]
2020, MNRAS, 492, 4409, doi: 10.1093/mnras/stz3487
Marino, S., Flock, M., Henning, T., et al. 2020, MNRAS, 492, 4409, doi: 10.1093/mnras/stz3487
2020 doi
-
[58]
2016, MNRAS, 460, 2933, doi: 10.1093/mnras/stw1216 Matrà, L., Öberg, K
Marino, S., Matrà, L., Stark, C., et al. 2016, MNRAS, 460, 2933, doi: 10.1093/mnras/stw1216 Matrà, L., Öberg, K. I., Wilner, D. J., Olofsson, J., & Bayo, A. 2019, AJ, 157, 117, doi: 10.3847/1538-3881/aaff5b Matrà, L., MacGregor, M. A., Kalas, P., et al. 2017, ApJ, 842, 9, doi:...
2016 doi
- [59]
-
[60]
Michel, A., van der Marel, N., & Matthews, B. C. 2021, ApJ, 921, 72, doi: 10.3847/1538-4357/ac1bbb Moór, A., Curé, M., Kóspál, Á., et al. 2017, ApJ, 849, 123, doi: 10.3847/1538-4357/aa8e4e Moór, A., Kral, Q., Ábrahám, P., et al. 2019, ApJ, 884, 108, doi: 10.3847/1538-4357/ab4272
2021 doi
-
[62]
2013, A&A, 549, A112, doi: 10.1051/0004-6361/201219522
Schneider, G. 2013, A&A, 549, A112, doi: 10.1051/0004-6361/201219522
2013 doi
-
[63]
1994, ApJ, 421, 640, doi: 10.1086/173678
Nakamoto, T., & Nakagawa, Y. 1994, ApJ, 421, 640, doi: 10.1086/173678
1994 doi
-
[64]
2018a, ApJ, 857, 57, doi: 10.3847/1538-4357/aab70b —
Kuiper, R. 2018a, ApJ, 857, 57, doi: 10.3847/1538-4357/aab70b —. 2018b, ApJ, 865, 75, doi: 10.3847/1538-4357/aad9fd
-
[65]
2021, ApJ, 915, 90, doi: 10.3847/1538-4357/ac0137
Aikawa, Y. 2021, ApJ, 915, 90, doi: 10.3847/1538-4357/ac0137
2021 doi
-
[66]
J., Hasegawa, Y., et al
Nakatani, R., Turner, N. J., Hasegawa, Y., et al. 2023, ApJL, 959, L28, doi: 10.3847/2041-8213/ad0ed8
2023 doi
- [67]
-
[68]
2024, A&A, 692, A11, doi: 10.1051/0004-6361/202451908
Okamoto, T., & Ida, S. 2024, A&A, 692, A11, doi: 10.1051/0004-6361/202451908
2024 doi
-
[69]
M., Merín, B., et al
Oliveira, I., Pontoppidan, K. M., Merín, B., et al. 2010, ApJ, 714, 778, doi: 10.1088/0004-637X/714/1/778
2010 doi
-
[70]
E., Clarke, C
Owen, J. E., Clarke, C. J., & Ercolano, B. 2012, MNRAS, 422, 1880, doi: 10.1111/j.1365-2966.2011.20337.x
2012
-
[71]
E., & Kollmeier, J
Owen, J. E., & Kollmeier, J. A. 2019, MNRAS, 487, 3702, doi: 10.1093/mnras/stz1591
2019 doi
-
[72]
2022, ApJL, 939, L10, doi: 10.3847/2041-8213/ac9839
Pfalzner, S., Dehghani, S., & Michel, A. 2022, ApJL, 939, L10, doi: 10.3847/2041-8213/ac9839
2022 doi
-
[73]
2024, ApJ, 963, 122, doi: 10.3847/1538-4357/ad1bef
Pfalzner, S., & Dincer, F. 2024, ApJ, 963, 122, doi: 10.3847/1538-4357/ad1bef
2024 doi
-
[74]
2022, A&A, 662, L8, doi: 10.1051/0004-6361/202243637
Pinilla, P., Garufi, A., & Gárate, M. 2022, A&A, 662, L8, doi: 10.1051/0004-6361/202243637
2022 doi
-
[75]
W., & Henning, T
Preibisch, T., Ossenkopf, V., Yorke, H. W., & Henning, T. 1993, A&A, 279, 577 Ribas, Á., Bouy, H., & Merín, B. 2015, A&A, 576, A52, doi: 10.1051/0004-6361/201424846 Ribas, Á., Merín, B., Bouy, H., & Maud, L. T. 2014, A&A, 561, A54, doi: 10.1051/0004-6361/201322597
1993 doi
-
[76]
Richert, A. J. W., Getman, K. V., Feigelson, E. D., et al. 2018, MNRAS, 477, 5191, doi: 10.1093/mnras/sty949
2018 doi
-
[77]
2015, ApJ, 801, 31, doi: 10.1088/0004-637X/801/1/31
Rigliaco, E., Pascucci, I., Duchene, G., et al. 2015, ApJ, 801, 31, doi: 10.1088/0004-637X/801/1/31
2015 doi
-
[78]
P., Schreiber, M
Ronco, M. P., Schreiber, M. R., Villaver, E., Guilera, O. M., & Miller Bertolami, M. M. 2024, A&A, 682, A155, doi: 10.1051/0004-6361/202347762
2024 doi
-
[79]
J., Brown, J
Salyk, C., Herczeg, G. J., Brown, J. M., et al. 2013, ApJ, 769, 21, doi: 10.1088/0004-637X/769/1/21
2013 doi
-
[80]
D., Booth, R
Sellek, A. D., Booth, R. A., & Clarke, C. J. 2020a, MNRAS, 498, 2845, doi: 10.1093/mnras/staa2519 —. 2020b, MNRAS, 498, 2845, doi: 10.1093/mnras/staa2519
- [81]
-
[82]
I., & Sunyaev, R
Shakura, N. I., & Sunyaev, R. A. 1973, A&A, 24, 337
1973
-
[83]
Sicilia-Aguilar, A., Henning, T., & Hartmann, L. W. 2010, ApJ, 710, 597, doi: 10.1088/0004-637X/710/1/597
2010 doi
-
[84]
M., Kuchner, M
Silverberg, S. M., Kuchner, M. J., Wisniewski, J. P., et al. 2016, ApJL, 830, L28, doi: 10.3847/2041-8205/830/2/L28
2016 doi
-
[85]
M., Wisniewski, J
Silverberg, S. M., Wisniewski, J. P., Kuchner, M. J., et al. 2020, ApJ, 890, 106, doi: 10.3847/1538-4357/ab68e6
2020 doi
-
[86]
V., Moór, A., Semenov, D
Smirnov-Pinchukov, G. V., Moór, A., Semenov, D. A., et al. 2022, MNRAS, 510, 1148, doi: 10.1093/mnras/stab3146
2022 doi
-
[87]
2023, A&A, 670, L5, doi: 10.1051/0004-6361/202245512
Birnstiel, T. 2023, A&A, 670, L5, doi: 10.1051/0004-6361/202245512
2023 doi
-
[88]
K., Muto, T., & Inutsuka, S.-i
Suzuki, T. K., Muto, T., & Inutsuka, S.-i. 2010, ApJ, 718, 1289, doi: 10.1088/0004-637X/718/2/1289 22
2010 doi
-
[89]
2016, A&A, 596, A74, doi: 10.1051/0004-6361/201628955 —
Guillot, T. 2016, A&A, 596, A74, doi: 10.1051/0004-6361/201628955 —. 2022, A&A, 668, C1, doi: 10.1051/0004-6361/201628955e
2016 doi
-
[90]
Tanaka, K. E. I., Nakamoto, T., & Omukai, K. 2013, ApJ, 773, 155, doi: 10.1088/0004-637X/773/2/155
2013 doi
-
[91]
2024, MNRAS, 533, 1211, doi: 10.1093/mnras/stae1748
Tong, S., Alexander, R., & Rosotti, G. 2024, MNRAS, 533, 1211, doi: 10.1093/mnras/stae1748
2024 doi
-
[92]
M., Haldemann, J., Ronco, M
Venturini, J., Guilera, O. M., Haldemann, J., Ronco, M. P., & Mordasini, C. 2020, A&A, 643, L1, doi: 10.1051/0004-6361/202039141
2020 doi
-
[93]
Vicente, S., Berné, O., Tielens, A. G. G. M., et al. 2013, ApJL, 765, L38, doi: 10.1088/2041-8205/765/2/L38
2013 doi
-
[94]
D., Baines, D., Mendigutía, I., & Pérez-Martínez, R
Vioque, M., Oudmaijer, R. D., Baines, D., Mendigutía, I., & Pérez-Martínez, R. 2018, A&A, 620, A128, doi: 10.1051/0004-6361/201832870
2018 doi
-
[95]
E., et al
Virtanen, P., Gommers, R., Oliphant, T. E., et al. 2020, Nature Methods, 17, 261, doi: 10.1038/s41592-019-0686-2
2020 doi
-
[96]
2023, A&A, 674, A165, doi: 10.1051/0004-6361/202243453
Weder, J., Mordasini, C., & Emsenhuber, A. 2023, A&A, 674, A165, doi: 10.1051/0004-6361/202243453
2023 doi
-
[97]
D., Fairlamb, J
Wichittanakom, C., Oudmaijer, R. D., Fairlamb, J. R., et al. 2020, MNRAS, 493, 234, doi: 10.1093/mnras/staa169
2020 doi
-
[98]
J., Benisty, M., & Andrews, S
Winter, A. J., Benisty, M., & Andrews, S. M. 2024, ApJL, 972, L9, doi: 10.3847/2041-8213/ad6d5d
2024 doi
-
[99]
J., Drake, J
Wright, N. J., Drake, J. J., Mamajek, E. E., & Henry, G. W. 2011, ApJ, 743, 48, doi: 10.1088/0004-637X/743/1/48
2011 doi
-
[100]
T., & Saito, M
Yasui, C., Kobayashi, N., Tokunaga, A. T., & Saito, M. 2014, MNRAS, 442, 2543, doi: 10.1093/mnras/stu1013
2014 doi
Reviewed August 12, 2026 · model on record in the stance chip above.
Discussion (0). Continue with ORCID to comment.