REVIEW 4 major objections 6 minor 38 references
Comprehensive Methodology for Sample Augmentation in EEG Biomarker Studies for Alzheimers Risk Classification
T0 review · 4 major / 6 minor · reviewed 2026-08-12 · deepseek-v4-flash
Pith's one-line read This paper claims that combining multi-site EEG harmonization with matching on age and sex lets a simple decision tree separate asymptomatic PSEN1-E280A Alzheimer's carriers from non-carriers with up to 98% accuracy, 100% recall, and 99%…
desk verdict Workflow is plausible but the reporting is internally contradictory—the confusion matrices cannot come from the stated split, and PSM didn't balance demographics, so the headline accuracies aren't supported. read the letter →
The pith
A machine-rendered reading of the paper's core claim, the machinery that carries it, and where it could break.
The reading
What carries the argument
The central object is propensity-score matching, a procedure that uses logistic regression on age and sex to estimate each subject's probability of carrying the mutation, then removes non-carrier subjects until the control group is two, five, or ten times the carrier group's size. This matching step is what creates the three balanced datasets whose performance the paper compares, and the paper's argument is that balance, not raw sample size, drives the accuracy. Supporting the workflow are a harmonization step that removes recording-site effects while preserving age and sex covariates, and group independent component analysis, which supplies reproducible spatial filters from which 967 candidate features are extracted before the decision tree selects the most informative ones.
What would settle it
Hold the same matched train/test splits fixed, replace the EEG features with age and sex only, and rerun the decision-tree pipeline; if this demographic-only model reproduces the reported ~98% accuracy and 0.99 AUC, the EEG features are not the source of the classification.
Extended reading notes
Core claim
The paper's central claim is that after harmonization, the key obstacle to EEG-based discrimination between asymptomatic E280A carriers and healthy non-carriers is the imbalance between an abundant control group and a scarce carrier group, and that propensity-score matching on age and sex removes that obstacle. In the 5:1 matched sample, a decision-tree model reaches 98% accuracy, 97% precision, 100% recall, and an AUC of 99% on held-out test data; the 2:1 and 10:1 samples reach 91% and 96% accuracy. The authors interpret the 5:1 result as the best trade-off between enough control data and demographic comparability, so the classifier can learn brain-signal differences rather than site or sample-size artifacts. The workflow—standardized preprocessing, harmonization, matching, and decision-tree feature selection—is presented as the reason the model works in small cohorts.
Load-bearing premise
The load-bearing premise is that the matching procedure actually makes the carrier and non-carrier groups comparable in age and sex; if the matched groups still differ sharply in age, the high EEG accuracy may just reflect that age difference rather than a brain-based Alzheimer's signal.
Editorial extensions
If this is right
- If the 5:1 result holds, resting-state EEG could identify asymptomatic PSEN1-E280A carriers with near-perfect recall in small, single-site cohorts.
- The harmonize-then-match pipeline offers a template for other neurodegenerative conditions where one diagnostic group is far rarer than the other.
- Because the 2:1 and 10:1 ratios also exceed 90% accuracy, the method does not depend on one specific class ratio, although 5:1 is reported as the best.
- Multi-site pooling with harmonization could substitute for collecting one large homogeneous dataset, lowering the cost and time needed for EEG biomarker studies.
- The reported AUC of 99% at the 5:1 ratio is the paper's evidence that the balancing step produces a clinically meaningful improvement over earlier resting-state EEG classifiers in this familial-AD setting.
Reading between the lines
- The authors themselves flag representativeness and interpretability limits in their final sections; one concrete failure mode is that their Table 1 shows the matched carrier group is roughly a decade older than the controls, so demographic separation may be doing part of the classification work.
- A direct extension of the paper's logic is to rerun the same matched splits with a classifier trained only on age and sex; if accuracy stays near 98%, the EEG features are not the source of the signal.
- The optimal 5:1 ratio is an empirical property of this dataset, not a fixed law; other cohorts with different age structures or control availability would need to re-estimate the matching ratios.
- Phase-scrambling the EEG before feature extraction would test whether the classification relies on oscillatory brain activity or on non-oscillatory artifacts and demographics; the paper does not report this control.
Editorial analysis
A structured set of objections, weighed in public.
Referee Report
Summary. The manuscript proposes a pipeline for EEG-based classification of asymptomatic PSEN1-E280A mutation carriers (ACr) versus healthy non-carriers (HC) by combining multi-site data harmonization (neuroHarmonize), propensity score matching (PSM) at 2:1, 5:1, and 10:1 ratios, feature selection on decision trees, and evaluation with an 80-20 train-test split. The authors report classification accuracies of 91-98% across ratios, with AUC up to 99%, and claim that balancing sample sizes via PSM significantly improves accuracy. The paper includes descriptions of preprocessing, feature extraction, harmonization, and PSM, with results presented in Tables 1-2 and Figures 2-7.
Significance. If the reported results were valid, the paper would offer a practical recipe for EEG-based Alzheimer's risk classification in small, multi-site cohorts, which is a topic of current interest. The authors make a positive effort to use public datasets (CHBMP, SRM) and to share code repositories, which is commendable and helps reproducibility in principle. However, the central claim that PSM improves classification accuracy is undermined by several internal inconsistencies in the reported data and metrics, and by the apparent failure of PSM to balance the demographic covariates that the authors themselves identify as confounders. The significance is therefore contingent on a thorough reanalysis, and the current evidence does not support the headline conclusions.
major comments (4)
- [Section D and Table 1] The PSM procedure aimed to balance age and sex between ACr and HC groups, but Table 1 shows that the matched groups remain strongly imbalanced on both covariates. For example, at the 5:1 ratio, UdeA1 ACr subjects have mean age 39.78±2.85 years and sex ratio 21/9 F/M, whereas UdeA1 HC subjects have mean age 30.45±4.81 years and sex ratio 47/30 F/M. Since age and sex are associated with both carrier status and EEG measures, the reported classification accuracies (Abstract: 0.92-0.96; Table 2: up to 98%) could be largely driven by demographic differences rather than by EEG biomarkers. The paper provides no no-PSM baseline and no age/sex-only control model, so the claimed improvement attributable to PSM is not demonstrated.
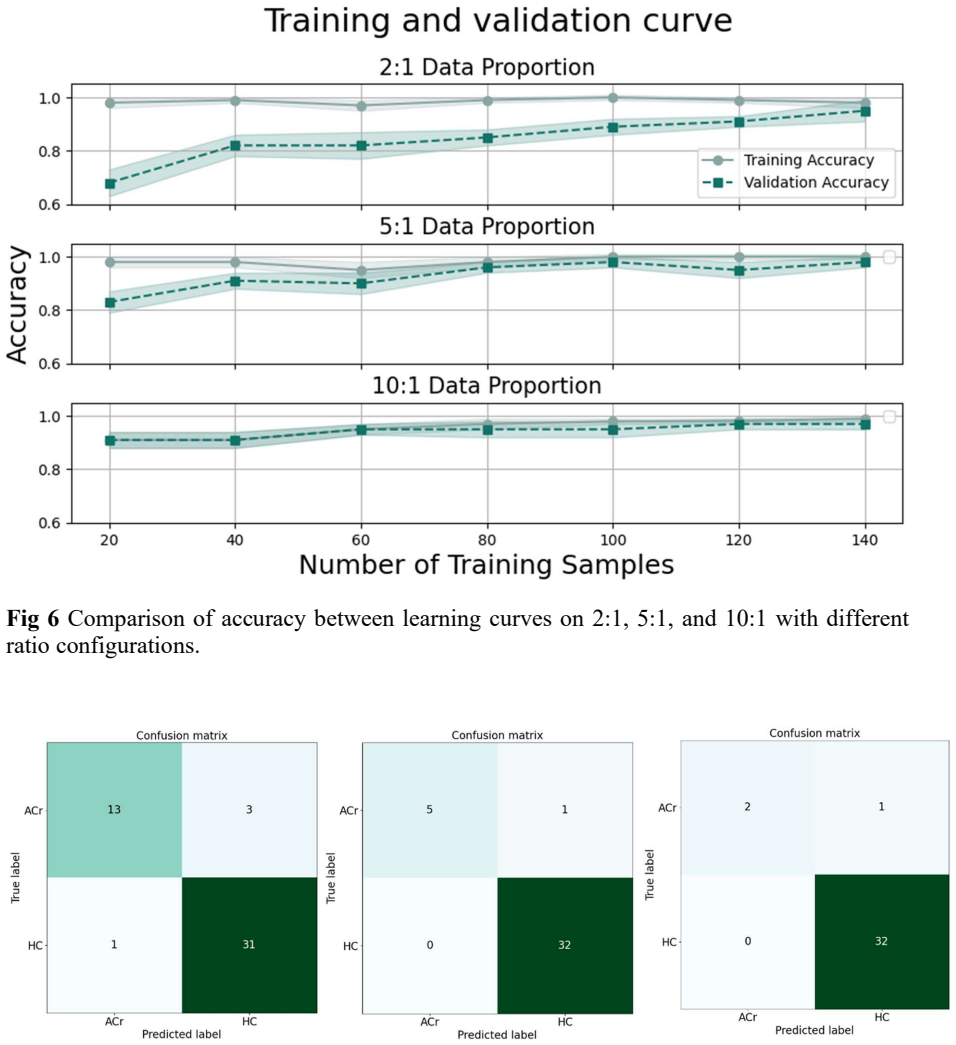
- [Section E, Fig 7, and Table 2] The confusion matrices in Fig 7 are internally inconsistent with the performance metrics in Table 2 and with the stated dataset sizes. For the 2:1 ratio, TP=31, FP=1, FN=3, TN=13 gives precision 96.9% and recall 91.2%, which is the reverse of the reported precision 91% and recall 97%, indicating a labeling swap. For the 5:1 ratio, TP=32 and FN=1 imply 33 ACr subjects in the test set, but the 5:1 ACr group has only 31 subjects in total (Fig 2), and a 20% test split would contain roughly 6 ACr subjects. The 10:1 matrix is similarly impossible, with TP+FN=34 while the 10:1 ACr group contains only 15 subjects. These discrepancies make the reported performance metrics irreproducible from the information given.
- [Section A and Table 1] The subject counts in Table 1 are inconsistent with the original cohort sizes described in the Methods. The Methods state that UdeA1 contains 27 ACr and 17 HC, and UdeA2 contains 22 ACr and 12 HC, yet Table 1 for the 2:1 ratio reports UdeA1 ACr count 68 and UdeA1 HC count 77, and UdeA2 ACr count 11. PSM can only remove or match existing subjects; it cannot increase the number of unique subjects from a single site. This suggests a serious data-handling error or a mislabeling of the table, and it means the true sample sizes underlying all subsequent analyses are unclear.
- [Section E, pseudocode] The feature selection procedure uses an accuracy threshold T, but the value of T is not reported anywhere, and no sensitivity analysis is provided for this threshold. The step 'Assign weights to selected features' is not specified, and the decision tree hyperparameters (depth, splitting criterion, minimum samples) are not given. Together with the arbitrary choice of PSM ratios, these unspecified free parameters leave the reported accuracies without a clear bias-variance assessment and hinder replication.
minor comments (6)
- [Abstract and Results] The Abstract reports accuracy ranging from 0.92 to 0.96, whereas Table 2 and the Results section report accuracies of 91%, 98%, and 96% for the 2:1, 5:1, and 10:1 ratios; these ranges should be reconciled.
- [Fig 2 caption] The caption refers to '457 age- and sex-matched records,' but the three resulting datasets contain 237, 189, and 173 records, which sum to 599; it is unclear what the number 457 represents.
- [Section A] The sentence 'The information used consists of 237 to 173 records' is grammatically unclear and should be rewritten to list the three dataset sizes explicitly.
- [Section E and Table 2] The phrase 'computer precision' in the text and in the Table 2 title is unclear; the authors likely mean 'classification performance metrics.'
- [References] References [19] and [20] cite Python and SciPy documentation for entropy and coherence, respectively; the authors should cite established methodological sources for these signal-processing measures.
- [Section E] The description of cross-validation is ambiguous: the text mentions an 80-20 train-test split and also 'ten-fold iterations,' but it is not clear whether the 10-fold cross-validation is applied only on the training portion or on the full dataset; this should be clarified.
Circularity Check
The model-selection pseudocode trains and evaluates on the same harmonized dataset D, so the reported classification accuracies may be fitted values rather than held-out predictions; the paper's own metrics are also internally inconsistent.
-
fitted input called prediction
[Materials and Methods Section E 'Model selection' (pseudocode); Results Section E, Table 2, Fig 7 caption]
"Feature Selection and Model Evaluation Process ... 1: Load harmonized data: D = load_data() ... 4: Train model with current feature: M_f = train_model(D, f) ... 11: Retrain model with selected features: M = train_model(D, S, W) 12: Generate confusion matrix: C = generate_confusion_matrix(M). Prose: 'For the implementation and validation of the model, an 80-20 train-test split was applied'."
As written, the pseudocode uses the same data object D for feature selection, final model training, and confusion-matrix generation, with no held-out subset created in the algorithm. If this reflects the actual pipeline, the abstract and Table 2 accuracies are in-sample fits, not independent predictions. The claimed 80/20 split appears only in prose and is not implemented in the pseudocode; moreover, the confusion-matrix counts contradict Table 2 (e.g., 5:1 TP=32, FN=1 gives recall 32/33=97%, not 100%; 2:1 precision is 31/32=96.9%, not 91%). Thus the central 'prediction' reduces, by the paper's own algorithm, to fitting the same data, and the reported metrics are statistically forced rather than validated on unseen data.
full rationale
The only concrete circular step is in the model-selection pseudocode: feature selection, final training, and confusion-matrix generation all call train_model(D,...) on the same data object D, with no train/test split shown in the algorithm. If this pseudocode reflects the implemented pipeline, the accuracies in the abstract and Table 2 (0.92-0.96; 98% at 5:1) are in-sample performance, i.e., fitted values presented as predictions. The prose and Fig 7 caption claim an 80/20 split, and the confusion-matrix totals do match 20% of each dataset, so the paper is internally contradictory; the discrepancy between Fig 7 counts and Table 2 metrics further shows the reported metrics are not reliably tied to a held-out evaluation. This is a genuine reduction of the central 'prediction' to fitting the input, warranting a score of 6. The self-citations to [16], [17], and [25] are numerous but not circular in a load-bearing sense: they supply preprocessing and component-extraction methods, not the classification result, and no uniqueness theorem is imported. The PSM failure to balance age/sex (Table 1: 10:1 ACr aged 41.86±2.35, 12F/2M vs HC aged 27-31, mostly male) is a serious confounding/validity problem, but it is not a definitional circularity. No other step reduces by construction.
Assumptions & free parameters
free parameters (3)
- PSM class distribution ratios (2:1, 5:1, 10:1) =
2:1, 5:1, 10:1
- Feature selection accuracy threshold T =
not reported
- Decision tree hyperparameters (e.g., depth, split criterion, min samples) =
not reported
assumptions (4)
- domain assumption Resting-state EEG spectral, coherence, and synchronization features contain information separating asymptomatic E280A carriers from healthy relatives after ComBat harmonization.
- domain assumption ComBat/neuroHarmonize removes site effects while preserving age and sex effects.
- ad hoc to paper gICA components from Ochoa-Gomez et al. [17] are valid reproducible spatial filters in the four cohorts.
- domain assumption Propensity score logistic regression on age and sex produces exchangeable treatment and control groups.
Cite this review
Pith. "Pith review of Comprehensive Methodology for Sample Augmentation in EEG Biomarker Studies for Alzheimers Risk Classification." pith.science (2026). https://pith.science/paper/2OBOWCYN
@misc{pith2026241117717,
  author       = {Pith},
  title        = {Pith review of: Comprehensive Methodology for Sample Augmentation in EEG Biomarker Studies for Alzheimers Risk Classification},
  year         = {2026},
  howpublished = {\url{https://pith.science/paper/2OBOWCYN}},
  note         = {Machine review of arXiv:2411.17717}
}
read the original abstract
Background: Dementia, marked by cognitive decline, is a global health challenge. Alzheimer's disease (AD), the leading type, accounts for ~70% of cases. Electroencephalography (EEG) measures show promise in identifying AD risk, but obtaining large samples for reliable comparisons is challenging. Objective: This study integrates signal processing, harmonization, and statistical techniques to enhance sample size and improve AD risk classification reliability. Methods: We used advanced EEG preprocessing, feature extraction, harmonization, and propensity score matching (PSM) to balance healthy non-carriers (HC) and asymptomatic E280A mutation carriers (ACr). Data from four databases were harmonized to adjust site effects while preserving covariates like age and sex. PSM ratios (2:1, 5:1, 10:1) were applied to assess sample size impact on model performance. The final dataset underwent machine learning analysis with decision trees and cross-validation for robust results. Results: Balancing sample sizes via PSM significantly improved classification accuracy, ranging from 0.92 to 0.96 across ratios. This approach enabled precise risk identification even with limited samples. Conclusion: Integrating data processing, harmonization, and balancing techniques improves AD risk classification accuracy, offering potential for other neurodegenerative diseases.
Figures
Reference graph
Works this paper leans on
- [1]
-
[2]
World Alzheimer Report 2022 | Alzheimer’s Disease International (ADI)
“World Alzheimer Report 2022 | Alzheimer’s Disease International (ADI).” Accessed: Sep. 21,
work page 2022
-
[3]
The precursor of Alzheimer’s disease amyloid A4 protein resembles a cell- surface receptor,
J. Kang et al., “The precursor of Alzheimer’s disease amyloid A4 protein resembles a cell- surface receptor,” Nature, vol. 325, no. 6106, pp. 733–736, 1987, doi: 10.1038/325733A0
-
[4]
Early diagnosis and treatment of Alzheimer’s disease: new definitions and challenges,
M. Pais et al., “Early diagnosis and treatment of Alzheimer’s disease: new definitions and challenges,” Brazilian Journal of Psychiatry, vol. 42, no. 4, p. 431, Jul. 2020, doi: 10.1590/1516-4446-2019-0735
-
[5]
B. Jiao et al., “Neural biomarker diagnosis and prediction to mild cognitive impairment and Alzheimer’s disease using EEG technology,” Alzheimers Res Ther, vol. 15, no. 1, Dec. 2023, doi: 10.1186/S13195-023-01181-1
-
[6]
J. E. DUQUE-GRAJALES et al., “Quantitative EEG analysis disease during resting and memory task in carriers and non-carriers of PS-1 E280A mutation of familial Alzheimer’s,” CES med, pp. 165–176, 2014, Accessed: Sep. 21, 2024. [Online]. Available: http://www.scielo.org.co/scielo.php?script=sci_arttext&pid=S0120-87052014000200002
work page 2014
-
[7]
D. J. A. Smit et al., “Large-scale collaboration in ENIGMA-EEG: A perspective on the meta- analytic approach to link neurological and psychiatric liability genes to electrophysiological brain activity,” Brain Behav, vol. 11, no. 8, Aug. 2021, doi: 10.1002/BRB3.2188
-
[8]
A pipeline for large- scale assessments of dementia EEG connectivity across multicentric settings,
A. S. Ballesteros, P. Prado, A. Ibanez, J. A. M. Perez, and S. Moguilner, “A pipeline for large- scale assessments of dementia EEG connectivity across multicentric settings,” Feb. 2023, doi: 10.31219/OSF.IO/H2WGV
Show all 38 references
-
[9]
Multi-feature computational framework for combined signatures of dementia in underrepresented settings,
S. Moguilner et al., “Multi-feature computational framework for combined signatures of dementia in underrepresented settings,” J Neural Eng, vol. 19, no. 4, p. 046048, Aug. 2022, doi: 10.1088/1741-2552/AC87D0
2022 doi
-
[10]
EEG-IP: an international infant EEG data integration platform for the study of risk and resilience in autism and related conditions,
S. Van Noordt et al., “EEG-IP: an international infant EEG data integration platform for the study of risk and resilience in autism and related conditions,” Mol Med, vol. 26, no. 1, May 2020, doi: 10.1186/S10020-020-00149-3
2020 doi
-
[11]
The brain imaging data structure, a format for organizing and describing outputs of neuroimaging experiments,
K. J. Gorgolewski et al., “The brain imaging data structure, a format for organizing and describing outputs of neuroimaging experiments,” Scientific Data 2016 3:1, vol. 3, no. 1, pp. 1–9, Jun. 2016, doi: 10.1038/sdata.2016.44
2016 doi
-
[12]
Independent Component Analysis </br> Independent Component Analysis: Principles and Practice,
F. Kemp, “Independent Component Analysis </br> Independent Component Analysis: Principles and Practice,” Journal of the Royal Statistical Society: Series D (The Statistician), vol. 52, no. 3, pp. 412–412, Oct. 2003, doi: 10.1111/1467-9884.00369_14
2003
-
[13]
Data Archive for the BRAIN Initiative (DABI),
D. Duncan, R. Garner, S. Brinkerhoff, H. C. Walker, N. Pouratian, and A. W. Toga, “Data Archive for the BRAIN Initiative (DABI),” Sci Data, vol. 10, no. 1, Dec. 2023, doi: 10.1038/S41597-023-01972-Z
2023 doi
-
[14]
Harmonized multi-metric and multi-centric assessment of EEG source space connectivity for dementia characterization,
P. Prado et al., “Harmonized multi-metric and multi-centric assessment of EEG source space connectivity for dementia characterization,” Alzheimer’s & Dementia : Diagnosis, Assessment & Disease Monitoring, vol. 15, no. 3, p. 17, Jul. 2023, doi: 10.1002/DAD2.12455. 13
2023 doi
-
[15]
The central role of the propensity score in observational studies for causal effects,
P. R. Rosenbaum and D. B. Rubin, “The central role of the propensity score in observational studies for causal effects,” Biometrika, vol. 70, no. 1, pp. 41–55, Apr. 1983, doi: 10.1093/BIOMET/70.1.41
1983 doi
-
[16]
Validation of EEG Pre- processing Pipeline by Test-Retest Reliability,
J. X. Suárez-Revelo, J. F. Ochoa-Gómez, and C. A. Tobón-Quintero, “Validation of EEG Pre- processing Pipeline by Test-Retest Reliability,” Communications in Computer and Information Science, vol. 916, pp. 290–299, 2018, doi: 10.1007/978-3-030-00353-1_26
2018 doi
-
[17]
Reproducible Neuronal Components found using Group Independent Component Analysis in Resting State Electroencephalographic Data,
J. F. Ochoa-Gómez et al., “Reproducible Neuronal Components found using Group Independent Component Analysis in Resting State Electroencephalographic Data,” bioRxiv, p. 2023.11.14.566952, Nov. 2023, doi: 10.1101/2023.11.14.566952
2023 doi
-
[18]
A review of multitaper spectral analysis,
B. Babadi and E. N. Brown, “A review of multitaper spectral analysis,” IEEE Trans Biomed Eng, vol. 61, no. 5, pp. 1555–1564, 2014, doi: 10.1109/TBME.2014.2311996
2014
-
[19]
itertools — Functions creating iterators for efficient looping — Python 3.12.6 documentation
“itertools — Functions creating iterators for efficient looping — Python 3.12.6 documentation.” Accessed: Sep. 21, 2024. [Online]. Available: https://docs.python.org/3/library/itertools.html
2024
-
[20]
coherence — SciPy v1.14.1 Manual
“coherence — SciPy v1.14.1 Manual.” Accessed: Sep. 21, 2024. [Online]. Available: https://docs.scipy.org/doc/scipy/reference/generated/scipy.signal.coherence.html
2024
-
[21]
EEG amplitude modulation analysis for semi-automated diagnosis of Alzheimer’s disease,
T. H. Falk, F. J. Fraga, L. Trambaiolli, and R. Anghinah, “EEG amplitude modulation analysis for semi-automated diagnosis of Alzheimer’s disease,” EURASIP J Adv Signal Process, vol. 2012, no. 1, pp. 1–9, Aug. 2012, doi: 10.1186/1687-6180-2012-192/COMMENTS
2012 doi
-
[22]
HERMES: Towards an integrated toolbox to characterize functional and effective brain connectivity,
G. Niso et al., “HERMES: Towards an integrated toolbox to characterize functional and effective brain connectivity,” Neuroinformatics, vol. 11, no. 4, pp. 405–434, Oct. 2013, doi: 10.1007/S12021-013-9186-1/METRICS
2013 doi
-
[23]
Harmonization of large MRI datasets for the analysis of brain imaging patterns throughout the lifespan,
R. Pomponio et al., “Harmonization of large MRI datasets for the analysis of brain imaging patterns throughout the lifespan,” Neuroimage, vol. 208, Mar. 2020, doi: 10.1016/J.NEUROIMAGE.2019.116450
2020
-
[24]
Validation of cross-sectional and longitudinal ComBat harmonization methods for magnetic resonance imaging data on a travelling subject cohort,
S. Richter et al., “Validation of cross-sectional and longitudinal ComBat harmonization methods for magnetic resonance imaging data on a travelling subject cohort,” Neuroimage. Reports, vol. 2, no. 4, Dec. 2022, doi: 10.1016/J.YNIRP.2022.100136
2022
-
[25]
Tackling EEG Test-Retest Reliability with a Pre-Processing Pipeline Based on ICA and Wavelet-ICA
V. Henao Isaza et al., “Tackling EEG Test-Retest Reliability with a Pre-Processing Pipeline Based on ICA and Wavelet-ICA”, doi: 10.2139/SSRN.4580445
-
[26]
Electroencephalography Signal Processing: A Comprehensive Review and Analysis of Methods and Techniques,
A. Chaddad, Y. Wu, R. Kateb, and A. Bouridane, “Electroencephalography Signal Processing: A Comprehensive Review and Analysis of Methods and Techniques,” Sensors 2023, Vol. 23, Page 6434, vol. 23, no. 14, p. 6434, Jul. 2023, doi: 10.3390/S23146434
2023 doi
-
[27]
A deep learning model for the detection of various dementia and MCI pathologies based on resting-state electroencephalography data: A retrospective multicentre study,
Y. Watanabe et al., “A deep learning model for the detection of various dementia and MCI pathologies based on resting-state electroencephalography data: A retrospective multicentre study,” Neural Networks, vol. 171, pp. 242–250, Mar. 2024, doi: 10.1016/J.NEUNET.2023.12.009
2024 doi
-
[28]
Alzheimer’s disease,
P. Scheltens et al., “Alzheimer’s disease,” Lancet, vol. 397, no. 10284, pp. 1577–1590, Apr. 2021, doi: 10.1016/S0140-6736(20)32205-4. 14
2021 doi
-
[29]
A novel method for diagnosing Alzheimer’s disease using deep pyramid CNN based on EEG signals,
W. Xia, R. Zhang, X. Zhang, and M. Usman, “A novel method for diagnosing Alzheimer’s disease using deep pyramid CNN based on EEG signals,” Heliyon, vol. 9, no. 4, Apr. 2023, doi: 10.1016/J.HELIYON.2023.E14858
2023 doi
-
[30]
Electroencephalography-based classification of Alzheimer’s disease spectrum during computer-based cognitive testing,
S. K. Kim, H. Kim, S. H. Kim, J. Bin Kim, and L. Kim, “Electroencephalography-based classification of Alzheimer’s disease spectrum during computer-based cognitive testing,” Scientific Reports 2024 14:1, vol. 14, no. 1, pp. 1–16, Mar. 2024, doi: 10.1038/s41598-024- 55656-8
2024 doi
-
[31]
Resting state EEG biomarkers of cognitive decline associated with Alzheimer’s disease and mild cognitive impairment,
A. H. Meghdadi et al., “Resting state EEG biomarkers of cognitive decline associated with Alzheimer’s disease and mild cognitive impairment,” PLoS One, vol. 16, no. 2, p. e0244180, Feb. 2021, doi: 10.1371/JOURNAL.PONE.0244180
2021 doi
-
[32]
Automatic Classification of Subjects of the PSEN1-E280A Family at Risk of Developing Alzheimer’s Disease Using Machine Learning and Resting State Electroencephalography,
F. J. García-Pretelt, J. X. Suárez-Relevo, D. F. Aguillon-Niño, F. J. Lopera-Restrepo, J. F. Ochoa- Gómez, and C. A. Tobón-Quintero, “Automatic Classification of Subjects of the PSEN1-E280A Family at Risk of Developing Alzheimer’s Disease Using Machine Learning and Resting Sta...
2022 doi
-
[33]
Neural Networks to Recognize Patterns in Topographic Images of Cortical Electrical Activity of Patients with Neurological Diseases,
F. G. A. de Meneses, A. S. Teles, M. Nunes, D. da Silva Farias, and S. Teixeira, “Neural Networks to Recognize Patterns in Topographic Images of Cortical Electrical Activity of Patients with Neurological Diseases,” Brain Topogr, vol. 35, no. 4, pp. 464–480, Jul. 2022, doi: 10....
2022 doi
-
[34]
EEG functional connectivity and deep learning for automatic diagnosis of brain disorders: Alzheimer’s disease and schizophrenia,
C. L. Alves, A. M. Pineda, K. Roster, C. Thielemann, and F. A. Rodrigues, “EEG functional connectivity and deep learning for automatic diagnosis of brain disorders: Alzheimer’s disease and schizophrenia,” Journal of Physics: Complexity, vol. 3, no. 2, Oct. 2021, doi: 10.1088/2...
2021 doi
-
[35]
An integrative approach for the analysis of risk and health across the life course: challenges, innovations, and opportunities for life course research,
S. Zuber et al., “An integrative approach for the analysis of risk and health across the life course: challenges, innovations, and opportunities for life course research,” Discover social science and health, vol. 3, no. 1, p. 14, Jul. 2023, doi: 10.1007/S44155-023-00044-2
2023 doi
-
[36]
Dementia ConnEEGtome: Towards multicentric harmonization of EEG connectivity in neurodegeneration,
P. Prado et al., “Dementia ConnEEGtome: Towards multicentric harmonization of EEG connectivity in neurodegeneration,” International Journal of Psychophysiology, vol. 172, pp. 24–38, Feb. 2022, doi: 10.1016/J.IJPSYCHO.2021.12.008
2022 doi
-
[37]
Improving generalizability and study design of Alzheimer’s disease cohort studies in the United States by including under-represented populations,
M. R. Mindt et al., “Improving generalizability and study design of Alzheimer’s disease cohort studies in the United States by including under-represented populations,” Alzheimers Dement, vol. 19, no. 4, pp. 1549–1557, Apr. 2023, doi: 10.1002/ALZ.12823. 15 Table 1. Summary cha...
2023 doi
-
[2024]
Available: https://www.alzint.org/resource/world-alzheimer-report-2022/
[Online]. Available: https://www.alzint.org/resource/world-alzheimer-report-2022/
2022
Reviewed August 12, 2026 · model on record in the stance chip above.
Discussion (0). Continue with ORCID to comment.