REVIEW 5 major objections 6 minor 40 references
A Novel Pareto-optimal Ranking Method for Comparing Multi-objective Optimization Algorithms
T0 review · 5 major / 6 minor · reviewed 2026-08-12 · deepseek-v4-flash
Pith's one-line read Pareto sorting ranks optimization algorithms without choosing metric weights.
desk verdict A clean, simple NDS-based multi-metric ranking method that is plausible on single problems, but its cross-problem aggregate ranking rests on an unproven commensurability assumption; worth a serious look with more validation. read the letter →
The pith
A machine-rendered reading of the paper's core claim, the machinery that carries it, and where it could break.
The reading
What carries the argument
The engine is non-dominated sorting (NDS) applied to a matrix of $A \times R$ points, where $A$ is the number of algorithms, $R$ the number of runs, and each point is an $M$-dimensional vector of indicator scores after sign reversal so all metrics are minimized. NDS strips off successive Pareto fronts, producing level counts $n_{a_i l_j}$ for each algorithm at each level. Four scoring rules convert those counts into ranks: Olympic compares level-1 counts lexicographically level by level; linear weights levels by $L, L-1, \ldots, 1$; exponential weights them by $2^0, 2^{-1}, \ldots, 2^{-(L-1)}$; and adaptive sums, over all levels, the ratio of an algorithm's cumulative count at that level to the total cumulative count. The method's parameter-free character comes from relying on dominance structure rather than on user-chosen metric weights.
What would settle it
Build a two-algorithm experiment on a mix of intentionally easy and intentionally hard problems where algorithm A beats B on every easy problem and B beats A on every hard problem. The final ranking sums level counts across problems, so varying only the number of easy versus hard problems in the suite should flip the winning algorithm without any algorithm changing; if it does, the level-count aggregation is not a stable basis for ranking.
Extended reading notes
Core claim
The paper's central claim is that the conflict between performance indicators can be turned into a Pareto dominance problem rather than a weighting problem. Each run of an algorithm becomes one point in a space whose coordinates are indicator scores; non-dominated sorting layers these points into levels, and an algorithm is better the more of its runs occupy the early levels. The four scoring methods (Olympic, linear, exponential, and adaptive) are alternative ways to read those counts into a total order. The authors report that with the two official metrics, HV and IGD, their method yields rankings comparable to the 2018 CEC committee's, and with all ten metrics it produces a broader leaderboard headed by fastCAR and closed by RPEA. They conclude that the approach gives a fair, parameter-free multi-metric comparison and can serve any field where entities are judged by several conflicting criteria.
Load-bearing premise
The method assumes a run's Pareto level means the same thing across every test problem and every objective count, so that counts from easy and hard problems can be added up; if that equivalence fails, the totals that settle the final ranking are not measuring one comparable quantity.
Editorial extensions
If this is right
- A researcher can drop manual weight selection: any set of indicators, old or newly proposed, plugs into the same procedure without changing the method.
- Benchmarks become composable: the published per-run indicator values can be re-ranked with different metric subsets to test how sensitive a leaderboard is.
- The method transfers to any domain with multiple conflicting quality scores, such as comparing machine learning models on accuracy, latency, and robustness, which the paper lists but does not benchmark.
- Because the adaptive rule showed the highest average pairwise correlation with the other rules, the paper recommends it, or the average rank across all four, when a single overall ranking is needed.
- If the paper is right, multi- and many-objective algorithm comparisons no longer need to be tied to one champion metric, and the official competition ranking shown in Table VI can be reproduced using only that competition's two metrics.
Reading between the lines
- Editor's inference: because final ranks sum level counts across problems and objective counts, the method rewards algorithms that score well on easy problems as much as on hard ones; a user comparing across benchmark suites of different difficulty will see rank flips that are not caused by algorithmic change.
- Editor's inference: the method counts each run equally, so it does not distinguish a run that just barely reaches level 1 from one that dominates the level; weighting runs by dominance margin or applying $\varepsilon$-dominance, which the paper mentions as a safeguard, would make the ranking more robust.
- Editor's inference: a leave-one-metric-out ablation on the ten indicators would reveal which indicators carry the leaderboard; the paper reports the full ten-metric ranking but not this diagnostic, and it is directly testable from the same per-run scores.
- Editor's inference: the same NDS-plus-counting scheme could be used for online algorithm selection or portfolio construction, where many metrics are observed per configuration and one must produce a total order without inventing a scalar objective.
Editorial analysis
A structured set of objections, weighed in public.
Referee Report
Summary. The manuscript proposes a method for ranking multi-/many-objective optimization algorithms using multiple performance indicators. For each algorithm and run, M indicator values form an M-dimensional point; all A×R points are pooled and subjected to non-dominated sorting (NDS) to assign Pareto levels, and each algorithm's contribution per level is counted. Four ranking techniques (Olympic, linear, exponential, and adaptive) convert these counts into overall ranks. The method is applied to rank ten CEC 2018 algorithms on 15 MaF problems with 5, 10, and 15 objectives using ten indicators, and the resulting ranks are compared with the official CEC rankings based on IGD and HV. The paper claims that the approach yields reliable rankings "regardless of the objectives, metrics, and algorithms employed" and that it is parameter-free.
Significance. The idea of treating indicators as objectives and using Pareto sorting to avoid explicit weighting is natural and potentially useful. The construction of NDS levels from per-run metric vectors is clearly described, and the four scoring rules are transparent and reproducible from the reported tables. The paper has the merit of making the full count matrix available, and the sanity check in Section V.E—where the proposed method using only HV and IGD broadly matches the CEC committee ranking—shows that the pipeline is not arbitrary. However, the central reliability claim exceeds what the evidence supports: the only external validation is one competition benchmark, there is no sensitivity analysis, and the cross-problem aggregation at the heart of the overall ranking rests on an unexamined commensurability assumption. The per-problem ranking experiments are sound but do not by themselves justify the "regardless of objectives/metrics/algorithms" conclusion.
major comments (5)
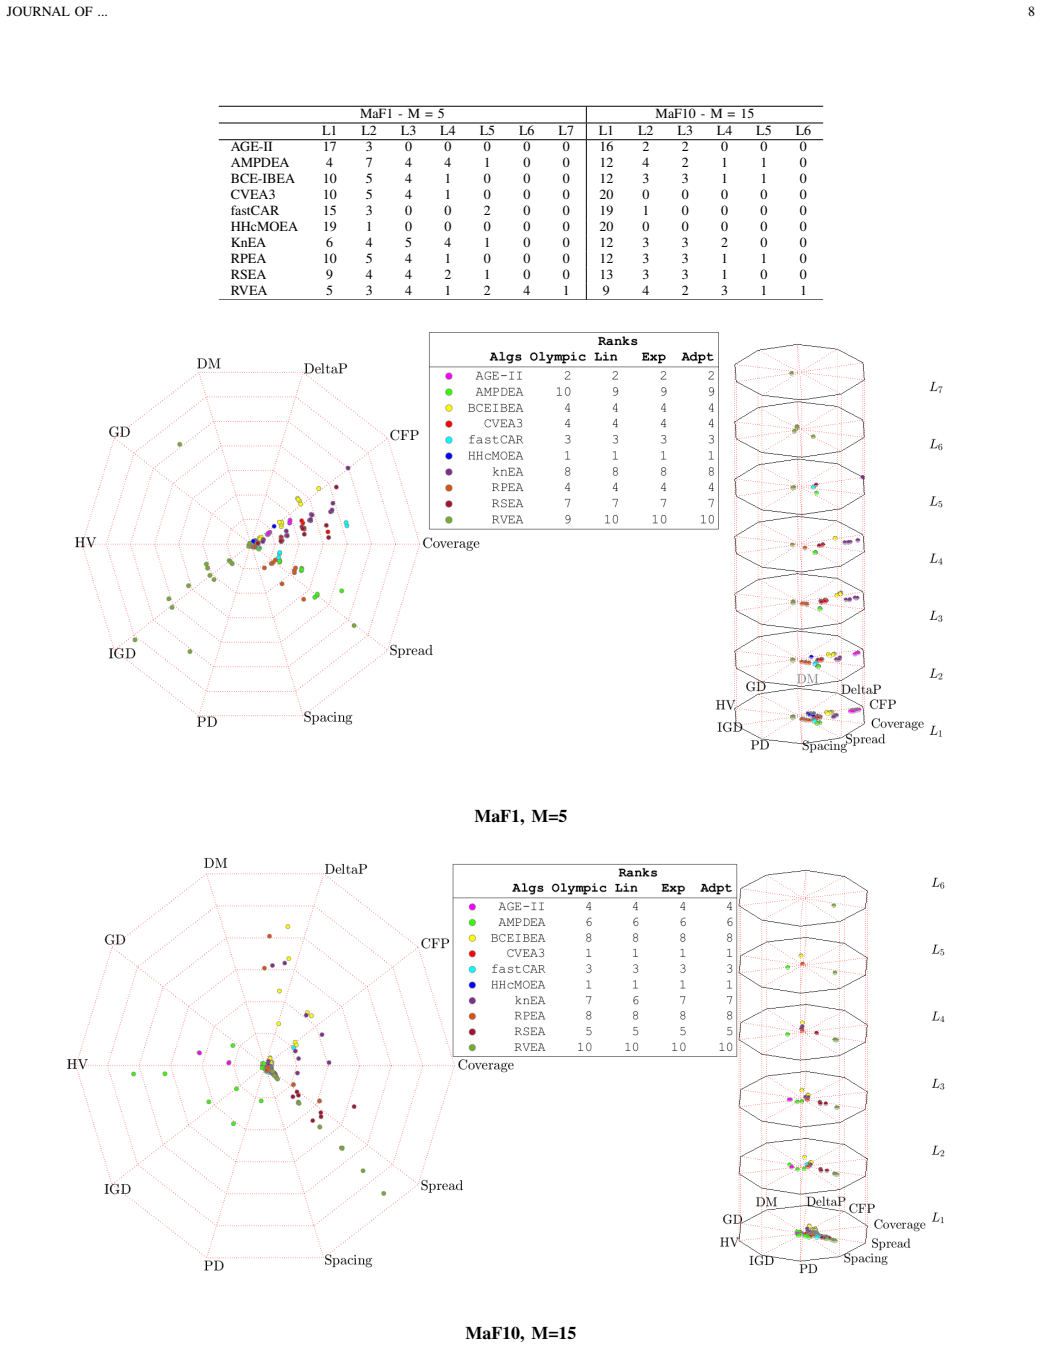
- [Section V.D, Tables IV and V] The overall ranking adds, for each algorithm, the number of NDS points at the same level index l across all 15 MaF problems and across M \in {5,10,15}. This presupposes that a point on level l in one problem's NDS is equivalent to a point on level l in another problem's NDS. Since NDS levels are ordinal and depend on the shape of the A × R metric-score cloud, which varies with problem geometry, number of objectives, and metric set, the premise is not established. The linear, exponential, and adaptive scores in Eqs. (17), (18), and (21) then weight these aggregated counts by level index, so Table V and the claim in Section I of reliability "regardless of the objectives, metrics, and algorithms employed" are not justified. The authors should either provide a commensurability argument (e.g., invariance properties) or restrict the claim to per-problem and per-objective-count rankings.
- [Section III and Section IV, Step 4] Two-set coverage C(A,B) is defined in Eq. (7) as a binary indicator comparing two approximation sets, but the proposed method's input matrix in Section IV, Step 4, requires one scalar value per algorithm per run for each of the ten metrics. The paper does not specify how C is turned into a per-run unary score—for example, whether each run is compared against all other runs and averaged, or against a reference set. Without this specification, the ten-dimensional input used in Sections V.B–V.D is not well-defined for one of the ten indicators, and the reported results cannot be reproduced.
- [Section IV, Eqs. (17)–(21) and Section I] The manuscript describes the method as "parameter-free" (Sections I and VI), but the four ranking techniques introduce hand-chosen weighting schemes: linear weights L, L−1, ..., 1 in Eq. (17), exponential weights 2^0, 2^{−1}, ... in Eq. (18), and cumulative-ratio weights in Eq. (21). These choices change the final ranking, as the paper itself notes (e.g., AGE-II is 5th by Olympic but 7th by linear in Table V). No sensitivity analysis or selection criterion is provided, so the parameter-free claim is not supported. At minimum, the authors should qualify the claim or show that the rankings are stable under reasonable alternative weight schedules.
- [Section V, Tables III–VI] The reliability claim is not backed by statistical evidence. The results report only point rankings; there are no error bars, significance tests, or sensitivity analyses with respect to the chosen metric set, the number of runs (R=20), the weighting scheme, or the handling of metric scales (e.g., inversion versus sign change). The comparison against CEC2018 in Section V.E is a single case, and the ten-metric versus two-metric rankings differ substantially; the paper attributes this difference to the metric set but does not validate the ten-metric ranking against any ground truth. A sensitivity analysis or a more cautious interpretation is needed before the method can be called reliable "regardless of" the inputs.
- [Section V.E] The validation in Section V.E compares the proposed method with the CEC ranking only when both use the same two metrics (HV and IGD). That comparison tests the NDS-plus-counting mechanism but not the paper's claimed advantage of using many metrics. The ten-metric ranking is presented without any external validation or comparison against an existing multi-metric ranking procedure, such as the ensemble method of Yen et al. [19]. A meaningful validation would require a comparative baseline or a known ground truth for multi-metric ranking.
minor comments (6)
- [Section V.E, paragraph 1] "ECE2018 committee" appears to be a typo; it should read "CEC2018 committee."
- [Section IV, Eq. (18)] The text states that the decreasing weights are 20, 2^{−1}, 2^{−3}, ..., but the formula uses 2^0, 2^{−1}, 2^{−2}, ...; these are inconsistent and should be aligned.
- [Section V.D, paragraph 1] The sentence "we have a total of nine hundred 10-dimensional points" is ambiguous: each algorithm contributes 900 points (15 problems × 3 objective counts × 20 runs), so the total across ten algorithms is 9,000 points. Please clarify.
- [Table II] Table II lists MaF1 through MaF9 and MaF11 through MaF15 but omits MaF10, although MaF10 is used in Table III and Figure 1; please add the missing row or explain why it is absent.
- [Section IV, matrix display] The matrix display after Step 4 contains garbled repeated labels such as "m1m1m1" and "a1,1a1,1a1,1"; use standard matrix notation for readability.
- [Figure 2 caption] The caption refers to "10-objective" and "15-objective" MaF problems; for consistency with the rest of the paper, consider writing "10-objective" and "15-objective" rather than "10-objective" and "15-objective" if the intended meaning is the number of objectives M.
Circularity Check
No significant circularity: the ranking is a direct, parameter-free function of the input metric scores, and the CEC comparison is an external sanity check rather than a fitted target.
full rationale
The paper's derivation chain is self-contained in the sense that it defines an algorithm: performance scores from a chosen set of indicators are treated as M-dimensional vectors, non-dominated sorting partitions them into Pareto levels, and Eqs. (16)-(21) compute algorithm scores from the resulting level counts. No parameter is fitted to an external result, and no 'prediction' is statistically forced by construction. The final ranking is literally a function of the submitted metric values, so there is no fitted-input-called-prediction pattern. The comparison in Section V.E uses the same HV and IGD metrics as the CEC committee, but the committee's ranking is produced by a different aggregation rule (sum of reciprocal rank values) and is used only as an external benchmark, not as a training signal. The authors' suggestion to prefer the adaptive method because it has higher average pairwise correlation with the other methods is an internal-consistency argument, not a circular derivation. The only potentially questionable step is the cross-problem aggregation in Section V.D, where Pareto-level counts from problems with different objective counts are summed as if level indices were commensurable; this is an assumption about validity and interpretation, not a circularity in the sense of the derivation reducing to its own inputs. Self-citations, such as the RadViz visualization reference [39], appear only as auxiliary tools and are not load-bearing for the central ranking claim. Accordingly, no specific circular step can be quoted and exhibited, and the appropriate score is 0.
Assumptions & free parameters
free parameters (3)
- Linear level weights =
w_l = L - l + 1 for l = 1 to L
- Exponential level weights =
w_l = 2^{-(l-1)} for l = 1 to L
- Adaptive cumulative weights =
ratio CW(ai,l) / TotalCW(l), summed over levels
assumptions (5)
- standard math Non-dominated sorting correctly partitions a finite set of vectors into Pareto levels.
- domain assumption Each performance indicator can be treated as an objective in a minimization problem, and per-run score vectors are the units of comparison.
- domain assumption Pareto level indices are commensurable across different test problems and different numbers of objectives.
- ad hoc to paper A binary indicator such as two-set coverage can be reduced to a unary per-run score.
- domain assumption The specific set of ten indicators is a sufficient and unbiased basis for ranking.
Cite this review
Pith. "Pith review of A Novel Pareto-optimal Ranking Method for Comparing Multi-objective Optimization Algorithms." pith.science (2026). https://pith.science/paper/QTHI22VS
@misc{pith2026241117999,
  author       = {Pith},
  title        = {Pith review of: A Novel Pareto-optimal Ranking Method for Comparing Multi-objective Optimization Algorithms},
  year         = {2026},
  howpublished = {\url{https://pith.science/paper/QTHI22VS}},
  note         = {Machine review of arXiv:2411.17999}
}
read the original abstract
As the interest in multi- and many-objective optimization algorithms grows, the performance comparison of these algorithms becomes increasingly important. A large number of performance indicators for multi-objective optimization algorithms have been introduced, each of which evaluates these algorithms based on a certain aspect. Therefore, assessing the quality of multi-objective results using multiple indicators is essential to guarantee that the evaluation considers all quality perspectives. This paper proposes a novel multi-metric comparison method to rank the performance of multi-/ many-objective optimization algorithms based on a set of performance indicators. We utilize the Pareto optimality concept (i.e., non-dominated sorting algorithm) to create the rank levels of algorithms by simultaneously considering multiple performance indicators as criteria/objectives. As a result, four different techniques are proposed to rank algorithms based on their contribution at each Pareto level. This method allows researchers to utilize a set of existing/newly developed performance metrics to adequately assess/rank multi-/many-objective algorithms. The proposed methods are scalable and can accommodate in its comprehensive scheme any newly introduced metric. The method was applied to rank 10 competing algorithms in the 2018 CEC competition solving 15 many-objective test problems. The Pareto-optimal ranking was conducted based on 10 well-known multi-objective performance indicators and the results were compared to the final ranks reported by the competition, which were based on the inverted generational distance (IGD) and hypervolume indicator (HV) measures. The techniques suggested in this paper have broad applications in science and engineering, particularly in areas where multiple metrics are used for comparisons. Examples include machine learning and data mining.
Figures

Reference graph
Works this paper leans on
-
[19]
Performance metric ensemble for multiobjective evolutionary algorithms,
G. G. Yen and Z. He, “Performance metric ensemble for multiobjective evolutionary algorithms,” IEEE Transactions on Evolutionary Computa- tion, vol. 18, no. 1, pp. 131–144, 2013
work page 2013
-
[1]
Y . Hua, Q. Liu, K. Hao, and Y . Jin, “A survey of evolutionary algorithms for multi-objective optimization problems with irregular pareto fronts,” IEEE/CAA Journal of Automatica Sinica , vol. 8, no. 2, pp. 303–318, 2021
work page 2021
-
[2]
Machine learning-based framework to cover optimal pareto-front in many-objective optimization,
A. Asilian Bidgoli, S. Rahnamayan, B. Erdem, Z. Erdem, A. Ibrahim, K. Deb, and A. Grami, “Machine learning-based framework to cover optimal pareto-front in many-objective optimization,” Complex & Intel- ligent Systems, vol. 8, no. 6, pp. 5287–5308, 2022
work page 2022
-
[3]
A comprehensive review on multi-objective optimization techniques: Past, present and future,
S. Sharma and V . Kumar, “A comprehensive review on multi-objective optimization techniques: Past, present and future,” Archives of Compu- tational Methods in Engineering , vol. 29, no. 7, pp. 5605–5633, 2022
work page 2022
-
[4]
K.-J. Du, J.-Y . Li, H. Wang, and J. Zhang, “Multi-objective multi- criteria evolutionary algorithm for multi-objective multi-task optimiza- tion,” Complex & Intelligent Systems , pp. 1–18, 2022
work page 2022
-
[5]
A critical survey of performance indices for multi-objective optimisation,
T. Okabe, Y . Jin, and B. Sendhoff, “A critical survey of performance indices for multi-objective optimisation,” in The 2003 Congress on Evolutionary Computation, 2003. CEC’03. , vol. 2. IEEE, 2003, pp. 878–885
work page 2003
-
[6]
Comparison of multiobjective evolutionary algorithms: Empirical results,
E. Zitzler, K. Deb, and L. Thiele, “Comparison of multiobjective evolutionary algorithms: Empirical results,” Evolutionary computation , vol. 8, no. 2, pp. 173–195, 2000
work page 2000
-
[7]
Performance metrics in multi-objective optimization,
N. Riquelme, C. V on L ¨ucken, and B. Baran, “Performance metrics in multi-objective optimization,” in 2015 Latin American Computing Conference (CLEI), 2015, pp. 1–11
2015
Show all 40 references
-
[8]
Quality evaluation of solution sets in multiobjective optimisation: A survey,
M. Li and X. Yao, “Quality evaluation of solution sets in multiobjective optimisation: A survey,” ACM Computing Surveys (CSUR) , vol. 52, no. 2, pp. 1–38, 2019
2019
-
[9]
Per- formance indicators in multiobjective optimization,
C. Audet, J. Bigeon, D. Cartier, S. Le Digabel, and L. Salomon, “Per- formance indicators in multiobjective optimization,” European journal of operational research, vol. 292, no. 2, pp. 397–422, 2021
2021
-
[10]
Multiobjective optimization using evolutionary algorithms—a comparative case study,
E. Zitzler and L. Thiele, “Multiobjective optimization using evolutionary algorithms—a comparative case study,” in International conference on parallel problem solving from nature . Springer, 1998, pp. 292–301
1998
-
[11]
D. A. Van Veldhuizen, Multiobjective evolutionary algorithms: clas- sifications, analyses, and new innovations . Air Force Institute of Technology, 1999
1999
-
[12]
Solving multiobjective optimization problems using an artificial immune system,
C. A. C. Coello and N. C. Cort ´es, “Solving multiobjective optimization problems using an artificial immune system,” Genetic programming and evolvable machines, vol. 6, no. 2, pp. 163–190, 2005
2005
-
[13]
Fault tolerant design using single and multicriteria genetic algorithm optimization,
J. R. Schott, “Fault tolerant design using single and multicriteria genetic algorithm optimization,” Ph.D. dissertation, Massachusetts Institute of Technology, 1995
1995
-
[14]
Multiobjective evolutionary algorithms: a com- parative case study and the strength pareto approach,
E. Zitzler and L. Thiele, “Multiobjective evolutionary algorithms: a com- parative case study and the strength pareto approach,” IEEE transactions on Evolutionary Computation , vol. 3, no. 4, pp. 257–271, 1999
1999
-
[15]
Performance metrics in multi-objective optimization,
N. Riquelme, C. V on L ¨ucken, and B. Baran, “Performance metrics in multi-objective optimization,” in 2015 Latin American computing conference (CLEI). IEEE, 2015, pp. 1–11
2015
-
[16]
Performance evaluation metrics for multi-objective evolutionary al- gorithms in search-based software engineering: Systematic literature review,
J. A. Nuh, T. W. Koh, S. Baharom, M. H. Osman, and S. N. Kew, “Performance evaluation metrics for multi-objective evolutionary al- gorithms in search-based software engineering: Systematic literature review,” Applied Sciences, vol. 11, no. 7, p. 3117, 2021
2021
-
[17]
Performance assessment of multiobjective optimizers: An analysis and review,
E. Zitzler, L. Thiele, M. Laumanns, C. M. Fonseca, and V . G. Da Fon- seca, “Performance assessment of multiobjective optimizers: An analysis and review,” IEEE Transactions on evolutionary computation , vol. 7, no. 2, pp. 117–132, 2003
2003
-
[18]
Consistencies and contra- dictions of performance metrics in multiobjective optimization,
S. Jiang, Y .-S. Ong, J. Zhang, and L. Feng, “Consistencies and contra- dictions of performance metrics in multiobjective optimization,” IEEE transactions on cybernetics , vol. 44, no. 12, pp. 2391–2404, 2014
2014
-
[20]
On set-based multiobjective op- timization,
E. Zitzler, L. Thiele, and J. Bader, “On set-based multiobjective op- timization,” IEEE Transactions on Evolutionary Computation , vol. 14, no. 1, pp. 58–79, 2009
2009
-
[21]
Diversity metrics in multi-objective optimization: Review and perspective,
J. Yan, C. Li, Z. Wang, L. Deng, and D. Sun, “Diversity metrics in multi-objective optimization: Review and perspective,” in 2007 IEEE International Conference on Integration Technology . IEEE, 2007, pp. 553–557
2007
-
[22]
The impact of quality indicators on the rating of multi-objective evolutionary algorithms,
M. Ravber, M. Mernik, and M. ˇCrepinˇsek, “The impact of quality indicators on the rating of multi-objective evolutionary algorithms,” Applied Soft Computing , vol. 55, pp. 265–275, 2017
2017
-
[23]
A fast and elitist multiobjective genetic algorithm: NSGA-II,
K. Deb, A. Pratap, S. Agarwal, and T. Meyarivan, “A fast and elitist multiobjective genetic algorithm: NSGA-II,” IEEE transactions on evo- lutionary computation, vol. 6, no. 2, pp. 182–197, 2002. JOURNAL OF ... 13
2002
-
[24]
Diversity assessment of multi-objective evolutionary algorithms: Performance metric and bench- mark problems [research frontier],
Y . Tian, R. Cheng, X. Zhang, M. Li, and Y . Jin, “Diversity assessment of multi-objective evolutionary algorithms: Performance metric and bench- mark problems [research frontier],” IEEE Computational Intelligence Magazine, vol. 14, no. 3, pp. 61–74, 2019
2019
-
[25]
Using the averaged hausdorff distance as a performance measure in evolutionary multiobjective optimization,
O. Schutze, X. Esquivel, A. Lara, and C. A. C. Coello, “Using the averaged hausdorff distance as a performance measure in evolutionary multiobjective optimization,” IEEE Transactions on Evolutionary Com- putation, vol. 16, no. 4, pp. 504–522, 2012
2012
-
[26]
Diversity assessment in many-objective optimization,
H. Wang, Y . Jin, and X. Yao, “Diversity assessment in many-objective optimization,” IEEE transactions on cybernetics , vol. 47, no. 6, pp. 1510–1522, 2016
2016
-
[27]
Multi-objective self-adaptive differential evolution with elitist archive and crowding entropy-based diversity measure,
Y .-N. Wang, L.-H. Wu, and X.-F. Yuan, “Multi-objective self-adaptive differential evolution with elitist archive and crowding entropy-based diversity measure,” Soft Computing, vol. 14, no. 3, pp. 193–209, 2010
2010
-
[28]
Running performance metrics for evolutionary multi-objective optimization,
K. Deb and S. Jain, “Running performance metrics for evolutionary multi-objective optimization,” 2002
2002
-
[29]
A fast approximation-guided evolutionary multi-objective algorithm,
M. Wagner and F. Neumann, “A fast approximation-guided evolutionary multi-objective algorithm,” in Proceedings of the 15th annual conference on genetic and evolutionary computation , 2013, pp. 687–694
2013
-
[30]
Pareto or non-pareto: Bi-criterion evolution in multiobjective optimization,
M. Li, S. Yang, and X. Liu, “Pareto or non-pareto: Bi-criterion evolution in multiobjective optimization,” IEEE Transactions on Evolutionary Computation, vol. 20, no. 5, pp. 645–665, 2015
2015
-
[31]
A cost value based evolutionary many- objective optimization algorithm with neighbor selection strategy,
J. Yuan, H.-L. Liu, and F. Gu, “A cost value based evolutionary many- objective optimization algorithm with neighbor selection strategy,” in 2018 IEEE Congress on Evolutionary Computation (CEC). IEEE, 2018, pp. 1–8
2018
-
[32]
A many-objective evolutionary algorithm with fast clustering and reference point redistribution,
M. Zhao, H. Ge, H. Han, and L. Sun, “A many-objective evolutionary algorithm with fast clustering and reference point redistribution,” in2018 IEEE Congress on Evolutionary Computation (CEC) . IEEE, 2018, pp. 1–6
2018
-
[33]
A hyper-heuristic collaborative multi-objective evolutionary algorithm,
G. Fritsche and A. Pozo, “A hyper-heuristic collaborative multi-objective evolutionary algorithm,” in 2018 7th Brazilian Conference on Intelligent Systems (BRACIS). IEEE, 2018, pp. 354–359
2018
-
[34]
A knee point-driven evolutionary algorithm for many-objective optimization,
X. Zhang, Y . Tian, and Y . Jin, “A knee point-driven evolutionary algorithm for many-objective optimization,” IEEE Transactions on Evo- lutionary Computation, vol. 19, no. 6, pp. 761–776, 2014
2014
-
[35]
Many-objective evolution- ary optimization based on reference points,
Y . Liu, D. Gong, X. Sun, and Y . Zhang, “Many-objective evolution- ary optimization based on reference points,” Applied Soft Computing , vol. 50, pp. 344–355, 2017
2017
-
[36]
A radial space division based evolutionary algorithm for many-objective optimization,
C. He, Y . Tian, Y . Jin, X. Zhang, and L. Pan, “A radial space division based evolutionary algorithm for many-objective optimization,” Applied Soft Computing, vol. 61, pp. 603–621, 2017
2017
-
[37]
A reference vector guided evolutionary algorithm for many-objective optimization,
R. Cheng, Y . Jin, M. Olhofer, and B. Sendhoff, “A reference vector guided evolutionary algorithm for many-objective optimization,” IEEE Transactions on Evolutionary Computation, vol. 20, no. 5, pp. 773–791, 2016
2016
-
[38]
A benchmark test suite for evolutionary many-objective optimization,
R. Cheng, M. Li, Y . Tian, X. Zhang, S. Yang, Y . Jin, and X. Yao, “A benchmark test suite for evolutionary many-objective optimization,” Complex & Intelligent Systems , vol. 3, no. 1, pp. 67–81, 2017
2017
-
[39]
Pareto-radvis: A novel visualization scheme for many-objective op- timization,
M. Nasrolahzadeh, A. Ibrahim, S. Rahnamayan, and J. Haddadnia, “Pareto-radvis: A novel visualization scheme for many-objective op- timization,” in 2020 IEEE International Conference on Systems, Man, and Cybernetics (SMC) . IEEE, 2020, pp. 3868–3873
2020
-
[40]
A new evolutionary decision theory for many-objective optimization problems,
Z. Kang, L. Kang, X. Zou, M. Liu, C. Li, M. Yang, Y . Li, Y . Chen, and S. Zeng, “A new evolutionary decision theory for many-objective optimization problems,” in Advances in Computation and Intelligence: Second International Symposium, ISICA 2007 Wuhan, China, September 21-23...
2007
Reviewed August 12, 2026 · model on record in the stance chip above.
Discussion (0). Continue with ORCID to comment.