REVIEW 4 major objections 5 minor 79 references
Effects of isotherm patterns on cellular interface morphologies of melt pool origin
T0 review · 4 major / 5 minor · reviewed 2026-08-12 · deepseek-v4-flash
Pith's one-line read Small variations in isotherm shape, at fixed gradient and velocity, change cellular solidification microstructure in a melt pool.
desk verdict Solid first 3D survey of isotherm-shape effects on cellular solidification; the qualitative story holds, but the pulsed case and missing parameters keep the quantitative claims from being fully trustworthy. read the letter →
The pith
A machine-rendered reading of the paper's core claim, the machinery that carries it, and where it could break.
The reading
What carries the argument
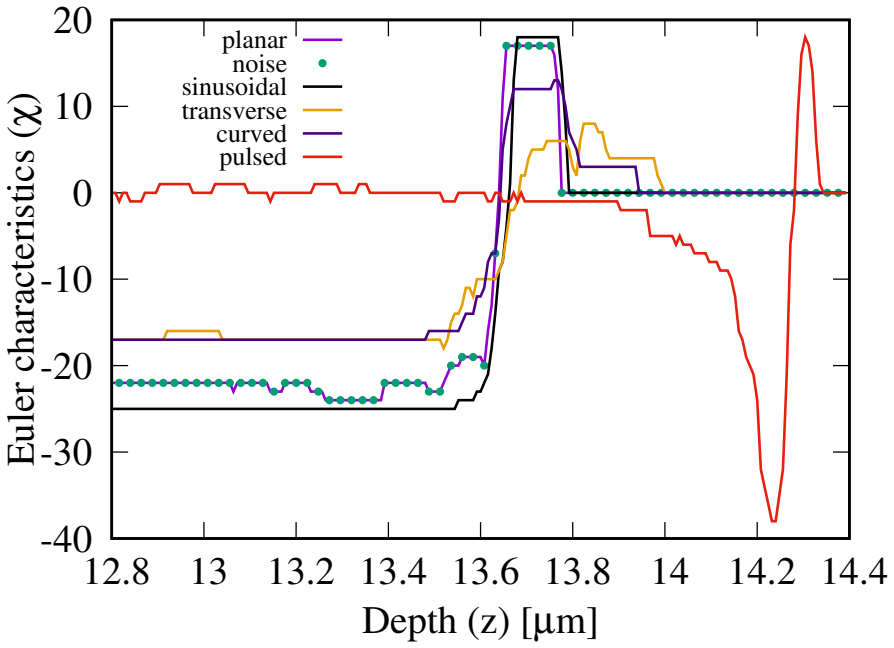
The load-bearing machinery is a quantitative phase-field model for dilute binary alloy solidification with a frozen temperature approximation: the temperature field is prescribed analytically and advected rigidly at constant velocity $V$ with constant gradient $G$, so the only thing that changes between runs is the shape of the isotherm surface. Five distorted isotherms are compared with the planar reference: Gaussian-noise-perturbed, sinusoidal, transverse (tilted by angle $\varphi$), parabolically curved, and pulsed (planar isotherm during the laser-on period, uniform temperature during the laser-off period). The resulting microstructures are read out through solid-fraction profiles $f_s(z)$, the Euler characteristic $\chi(z)$ of solid-liquid connectivity in transverse planes, mean cell spacing $\lambda_c$, line concentration profiles, and the microsegregation ratio $k_v = c_s^*/c_{\max}$; the zero crossing of $\chi$ locates the bridging plane where the mushy zone transitions from liquid-like to solid-like.
What would settle it
Run a directional-solidification experiment, or a coupled thermal-fluid solidification simulation, in which only the curvature of the temperature isotherm is changed while $G$ and $V$ stay fixed; if cell spacing, mushy-zone depth, and microsegregation do not shift by roughly the reported amounts (~15%, ~60%, and ~14%), the central claim fails. A practical version would compare two laser beam shapes or scan patterns that produce different melt-pool boundary curvatures but the same measured $G$ and $V$, and measure cell spacing and segregation in the solidified track.
Extended reading notes
Core claim
At fixed thermal gradient and growth velocity, the geometry of the temperature isotherm alone changes the cellular solidification morphology in three dimensions. Using phase-field simulations of a Ni-Nb alloy in the additive-manufacturing regime, the paper shows that planar, noise-perturbed, sinusoidal, transverse, curved, and pulsed isotherms produce measurably different outcomes: the steepness of the solid-fraction profile differs by up to ~60% between patterns, average cell spacing by ~15%, microsegregation (the ratio $k_v = c_s^*/c_{\max}$) by ~14%, and the fraction of solute-rich droplets emitted from intercellular grooves by ~40%. Non-planar isotherms, especially sinusoidal and pulsed, produce finer cells and reduced microsegregation relative to the planar reference; the transverse isotherm produces the longest mushy zone and coarsest cells and tilts the cellular array. The paper concludes that isotherm shape, not only $G$ and $V$, belongs in the list of factors controlling melt-pool solidification microstructures.
Load-bearing premise
The load-bearing premise is that a melt pool's temperature field can be represented as a rigidly translating isotherm of a fixed shape with constant gradient and velocity, with no feedback from latent heat, convection, or the solidifying interface; if real isotherms are coupled to melt flow and the moving laser, the quantitative differences reported here would not transfer to the real process.
Editorial extensions
If this is right
- Isotherm patterns should be included as a microstructural control variable in additive manufacturing models, alongside the nominal gradient and velocity.
- Scan strategies that create sinusoidal or pulsed isotherms are expected to produce finer cells and less solute partitioning than planar-front approximations predict, consistent with experiments on sinusoidal hatching and pulsed beams.
- Local melt-pool boundary curvature can tilt cellular growth away from the nominal gradient direction, explaining some experimentally observed misorientations.
- Mushy-zone length and the position of the liquid-to-solid percolation transition shift with isotherm pattern, so defect-prone zones such as hot cracks and porosity may be manipulated by thermal pattern design.
- Different droplet fractions emitted from cell grooves imply different amounts of secondary phase formation during terminal solidification, depending on isotherm pattern.
Reading between the lines
- Beyond the paper: because $G$ and $V$ were held fixed, the reported differences isolate isotherm geometry as an independent control; a natural test is to correlate measured melt-pool boundary curvature with local cell spacing in a single material across different beam shapes.
- Beyond the paper: the Gaussian-noise case behaving like the clean planar case suggests random thermal fluctuations matter less than coherent isotherm distortion; thermal modeling may need to capture organized curvature rather than add stochastic noise.
- Beyond the paper: the larger change in mushy-zone steepness (~60%) than in cell spacing (~15%) implies isotherm shape acts more on the deep grooved region than on tip selection; this could be tested by measuring intercellular groove depth and microporosity in samples built with different scan strategies.
- Beyond the paper: coupling the frozen-temperature phase-field model to melt flow and latent heat would show whether the qualitative trends survive real isotherm deformation, a direction the paper itself identifies as future work.
Editorial analysis
A structured set of objections, weighed in public.
Referee Report
Summary. The manuscript reports three-dimensional phase-field simulations of directional cellular solidification in a Ni-Nb alloy under a frozen-temperature approximation, comparing six prescribed isotherm patterns (planar, Gaussian-noise, sinusoidal, transverse, curved, and pulsed) that all move at constant velocity V with the same nominal thermal gradient G. The central claim is that small variations in the isotherm shape, even at fixed G and V, measurably alter solidification outcomes: cell spacing, mushy-zone extent, solid-fraction steepness, microsegregation (kv), and solute-rich droplet fraction. The authors characterize these outcomes using solid-fraction profiles, Euler-characteristic percolation analysis, bridging-plane statistics, and line concentration profiles, and they report up to roughly 60% differences in steepness, 15% in cell spacing, 14% in microsegregation, and 40% in droplet fraction between patterns. The work is positioned as a first qualitative step toward incorporating melt-pool isotherm geometry into microstructure models.
Significance. If the reported differences are robust, the paper would provide a useful qualitative demonstration that isotherm geometry alone, decoupled from G and V, can shift cellular microstructural descriptors in a regime relevant to laser powder-bed fusion. The study has several genuine strengths: it uses a standard, previously validated quantitative phase-field model; it keeps all material, numerical, and cooling parameters fixed while varying only the isotherm pattern; it is genuinely three-dimensional; and it employs nontrivial morphological statistics (Euler characteristic, bridging plane, percolation of solid/liquid phases) rather than relying on visual inspection. The qualitative agreement with published experiments on sinusoidal and pulsed laser strategies is also encouraging. However, the central quantitative claims are currently supported by single simulations per pattern on a small lateral domain, and one of the two patterns most responsible for the headline 'finer cells, reduced microsegregation' conclusion is a transient, non-steady-state protocol whose control parameters are not fully reported.
major comments (4)
- [§3.1, Eq. (13); Fig. 4f; Appendix A] The pulsed-isotherm case is not a steady-state protocol, yet it carries much of the 'non-planar isotherms produce finer cells and reduced microsegregation' conclusion. Equation (13) alternates between a moving planar field and a uniform T0, and Fig. 4f shows two morphologically distinct zones (deep cells during laser-on, shallow cells during laser-off). The residence time tp is nowhere reported, so the duty cycle and number of pulses cannot be reconstructed from the manuscript. Appendix A concedes that pulsed-G runs 'may not reach a steady state' and that the results depend on residence time. The conclusions in Section 5 and the values in Figs. 7 and 12 therefore conflate geometry effects with pulse-history transients. The authors should either demonstrate a periodic steady state, provide a controlled sweep over tp and pulse count, or remove the pulsed case from the headline quantitative comparisons.
- [§3.2, Figs. 7 and 12] The quantitative claims of 15% differences in cell spacing and 14% differences in microsegregation are presented with 'confidence intervals' described as the standard deviation around the mean obtained by averaging the data, but each isotherm pattern is represented by a single simulation. There is no ensemble averaging over initial noise realizations, no spatial subsampling protocol, and no statistical test. Given the lateral domain of 1.024 µm contains only roughly 8-17 cells for the reported λc values, these differences may be within the natural spread of a single small-domain simulation. The authors should specify exactly how the mean and standard deviation were computed, how many independent cell-spacing or concentration samples contributed, and ideally provide multiple realizations (e.g., different random seeds for the initial noise) to demonstrate that the between-pattern differences exceed within-pattern variability.
- [Eq. (9) and Figs. 5-6, 11-12] The 'Gaussian noise' isotherm as written does not appear to create a spatially varying isotherm. In Eq. (9), δ is described as 'the random number' drawn from [-1,1], which, if it is a single scalar per timestep, only adds a global shift to the temperature field and leaves the isotherm planar. The authors report identical results for planar and noise cases across all metrics; if δ is spatially uniform, this identity is by construction and does not constitute a finding about noise robustness. The manuscript should define a genuine spatial noise field with an amplitude, correlation length, and random seed, and then show how the results depend on those parameters; alternatively, the noise case should be presented as a null check with the specification made explicit.
- [§2.1, Eqs. (9)-(13)] The isotherm amplitudes and frequencies are introduced as 'just reference values' with no calibration to the experimental or process conditions they purport to represent. In particular, An = 0.5, As = 0.5, Ac = 0.0005, and tp are not derived from thermal simulations or experimental data, and no parameter sweep is performed except for the tilt angle in the transverse case. The abstract's phrasing that 'small variations in the isotherm can considerably impact' the microstructure is therefore not quantitatively established: the calculations show that certain chosen finite-amplitude distortions change the outcome, but they do not show that variations small compared to realistic melt-pool disturbances cause those changes. At minimum, a sensitivity study over the isotherm amplitudes, or a calibration to published thermal-field data, is needed before the 'small variations' claim can be supported.
minor comments (5)
- [Eq. (13)] The pulsed case is defined with a formatting error ('t>t p') and the phrase 'before setting it off for a time tp' is ambiguous: it should be stated explicitly whether the laser-off interval has the same duration tp, and the total number of on/off cycles within the 80,000 Δt runtime should be reported.
- [Fig. 8 caption] Panel (d) is labeled 'Angular' in the figure caption but 'transverse' everywhere else in the text; this inconsistent terminology should be corrected.
- [Fig. 10 caption] There is a typo, 'An preliminary analysis' should read 'A preliminary analysis'.
- [§4, Discussion] The authors state that 'we could not make a quantitative comparison of our results with the literature'; given that the paper reports quantitative percentage differences in the conclusions, it would be helpful to state explicitly which aspects are intended to be qualitative and which are intended to be quantitative, so readers do not over-interpret the listed percentages.
- [Section 5, percolation statement] The conclusion states that solid percolation occurs for fs between 0.6 and 0.8, but the mechanism connecting the bridging plane of χ = 0 to this fs interval is not explained in the text; a sentence describing how the solid fraction at the bridging plane is obtained and why this range matters would improve clarity.
Circularity Check
No circularity: prescribed isotherm shapes are inputs, and cellular metrics are emergent outputs of the quantitative phase-field model.
full rationale
The derivation chain is not circular. The isotherm patterns (Eqs. 8-13) are prescribed kinematic inputs with fixed reference amplitudes (An=0.5, As=0.5, φ=15°, Ac=0.0005); none of these constants is fitted to the reported outputs (λc, dfs/dz, kv, droplet fraction). The cellular morphologies, spacings, solid-fraction curves, Euler-characteristic percolation statistics, and concentration profiles are computed by time-integrating the established Echebarria-Karma-Plapp quantitative phase-field equations (Eqs. 1 and 16) with material parameters from external sources (Knorovsky et al.; Nie et al.). Differences between isotherm patterns are therefore emergent, not imposed by construction. Prior self-citations [24-26,35,36] are invoked only for code validation and AM applications; the load-bearing model and parameters originate outside this paper. The pulsed case (Eq. 13) is the least robust item, but the concern is scientific validity and reproducibility (unreported residence time tp; Appendix A concedes the growth front may not reach steady state), not circularity. Similarly, the frozen-temperature approximation and neglected convection are acknowledged modeling assumptions that limit transferability but do not make the predictions reducible to the inputs. No fitted quantity is renamed as a prediction, and no self-citation chain is used to force the central conclusion.
Assumptions & free parameters
free parameters (6)
- Gaussian noise amplitude An =
0.5 (dimensionless)
- Sinusoidal amplitude As =
0.5 (dimensionless)
- Sinusoidal frequency f =
not stated explicitly
- Transverse tilt angle phi =
15 degrees for main 3D simulation
- Curvature strength Ac =
0.0005
- Pulse residence time tp =
implied by 80,000 time steps with alternating on/off periods
assumptions (6)
- domain assumption Frozen temperature approximation: temperature field is prescribed and unaffected by latent heat release
- domain assumption No melt convection; solute transport purely diffusive
- domain assumption Constant thermophysical properties and zero solid-state diffusivity
- domain assumption Local equilibrium at the interface with zero kinetic effects via the thin-interface model of Echebarria et al.
- domain assumption The directional solidification setup with constant G and V faithfully represents melt pool solidification conditions
- ad hoc to paper The isotherm pattern shapes are representative of actual melt pool disturbances
invented entities (1)
-
Model isotherm patterns (noise, sinusoidal, transverse, curved, pulsed)
Cite this review
Pith. "Pith review of Effects of isotherm patterns on cellular interface morphologies of melt pool origin." pith.science (2026). https://pith.science/paper/QRJ522VZ
@misc{pith2026241118638,
  author       = {Pith},
  title        = {Pith review of: Effects of isotherm patterns on cellular interface morphologies of melt pool origin},
  year         = {2026},
  howpublished = {\url{https://pith.science/paper/QRJ522VZ}},
  note         = {Machine review of arXiv:2411.18638}
}
read the original abstract
Spatiotemporal variation of the thermal gradient in the melt pool inherited from different heat input patterns or other non-equilibrium transient effects during additive manufacturing can significantly affect the resulting subgrain microstructure evolution. To examine the impact of this variation, we approximate the thermal gradient by various isotherm patterns that move with constant velocity following directional solidification. We report the first three-dimensional phase-field simulations to investigate the effects of isotherm patterns on the cellular structures typically observed in solidified melt pools. Results indicate that small variations in the isotherm can considerably impact the microstructural features. We use appropriate statistical characterizations of the solid fraction, solid percolation, and solute partitioning behavior to demonstrate the influence of isotherm patterns on the dendritic structures and semisolid mushy zones. Consistent with experimental observations, we find that non-planar isotherms produce finer cells and reduced microsegregation compared to planar isotherms. Also, we note that a tilt of the isotherm leads to a tilted state of the resulting cellular arrays. Our findings will help in understanding the qualitative aspects of the influence of temperature gradient patterns on the evolution of solidification morphologies, mushy zones, and secondary phases, which are crucial for the macroscopic description of the solidified material.
Figures


Figures from the paper (11 more)




Reference graph
Works this paper leans on
- [1]
-
[2]
Z. Liu, D. Zhao, P. Wang, M. Yan, C. Yang, Z. Chen, J. Lu, Z. Lu, Additive manufacturing of metals: Microstructure evolution and multistage control, Journal of Materials Science & Technology 100 (2022) 224–236
work page 2022
-
[3]
N. Haghdadi, M. Laleh, M. Moyle, S. Primig, Additive manufacturing of steels: a review of achievements and challenges, Journal of Materials Science 56 (2021) 64–107
work page 2021
-
[4]
J. Wang, R. Zhu, Y. Liu, L. Zhang, Understanding melt pool characteristics in laser powder bed fusion: An overview of single-and multi-track melt pools for process optimization, Advanced Powder Materials 2 (4) (2023) 100137
work page 2023
-
[5]
S. Sanchez, P. Smith, Z. Xu, G. Gaspard, C. J. Hyde, W. W. Wits, I. A. Ashcroft, H. Chen, A. T. Clare, Powder bed fusion of nickel-based superalloys: A review, International Journal of Machine Tools and Manufacture 165 (2021) 103729
work page 2021
-
[6]
T. Keller, G. Lindwall, S. Ghosh, L. Ma, B. Lane, F. Zhang, U. R. Kattner, E. A. Lass, J. C. Heigel, Y. Idell, M. E. Williams, A. J. Allen, J. E. Guyer, L. E. Levine, Application of Finite Element, Phase- field, and CALPHAD-based Methods to Additive Manufacturing of Ni-based Superalloys, Acta Materi- alia 139 (2017) 244–253
work page 2017
-
[7]
K. Karayagiz, L. Johnson, R. Seede, V. Attari, B. Zhang, X. Huang, S. Ghosh, T. Duong, I. Karaman, A.Elwany, etal., FiniteinterfacedissipationphasefieldmodelingofNi-Nbunderadditivemanufacturing conditions, Acta Materialia 185 (2020) 320–339
work page 2020
-
[8]
G. Boussinot, M. Apel, J. Zielinski, U. Hecht, J. Schleifenbaum, Strongly out-of-equilibrium columnar solidification during laser powder-bed fusion in additive manufacturing, Physical Review Applied 11 (1) (2019) 014025
work page 2019
Show all 79 references
-
[9]
Acharya, J
R. Acharya, J. A. Sharon, A. Staroselsky, Prediction of microstructure in laser powder bed fusion process, Acta Materialia 124 (2017) 360–371
2017
-
[10]
W. W. Mullins, R. F. Sekerka, Stability of a planar interface during solidification of a dilute binary alloy, Journal of Applied Physics 35 (2) (1964) 444–451. 27
1964
-
[11]
Rappaz, J
M. Rappaz, J. A. Dantzig, Solidification, EFPL Press, Lausanne, 2009
2009
-
[12]
S. Li, H. Xiao, K. Liu, W. Xiao, Y. Li, X. Han, J. Mazumder, L. Song, Melt-pool motion, temperature variation and dendritic morphology of inconel 718 during pulsed-and continuous-wave laser additive manufacturing: A comparative study, Materials & design 119 (2017) 351–360
2017
-
[13]
S.-H. Sun, K. Hagihara, T. Nakano, Effect of scanning strategy on texture formation in Ni-25 at.% Mo alloys fabricated by selective laser melting, Materials & Design 140 (2018) 307–316
2018
-
[14]
L. Yao, Z. Xiao, A. Ramesh, Y. Zhang, On the melt pool flow and interface shape of dissimilar alloys via selective laser melting, International Communications in Heat and Mass Transfer 145 (2023) 106833
2023
-
[15]
Perrut, A
M. Perrut, A. Parisi, S. Akamatsu, S. Bottin-Rousseau, G. Faivre, M. Plapp, Role of transverse tem- perature gradients in the generation of lamellar eutectic solidification patterns, Acta Materialia 58 (5) (2010) 1761–1769
2010
-
[16]
Dinda, A
G. Dinda, A. Dasgupta, S. Bhattacharya, H. Natu, B. Dutta, J. Mazumder, Microstructural charac- terization of laser-deposited al 4047 alloy, Metallurgical and Materials Transactions A 44 (5) (2013) 2233–2242
2013
-
[17]
H. Wei, J. Mazumder, T. DebRoy, Evolution of solidification texture during additive manufacturing, Scientific reports 5 (1) (2015) 1–7
2015
-
[18]
R. Shi, S. A. Khairallah, T. T. Roehling, T. W. Heo, J. T. McKeown, M. J. Matthews, Microstructural control in metal laser powder bed fusion additive manufacturing using laser beam shaping strategy, Acta Materialia 184 (2020) 284–305
2020
-
[19]
T. T. Roehling, R. Shi, S. A. Khairallah, J. D. Roehling, G. M. Guss, J. T. McKeown, M. J. Matthews, Controlling grain nucleation and morphology by laser beam shaping in metal additive manufacturing, Materials & Design 195 (2020) 109071
2020
-
[20]
Ebrahimi, M
A. Ebrahimi, M. Sattari, A. Babu, A. Sood, G.-W. R. Römer, M. J. Hermans, Revealing the effects of laser beam shaping on melt pool behaviour in conduction-mode laser melting, Journal of Materials Research and Technology 27 (2023) 3955–3967
2023
-
[21]
Y. Chen, D. Zhang, P. O’Toole, D. Qiu, M. Seibold, K. Schricker, J.-P. Bergmann, A. Rack, M. Eas- ton, In situ observation and reduction of hot-cracks in laser additive manufacturing, Communications Materials 5 (1) (2024) 84
2024
-
[22]
Mussatto, R
A. Mussatto, R. Groarke, R. K. Vijayaraghavan, M. A. Obeidi, P. J. McNally, V. Nicolosi, Y. Delaure, D. Brabazon, Laser-powder bed fusion of silicon carbide reinforced 316l stainless steel using a sinusoidal laser scanning strategy, Journal of Materials Research and Technology...
2022
-
[23]
Y. Cai, Z. Peng, J. Chen, H. Chen, J. Xiong, Grain refinement and anisotropy improvement of arc- directed energy deposited Ti-6Al-4V with oscillating laser, Materials Science and Engineering: A 893 (2024) 146144
2024
-
[24]
Ghosh, L
S. Ghosh, L. Ma, N. Ofori-Opoku, J. E. Guyer, On the primary spacing and microsegregation of cellular dendrites in laser deposited Ni-Nb alloys, Model. Simul. Mater. Sci. Eng. 25 (6) (2017) 065002
2017
-
[25]
Ghosh, C
S. Ghosh, C. K. Newman, M. M. Francois, Tusas: A fully implicit parallel approach for coupled phase- field equations, Journal of Computational Physics 448 (2022) 110734
2022
-
[26]
Ghosh, L
S. Ghosh, L. Ma, L. E. Levine, R. E. Ricker, M. R. Stoudt, J. C. Heigel, J. E. Guyer, Single-track melt-pool measurements and microstructures in Inconel 625, JOM 70 (6) (2018) 1011–1016
2018
-
[27]
Ghosh, M
S. Ghosh, M. Mahmoudi, L. Johnson, A. Elwany, R. Arroyave, D. Allaire, Uncertainty analysis of microsegregation during laser powder bed fusion, Model. Simul. Mater. Sci. Eng. 27 (3) (2019) 034002
2019
-
[28]
Ghosh, R
S. Ghosh, R. Seede, J. James, I. Karaman, A. Elwany, D. Allaire, R. Arroyave, Statistical modelling of microsegregation in laser powder-bed fusion, Philosophical Magazine Letters 100 (6) (2020) 271–282
2020
-
[29]
S. B. Kang, G. Huang, G. Singhal, D. Xie, D. H. Hsieh, Y. Lee, A. A. Kulkarni, J. W. Smith, Q. Chen, K. Thornton, et al., Highly ordered eutectic mesostructures via template-directed solidification within thermally engineered templates, Advanced Materials 36 (15) (2024) 2308720
2024
-
[30]
Zhang, Z
A. Zhang, Z. Guo, B. Jiang, J. Song, F. Pan, S. Xiong, Effect of laser shock on lamellar eutectic growth: A phase-field study, International Journal of Heat and Mass Transfer 183 (2022) 122069
2022
-
[31]
W. J. Boettinger, J. A. Warren, C. Beckermann, A. Karma, Phase-field simulation of solidification, Annu. Rev. Mater. Res. 32 (2002) 163–194
2002
-
[32]
Steinbach, Phase-field models in materials science, Model
I. Steinbach, Phase-field models in materials science, Model. Simul. Mater. Sci. Eng. 17 (2009) 073001
2009
-
[33]
L.-Q. Chen, N. Moelans, Phase-field method of materials microstructures and properties, MRS Bulletin 49 (2024) 551–555
2024
-
[34]
Echebarria, R
B. Echebarria, R. Folch, A. Karma, M. Plapp, Quantitative phase-field model of alloy solidification, Physical Review E 70 (6) (2004) 061604
2004
-
[35]
Ghosh, K
S. Ghosh, K. McReynolds, J. E. Guyer, D. Banerjee, Simulation of temperature, stress and microstruc- ture fields during laser deposition of Ti-6Al-4V, Model. Simul. Mater. Sci. Eng. 26 (7) (2018) 075005
2018
-
[36]
Ghosh, N
S. Ghosh, N. Ofori-Opoku, J. E. Guyer, Simulation and analysis ofγ-Ni cellular growth during laser powder deposition of Ni-based superalloys, Computational Materials Science 144 (2018) 256–264. 29
2018
-
[37]
Chouhan, L
A. Chouhan, L. Mädler, N. Ellendt, Modeling of rapid solidification in laser powder bed fusion processes, Computational Materials Science 238 (2024) 112918
2024
-
[38]
Sahoo, K
S. Sahoo, K. Chou, Phase-field simulation of microstructure evolution of Ti-6Al-4V in electron beam additive manufacturing process, Additive manufacturing 9 (2016) 14–24
2016
-
[39]
Farzadi, M
A. Farzadi, M. Do-Quang, S. Serajzadeh, A. Kokabi, G. Amberg, Phase-field simulation of weld solidi- fication microstructure in an Al-Cu alloy, Model. Simul. Mater. Sci. Eng. 16 (6) (2008) 065005
2008
-
[40]
X. Wang, P. Liu, Y. Ji, Y. Liu, M. Horstemeyer, L. Chen, Investigation on microsegregation of IN718 alloy during additive manufacturing via integrated phase-field and finite-element modeling, Journal of Materials Engineering and Performance 28 (2019) 657–665
2019
-
[41]
Karma, Phase-field formulation for quantitative modeling of alloy solidification, Physical Review Letters 87 (11) (2001) 115701
A. Karma, Phase-field formulation for quantitative modeling of alloy solidification, Physical Review Letters 87 (11) (2001) 115701
2001
-
[42]
Knorovsky, M
G. Knorovsky, M. Cieslak, T. Headley, A. Romig, W. Hammetter, Inconel 718: a solidification diagram, Metallurgical transactions A 20 (10) (1989) 2149–2158
1989
-
[43]
Provatas, K
N. Provatas, K. Elder, Phase-field methods in materials science and engineering, John Wiley & Sons, 2011
2011
-
[44]
Ghosh, J
S. Ghosh, J. Zollinger, M. Zaloznik, D. Banerjee, C. K. Newman, R. Arroyave, Modeling of hierarchical solidification microstructures in metal additive manufacturing: Challenges and opportunities, Additive Manufacturing 78 (2023) 103845
2023
-
[45]
P. Nie, O. Ojo, Z. Li, Numerical modeling of microstructure evolution during laser additive manufac- turing of a nickel-based superalloy, Acta Materialia 77 (2014) 85–95
2014
-
[46]
Massalski, H
T. Massalski, H. Okamoto, P. Subramanian, L. Kacprzak, Binary Alloy Phase Diagrams, ASM Inter- national, Materials Park, Ohio, 1990
1990
-
[47]
W. M. Tucho, P. Cuvillier, A. Sjolyst-Kverneland, V. Hansen, Microstructure and hardness studies of Inconel 718 manufactured by selective laser melting before and after solution heat treatment, Materials Science and Engineering: A 689 (2017) 220–232
2017
-
[48]
Y.-L. Kuo, S. Horikawa, K. Kakehi, The effect of interdendriticδ phase on the mechanical properties of alloy 718 built up by additive manufacturing, Materials & Design 116 (2017) 411–418
2017
-
[49]
Kouraytem, J
N. Kouraytem, J. Varga, B. Amin-Ahmadi, H. Mirmohammad, R. A. Chanut, A. D. Spear, O. T. King- stedt, A recrystallization heat-treatment to reduce deformation anisotropy of additively manufactured Inconel 718, Materials & Design 198 (2021) 109228. 30
2021
-
[50]
Z. Sun, Y. Ma, D. Ponge, S. Zaefferer, E. A. Jägle, B. Gault, A. D. Rollett, D. Raabe, Thermodynamics- guided alloy and process design for additive manufacturing, Nature Communications 13 (1) (2022) 1–12
2022
-
[51]
Hoshen, R
J. Hoshen, R. Kopelman, Percolation and cluster distribution. I. cluster multiple labeling technique and critical concentration algorithm, Physical Review B 14 (8) (1976) 3438
1976
-
[52]
Stauffer, A
D. Stauffer, A. Aharony, Introduction to percolation theory, Taylor & Francis, London, UK, 2018
2018
-
[53]
S. N. Tewari, Y.-H. Weng, G. Ding, R. Trivedi, Cellular array morphology during directional solidifica- tion, Metallurgical and Materials Transactions A 33 (2002) 1229–1243
2002
-
[54]
Kou, A criterion for cracking during solidification, Acta Materialia 88 (2015) 366–374
S. Kou, A criterion for cracking during solidification, Acta Materialia 88 (2015) 366–374
2015
-
[55]
Tourret, A
D. Tourret, A. Karma, Growth competition of columnar dendritic grains: A phase-field study, Acta Materialia 82 (2015) 64–83
2015
-
[56]
H. Xing, X. Dong, C. Chen, J. Wang, L. Du, K. Jin, Phase-field simulation of tilted growth of dendritic arrays during directional solidification, International Journal of Heat and Mass Transfer 90 (2015) 911– 921
2015
-
[57]
M. J. Aziz, Model for solute redistribution during rapid solidification, Journal of Applied Physics 53 (2) (1982) 1158–1168
1982
-
[58]
Ghosh, M
S. Ghosh, M. R. Stoudt, L. E. Levine, J. E. Guyer, Formation of Nb-rich droplets in laser deposited Ni-matrix microstructures, Scripta Materialia 146 (2018) 36–40
2018
-
[59]
Rännar, A
L.-E. Rännar, A. Koptyug, J. Olsén, K. Saeidi, Z. Shen, Hierarchical structures of stainless steel 316L manufactured by electron beam melting, Additive Manufacturing 17 (2017) 106–112
2017
-
[60]
H. Yoon, P. Liu, Y. Park, G. Choi, P.-P. Choi, H. Sohn, Pulsed laser-assisted additive manufacturing of Ti-6Al-4V for in-situ grain refinement, Scientific Reports 12 (1) (2022) 22247
2022
-
[61]
C. Yang, F. Yang, X. Meng, S. N. Putra, M. Bachmann, M. Rethmeier, Phase-field simulation of the dendrite growth in aluminum alloy AA5754 during alternating current electromagnetic stirring laser beam welding, International Journal of Heat and Mass Transfer 218 (2024) 124754
2024
-
[62]
Durga, N
A. Durga, N. H. Pettersson, S. B. A. Malladi, Z. Chen, S. Guo, L. Nyborg, G. Lindwall, Grain refinement in additively manufactured ferritic stainless steel by in situ inoculation using pre-alloyed powder, Scripta Materialia 194 (2021) 113690
2021
-
[63]
Cazic, J
I. Cazic, J. Zollinger, S. Mathieu, M. El Kandaoui, P. Plapper, B. Appolaire, New insights into the origin of fine equiaxed microstructures in additively manufactured inconel 718, Scripta Materialia 195 (2021) 113740. 31
2021
-
[64]
V. P. N. Samy, M. Schäfle, F. Brasche, U. Krupp, C. Haase, Understanding the mechanism of columnar– to-equiaxed transition and grain refinement in additively manufactured steel during laser powder bed fusion, Additive Manufacturing 73 (2023) 103702
2023
-
[65]
S. A. Nabavizadeh, M. Eshraghi, S. D. Felicelli, Three-dimensional phase field modeling of columnar to equiaxed transition in directional solidification of Inconel 718 alloy, Journal of Crystal Growth 549 (2020) 125879
2020
-
[66]
L. Yuan, P. D. Lee, Dendritic solidification under natural and forced convection in binary alloys: 2D versus 3D simulation, Modelling Simul. Mater. Sci. Eng. 18 (5) (2010) 055008
2010
-
[67]
Yang, K.-M
W. Yang, K.-M. Chang, W. Chen, S. Mannan, J. DeBarbadillo, Freckle criteria for the upward direc- tional solidification of alloys, Metallurgical and Materials Transactions A 32 (2001) 397–406
2001
-
[68]
Y. Yu, L. Wang, J. Zhou, H. Li, Y. Li, W. Yan, F. Lin, Impact of fluid flow on the dendrite growth and the formation of new grains in additive manufacturing, Additive Manufacturing 55 (2022) 102832
2022
-
[69]
C. Tang, H. Du, Phase field modelling of dendritic solidification under additive manufacturing condi- tions, JOM 74 (8) (2022) 2996–3009
2022
-
[70]
Xiong, Z
F. Xiong, Z. Gan, J. Chen, Y. Lian, Evaluate the effect of melt pool convection on grain structure of IN625 in laser melting process using experimentally validated process-structure modeling, Journal of Materials Processing Technology 303 (2022) 117538
2022
-
[71]
A. Rai, M. Markl, C. Körner, A coupled cellular automaton–lattice boltzmann model for grain structure simulation during additive manufacturing, Computational Materials Science 124 (2016) 37–48
2016
-
[72]
J. Wu, D. Sun, W. Chen, Z. Chai, A unified lattice Boltzmann-phase field scheme for simulations of solutal dendrite growth in the presence of melt convection, International Journal of Heat and Mass Transfer 220 (2024) 124958
2024
-
[73]
H. Xing, H. Jing, X. Dong, L. Wang, Y. Han, R. Hu, Cellular growth during rapid directional solidifi- cation: Insights from quantitative phase field simulations, Materials Today Communications 30 (2022) 103170
2022
-
[74]
C. Li, J. Wen, L. Wang, G. Lei, Q. Chen, Modeling of solid-air multi-dendrite growth evolution driven by coupled thermal-solute using non-isothermal quantitative phase field method, International Commu- nications in Heat and Mass Transfer 145 (2023) 106841
2023
-
[75]
Mullis, J
A. Mullis, J. Rosam, P. Jimack, Solute trapping and the effects of anti-trapping currents on phase-field models of coupled thermo-solutal solidification, Journal of Crystal Growth 312 (11) (2010) 1891–1897. 32
2010
-
[76]
Radhakrishnan, S
B. Radhakrishnan, S. B. Gorti, J. A. Turner, R. Acharya, J. A. Sharon, A. Staroselsky, T. El-Wardany, Phase field simulations of microstructure evolution in IN718 using a surrogate Ni-Fe-Nb alloy during laser powder bed fusion, Metals 9 (1) (2018) 14
2018
-
[77]
Nestler, A
B. Nestler, A. Choudhury, Phase-field modeling of multi-component systems, Current opinion in solid state and Materials Science 15 (3) (2011) 93–105
2011
-
[78]
Plotkowski, M
A. Plotkowski, M. M. Kirka, S. Babu, Verification and validation of a rapid heat transfer calculation methodology for transient melt pool solidification conditions in powder bed metal additive manufactur- ing, Additive Manufacturing 18 (2017) 256–268
2017
-
[79]
R. Moat, A. Pinkerton, L. Li, P. Withers, M. Preuss, Crystallographic texture and microstructure of pulsed diode laser-deposited Waspaloy, Acta Materialia 57 (4) (2009) 1220–1229. 33
2009
Reviewed August 12, 2026 · model on record in the stance chip above.
Discussion (0). Continue with ORCID to comment.