REVIEW 4 major objections 4 minor 16 references
Traits and tangles: An analysis of the Big Five paradigm by tangle-based clustering
T0 review · 4 major / 4 minor · reviewed 2026-08-12 · deepseek-v4-flash
Pith's one-line read The paper claims that the five OCEAN personality traits are real clusters in the answer data, but they emerge at different resolutions; the same data also contain a hierarchy of ten further traits.
desk verdict First genuine tangle-clustering application to Big Five data; the resolution-dependent trait hierarchy is novel and plausible, but the unverified S-construction makes the central claim conditional. read the letter →
The pith
A machine-rendered reading of the paper's core claim, the machinery that carries it, and where it could break.
The reading
What carries the argument
The central object is the tangle trait: an equivalence class of tangles, where a tangle is an orientation of all partitions of the 50-question set $Q$ whose order is below some threshold, such that any three oriented sides have at least $a=2$ questions in common. The order of a partition is its ratio cut weight, computed from mutual-information (or cosine) similarity between questions, and the set $\mathcal{S}$ of partitions is built from eigenvectors of a similarity Laplacian (or of the principal-component matrix $J$), corner closures of those partitions, and iterative local-minimum moves. The complexity of a trait is the lowest order at which one of its tangles is distinguished, its cohesion the highest order to which it persists, and its visibility is cohesion minus complexity plus one; the tree of traits displays refinement relations between traits, with each branching point labelled by the efficient distinguisher, the lowest-order partition that the two child traits orient differently. This machinery converts the paper's informal criteria of extensional cohesion and completeness into quantitative, computable properties of the data.
What would settle it
Compute the same trait tree on a large independent Big Five dataset, such as NEO PI-R responses, and check whether the five OCEAN groups again appear as tangle traits at different orders and whether A and E share a common generalisation while O splits into two subtraits; a different hierarchy would show the structure is dataset-specific. Even more directly, augment the constructed set $\mathcal{S}$ with a large random sample of low-order partitions from the full $2^{50}$ lattice and rerun the tangle search: if the emerging tree of traits changes materially, the approximation of the full partition lattice is not adequate.
Extended reading notes
Core claim
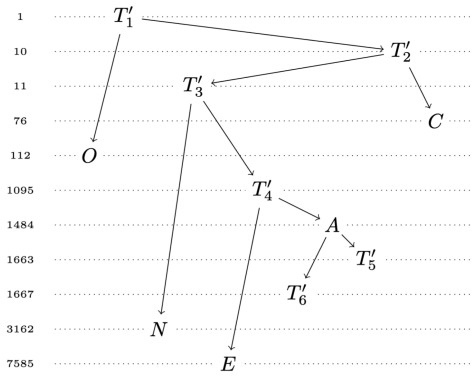
On the paper's own terms, the central discovery is that the five OCEAN question groups are each the guide of a tangle trait, an equivalence class of tangles whose complexity and cohesion differ from trait to trait. No single order $k$ exists at which all five OCEAN traits are simultaneously present: trait C and N, for instance, persist to high orders while A and E are born only when C and O have already disappeared. In the larger dataset the fifteen tangle traits form a tree in which A and E have a common generalisation T8, C and N share a parent T3, and O splits into two subtraits that themselves divide further; in the smaller dataset eleven traits appear with a different but related structure. The same five OCEAN traits are recovered in both datasets and in all ten random participant subsets of the large study, so the authors take the five-factor structure to be data-level real, and the additional traits to be further, previously unlooked-for structure in the same data.
Load-bearing premise
The load-bearing premise is that the specially constructed set of partitions $\mathcal{S}$ is large and varied enough that the tangles and traits found in it approximate the tangles of the full set of all $2^{50}$ partitions of the questions; if that fails, the reported tree of traits is an artefact of how $\mathcal{S}$ was built rather than a property of the data.
Editorial extensions
If this is right
- The five OCEAN question groups are each validated as measures of a single tangle-defined trait, but because no single resolution shows all five simultaneously, test validation and interpretation need to be resolution-aware.
- The 50-question IPIP data contain at least ten additional, previously unrecognised traits that generalise or refine the Big Five, so more detailed personality profiles can be extracted from existing inventories without new questionnaires.
- The trait hierarchy is robust under random splitting of the million-person sample, so the discovered structure is unlikely to be an artefact of one particular participant group.
- Each tangle trait is described by a few explicit partitions and by the three questions that best represent it, allowing psychologists to interpret the structural findings without using the underlying mathematics.
- Replacing the similarity matrix L by J does not change the trait tree, and switching from mutual information to cosine similarity yields largely stable results, indicating the main structure is robust to the paper's parameter choices.
Reading between the lines
- If this result generalises, personality theory may need to treat the Big Five as a coarse-resolution summary rather than a fundamental list: at finer resolutions the same data support more traits and a clear refinement hierarchy.
- The same tangle pipeline could be applied to other psychological questionnaires (symptom checklists, values, or attitude surveys) to test whether their nominal categories are extensionally verifiable and to discover unlabelled dimensions hidden in the answers.
- The difference between the two studies' trait trees suggests participant pool and administration affect the hierarchy; combining several datasets or testing cross-culturally would show which branches of the tree are universal.
- Because the proof of the $\mathcal{S}$-approximation is imported from the tangle theory literature rather than demonstrated on this data, a practical next step is a randomised-partition sensitivity test, turning the paper's key assumption into a directly checkable computation.
Editorial analysis
A structured set of objections, weighed in public.
Referee Report
Summary. The paper applies tangle theory to two large public datasets of responses to a 50-item IPIP Big Five questionnaire. It formalizes 'traits' as equivalence classes of tangles of partitions of the question set, with complexity, cohesion, and visibility parameters. Using a heuristic set S of partitions (eigenvectors of a Laplacian or matrix J, corner closures, and local-minimum moves), the authors find that the five OCEAN question groups each correspond to a tangle trait, but at different orders, and that additional traits appear in a hierarchy. They report robustness across disjoint subsets of participants and stability under changes of similarity function and of the matrix L versus J. The central conclusion is that the OCEAN traits are extensionally verifiable as tangle traits, albeit at different resolutions, and that further structure exists beyond the five traits.
Significance. If the technical concerns are resolved, the paper is a significant methodological contribution: it introduces tangle-based clustering to psychological assessment, offers a hierarchical rather than flat validation of the Big Five, and makes all trait-defining distinguishers explicit, enabling direct expert interpretation and independent replication. The software is publicly available, the data are external, and the reported trait hierarchy is a falsifiable structural prediction about response data. However, the current manuscript does not yet establish that the heuristic partition set faithfully represents the full partition lattice, which underpins the claim that the reported traits are properties of the data rather than of the heuristic.
major comments (4)
- [Section 4.4 and Section 5.6] The central approximation is asserted, not proved. The set S is built from eigenvectors of L or J, corner closures, and local-minimum moves, and the paper states (p. 18) that 'Partitions whose orders are local minima ... include our target partitions, the efficient distinguishers of tangles of agreement value at least 2 of all the partitions of Q', citing [9]. No proof or empirical verification is given that S actually contains these distinguishers. Since the tangle axioms are only checked on S, a missing low-order partition could invalidate candidate traits or introduce spurious ones. This is load-bearing: the trait trees in Figures 4-8 may be artifacts of the S-construction. Please provide a proof of the quoted assertion or a quantitative empirical check, such as comparing tangles of S with tangles of a substantially larger random S, or verifying directly that the reported efficient distinguishers are local minima in the full partition space for the given order function.
- [Section 5.5] The agreement threshold a=2 is fixed throughout. The quoted assertion in Section 4.3 refers specifically to agreement value at least 2, so the approximation of the full partition lattice is tied to this choice. Section 5.6 varies the similarity function and the matrix L/J but never varies a. If a=1 or a=3 changes the set of tangles or the trait hierarchy, the conclusion that the OCEAN traits appear at different orders is not robust. Please report results for at least one other agreement value and discuss how the choice of a is grounded.
- [Section 2.3, Definition 15, and Section 6] The robustness analysis reruns the same S-construction family on subsets of participants, so it cannot detect bias introduced by the S heuristic itself. The claims that trees are 'very similar' or 'identical' are qualitative and unquantified; no numerical measure of tree similarity is given. More importantly, there is no null model: no comparison against randomly permuted answers, shuffled question labels, or synthetic data with no trait structure. Such a baseline is needed to establish that the observed tangle traits and their hierarchy are not artefacts of the correlation structure of any 50-item questionnaire. Please add a permutation or null-model analysis and quantify the stability of trait trees (e.g., by an edit distance between trees).
- [Section 4.1] There is a circularity risk in the interpretation. Tangle traits are defined as equivalence classes of tangles whose cohesion and completeness are built into the tangle axioms; the paper then 'confirms' that the OCEAN question groups form such traits. This is a consistency check between a formal definition and a set of labels, not an independent empirical validation of the traits, because the formal criteria were designed to match the intuitive notion of a trait. The conclusion should be framed more cautiously: the OCEAN groups satisfy a formal criterion, but the criterion itself is not externally justified. A concrete test would be to run the same analysis on a questionnaire with shuffled question-to-trait assignments, or on random subsets of questions, and show that the OCEAN structure does not emerge by chance.
minor comments (4)
- [Section 5.2] The normalisation procedure is described iteratively but the convergence criterion is not stated precisely; please specify a tolerance or a maximum number of iterations.
- [Section 7.3] Figures 4 and 5 are said to be not drawn to scale, which makes the visual comparison of visibilities misleading. Please add a table with the numerical complexity, cohesion, and visibility values for all traits.
- [Throughout] The distinguisher tables in the appendix are difficult to parse as printed; a compact notation such as 's(T8) = {E1,...,E10,N1,...,N10,A1,A2,A3,A4,A5,A6,A7,A8,A9,A10,C1...C10,O1...O10} | {A2,A7,A10}' would improve readability.
- [Section 5.5] There are minor typos and stylistic issues, for example 'the the OCEAN traits' in Section 5.2, and the phrase 'we found in [2]' in Section 5.2 should be 'we found for the dataset of [2]'. A careful proofread is recommended.
Circularity Check
No significant circularity: the tangle traits are computed from external answer data without using OCEAN question labels, and the OCEAN alignment is empirically data-dependent.
full rationale
The paper's derivation is not circular. It intentionally formalizes a trait as an equivalence class of tangles (Definition 15), and it explicitly says that extensional cohesion and completeness are built into the tangle notion (Section 6), but the substantive empirical claim is that the externally given OCEAN subsets of questions guide low-order tangles and form a robust hierarchy. That claim is data-dependent: the algorithm discards the trait labels, computes similarities only from participants' answers (Sections 4.1-4.2), and the number of traits found (eleven in the smaller study, fifteen in the larger) was not fixed in advance. The OCEAN labels are attached afterwards by a guidance rule (Section 5.1), and this rule can fail: under cosine similarity, no trait in the smaller study could be named A (Section 5.6). The construction of the partition set S in Section 4.3 is an approximation choice, and the assertion that local-minimum partitions include the efficient distinguishers of full-lattice tangles is cited to the authors' own tangle book [9]; even if this assumption were unproved or heuristic, it is not an identity between input and output, and it is checked indirectly by the reported stability under different similarity functions, matrices, and disjoint participant subsets (Sections 5.5-5.6). No fitted parameter is relabeled as a prediction, no uniqueness theorem is imported to forbid alternatives, and the mathematical background taken from [7] and [9] concerns tangle theory generally rather than the OCEAN-specific conclusions. The paper therefore contains no exhibited reduction of its central results to their own inputs.
Assumptions & free parameters
free parameters (4)
- Agreement value a =
2
- Number of seed eigenvectors from L or J =
at most 50, typically fewer (unspecified)
- Normalization scheme =
per-person mean 0 and sd 1; per-question median 0
- Choice of similarity function =
mutual information (entropy), with cosine as a check
assumptions (5)
- domain assumption There is a consensus that a trait should satisfy extensional cohesion and extensional completeness.
- ad hoc to paper Tangle equivalence classes formalise the notion of a personality trait.
- domain assumption The constructed set S of partitions approximates the tangles of all partitions of Q.
- domain assumption Mutual information and cosine similarity, after normalization, capture relevant similarity between personality questions.
- domain assumption The data from openpsychometrics [2,3] are reliable and representative.
invented entities (2)
-
Non-OCEAN tangle traits (e.g., T2 through T10 in the larger study)
-
Visibility parameter of a trait
Cite this review
Pith. "Pith review of Traits and tangles: An analysis of the Big Five paradigm by tangle-based clustering." pith.science (2026). https://pith.science/paper/GK5Q532O
@misc{pith2026241118670,
  author       = {Pith},
  title        = {Pith review of: Traits and tangles: An analysis of the Big Five paradigm by tangle-based clustering},
  year         = {2026},
  howpublished = {\url{https://pith.science/paper/GK5Q532O}},
  note         = {Machine review of arXiv:2411.18670}
}
read the original abstract
Using the recently developed mathematical theory of tangles, we re-assess the mathematical foundations for applications of the five factor model in personality tests by a new, mathematically rigorous, quantitative method. Our findings broadly confirm the validity of current tests, but also show that more detailed information can be extracted from existing data. We found that the big five traits appear at different levels of scrutiny. Some already emerge at a coarse resolution of our tools at which others cannot yet be discerned, while at a resolution where these _can_ be discerned, and distinguished, some of the former traits are no longer visible but have split into more refined traits or disintegrated altogether. We also identified traits other than the five targeted in those tests. These include more general traits combining two or more of the big five, as well as more specific traits refining some of them. All our analysis is structural and quantitative, and thus rigorous in explicitly defined mathematical terms. Since tangles, once computed, can be described concisely in terms of very few explicit statements referring only to the test questions used, our findings are also directly open to interpretation by experts in psychology. Tangle analysis can be applied similarly to other topics in psychology. Our paper is intended to serve as a first indication of what may be possible.
Figures


Figures from the paper (6 more)




Reference graph
Works this paper leans on
-
[9]
R. Diestel. Tangles: A structural approach to artificial intelligence in the empirical sciences. Cambridge University Press, 2024. e-book: tangles-book.com/book/
work page 2024
- [1]
-
[2]
Item 5/18/2014 on http://openpsychometrics.org/tests/IPIP-BFFM/, May 2014
Answers to the Big Five Personality Test, constructed with items from the International Personality Item Pool. Item 5/18/2014 on http://openpsychometrics.org/tests/IPIP-BFFM/, May 2014
work page 2014
-
[3]
Item 11/8/2018 on https://openpsychometrics.org/ rawdata/, November 2018
Answers to the IPIP Big Five Factor Markers. Item 11/8/2018 on https://openpsychometrics.org/ rawdata/, November 2018
work page 2018
-
[4]
T. Buchanan, J. Johnson, and L. R. Goldberg. Implementing a five-factor personality inventory for use on the internet. Europ. J. Psych. Assessment , 21(2), 2005
work page 2005
-
[5]
R. Cattell. The description of personality: Principles and findings in a factor analysis. Amer. J. Psychol. , 58:69–90, 1945. 30
work page 1945
-
[6]
P. T. Costa and R. R. McCrae. Revised NEO Personality Inventory (NEO PI-R) and NEO Five-Factor Inventory (NEO-FFI) . Psychological Assess- ment Resources, 1992
work page 1992
-
[7]
R. Diestel. Tangles: a new paradigm for clusters and types. arXiv:2006.01830
arXiv 2006
Show all 16 references
-
[8]
R. Diestel. Graph Theory (6th edition). Springer-Verlag, 2024. Electronic edition available at http://diestel-graph-theory.com/
2024
-
[10]
D. Fiske. Consistency of the factorial structures of personality ratings from different sources. J. Abnorm. Soc. Psychol , 44(3):329–344, 1949
1949
-
[11]
L. R. Goldberg. The development of markers for the Big-Five factor struc- ture. Psychological Assessment, 4:26–42, 1992
1992
-
[12]
Administering IPIP measures, with a 50-item sample questionnaire
International Personality Item Pool. Administering IPIP measures, with a 50-item sample questionnaire. https://ipip.ori.org/new ipip-50-item-scale.htm
-
[13]
McCrae and P
R. McCrae and P. Costa. A five-factor theory of personality. In L. Pervin and O. John, editors, Handbook of personality: theory and research , pages 139–153. Guilford Press, 1999
1999
-
[14]
McCrae and O
R. McCrae and O. John. An introduction to the five-factor model and its applications. J. Personality , 60(2), 1992
1992
-
[15]
Big five personality test
Open-source Psychometrics Project. Big five personality test. http://openpsychometrics.org/tests/IPIP-BFFM/
-
[16]
Tupes and R
E. Tupes and R. Christal. Recurrent personality factors based on trait ratings. USAF ASD Tech. Rep. 61 97 , 1961. 7 Appendix 7.1 The questionnaire Q Here is a list of the 50 questions in the questionnaire Q used in [2] and [3]: Openness O1 I have a rich vocabulary. O2 I have d...
1961
Reviewed August 12, 2026 · model on record in the stance chip above.
Discussion (0). Continue with ORCID to comment.