REVIEW 3 major objections 6 minor 45 references
Dark matter fraction derived from the M31 rotation curve
T0 review · 3 major / 6 minor · reviewed 2026-08-11 · deepseek-v4-flash
Pith's one-line read Modeling M31 as the remnant of a gas-rich major merger, this paper derives a total dynamical mass of $4.5 \times 10^{11}$ solar masses within 137 kpc, finds that 68% of that mass is dark, and argues that kinematic tracers beyond ~25–40…
desk verdict A better-fitting M31 rotation-curve model, but the headline dark fraction is an extrapolation from one fitted scale factor at 20 kpc. read the letter →
The pith
A machine-rendered reading of the paper's core claim, the machinery that carries it, and where it could break.
The reading
What carries the argument
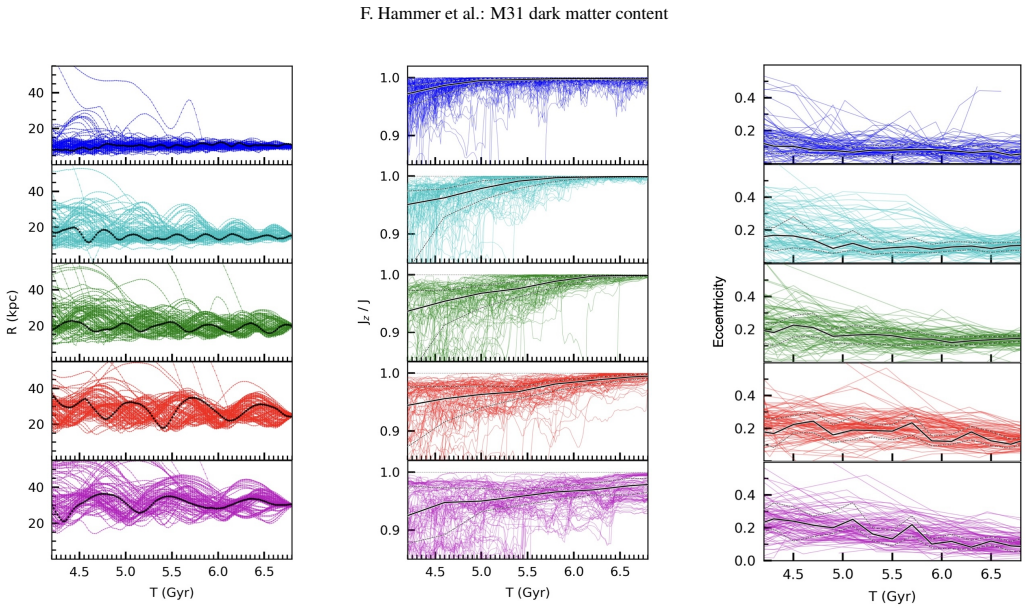
The central object is a hydrodynamical merger-remnant model of M31, called model 371, built by taking the earlier H18 model 288 and multiplying its dark matter content by $1/1.6$ while keeping the baryonic components fixed. Its rotation curve is extracted from the simulated position-velocity diagram of HI gas using the same maximal-velocity method applied to the real observations, and compared with an averaged observed rotation curve formed by combining the two published HI surveys after applying a 0.94 correction factor to one of them. The supporting mechanism is an orbital-history analysis: gas particles are tracked from the merger epoch to the present, and those at 25–30 kpc are found to have completed only two to four orbits, which the paper uses, following earlier work on relaxation times, to declare the outer gas out of virial equilibrium. This non-equilibrium verdict is what allows the paper to attribute the outer velocity rise to returning tidal-tail material rather than to a heavier dark halo.
What would settle it
A decisive test is a high-resolution map of the velocity field of M31's outer HI disk beyond 25 kpc: the model predicts an approaching–receding asymmetry of roughly 40 km/s and gas infalling from a tidal tail, so observing regular circular rotation there would falsify the non-equilibrium explanation and, with it, the model-dependent mass normalization.
Extended reading notes
Core claim
On its own terms, the paper's discovery is that M31's carefully averaged HI rotation curve is reproduced in detail only when the dark matter content of the merger model is reduced by a factor of 1.6 from the earlier H18 simulation (model 371 versus model 288). In this model the 14–15 kpc bump arises from the axisymmetric stellar disk, and the observed velocity increase beyond 25 kpc arises from gas returning from a tidal tail, not from an equilibrium dark halo. After rescaling to the observed rotation curve, the total mass enclosed within the standard virial radius of 137 kpc is $4.5 \times 10^{11}\,M_\odot$: $2.95 \times 10^{11}\,M_\odot$ of dark matter and $1.55 \times 10^{11}\,M_\odot$ of baryons, for a dark fraction of 68%. The paper further shows that gas particles at 25–30 kpc have made only two to four orbits since the merger, which is below the threshold needed for virial equilibrium, so the outer rotation curve and any tracer beyond roughly 30 kpc do not measure the equilibrium gravitational potential.
Load-bearing premise
The load-bearing premise is that the shape of M31's dark matter halo is the one produced by the specific merger simulation, with only its overall density rescaled by a factor of 1.6; if the true halo profile or the actual merger history differs, the derived enclosed mass and the 68% dark fraction would change.
Editorial extensions
If this is right
- M31's total dynamical mass within 137 kpc is $4.5 \times 10^{11}\,M_\odot$, with 68% dark matter, lower than many estimates derived from equilibrium tracers.
- The 14 kpc bump in the rotation curve is produced by the stellar disk, and the velocity rise beyond 25 kpc is produced by gas returning from a tidal tail, so neither feature should be fitted with an equilibrium dark halo model.
- Globular clusters, planetary nebulae, and dwarf satellites beyond roughly 25–40 kpc have not completed enough orbits since the merger to be in equilibrium with the remnant potential, so they cannot be used to measure M31's total mass.
- The baryonic fraction within 137 kpc is about 32%, more than twice the cosmic average, which casts doubt on the existence of a missing baryon problem in M31.
- Mass estimates of M31 from rotation curves and discrete tracers must account for the recent merger; the new model supersedes earlier equilibrium-based estimates from the same data.
Reading between the lines
- The same factor-of-1.6 reduction in dark matter might apply to other spirals that recently underwent major mergers, implying that equilibrium-based rotation-curve fits could systematically overestimate their total masses and dark fractions.
- The model predicts a specific observable signature in M31's outer disk—an approaching–receding asymmetry of roughly 40 km/s and non-circular, infalling gas motions—that a future deep HI observation could confirm or rule out.
- An independent check would be to model the giant stream and shells with the lower-mass halo; if the stream's orbital dynamics require a heavier halo, the normalization of the dark matter profile would need revision.
- If the 32% baryonic fraction holds, the missing baryon problem may be a selection effect: galaxies with recent mergers could retain more baryons than the cosmic average, which would matter for baryon-census studies.
Editorial analysis
A structured set of objections, weighed in public.
Referee Report
Summary. The paper constructs a dynamical model of M31 as a major-merger remnant, starting from the H18 simulations and reducing the dark matter content by a factor of 1.6 calibrated to the observed HI rotation curve at 20 kpc (model 371). The model is shown to reproduce many observed features of M31, including the 14 kpc bump and the velocity increase beyond 25 kpc, with a reduced chi-square improvement from 9.3 to 2.2 relative to the original model 288. From the model's radial mass distribution, the authors derive a total dynamical mass of 4.5 × 10^11 solar masses within R200 = 137 kpc and a dark matter fraction of 68%. They further argue that gas beyond 25 kpc is out of equilibrium due to material returning from a tidal tail, which invalidates mass estimates based on distant kinematic tracers.
Significance. If the derived mass and dark matter fraction were robust, they would imply a baryon fraction of 32% within R200, much higher than the cosmic mean, and would challenge mass estimates based on distant globular clusters and satellites under equilibrium assumptions. The paper's strength is its use of a hydrodynamical merger model that reproduces multiple independent observed features (giant stream, 10 kpc ring, age-velocity dispersion relation, RC shape), and its careful comparison of two HI rotation curves. However, the central mass and dark fraction are extrapolated well beyond the observed RC extent, and the robustness of this extrapolation is not quantified. The paper is clearly written and advances a specific, falsifiable scenario for M31's outer gas kinematics.
major comments (3)
- [Section 5, Figure 9; Section 3] The quoted Mtot = 4.5 × 10^11 solar masses and 68% dark fraction within R200 = 137 kpc are not directly constrained by the observed RC, which extends only to ~35 kpc. The DM radial profile is inherited from H18 model 288 and rescaled by a single factor calibrated at 20 kpc. Because the observed RC samples only the inner portion of the halo, the enclosed mass at 137 kpc depends strongly on the assumed halo concentration or shape (e.g., NFW vs. Einasto vs. Dehnen); the paper provides no systematic uncertainty from this assumption. Section 5 states 'Any extrapolation has to be model dependent and should be well described,' but the headline claims are presented without such a caveat. This is load-bearing for the central claims.
- [Section 3, Figure 3] The same averaged RC used to set the DM scaling factor at 20 kpc is used to validate model 371 via the reduced chi-square (9.3 vs 2.2) and to claim that the RC's detailed features are reproduced. The validation is therefore not independent of the calibration. The paper should separate the features that are genuinely predicted by the merger model (e.g., the 14 kpc bump from the baryonic disk, the velocity increase beyond 25 kpc from tidal-tail material) from those that are set by the single fitted parameter, and should discuss the covariance between the scaling factor and other model parameters such as baryonic mass and disk scale length.
- [Section 4, Figures 6 and 8] The conclusion that gas beyond 25 kpc is out of equilibrium and hence cannot trace the mass distribution rests on a single simulation model (model 371) and an analogy with Gnedin & Ostriker (1999) developed for collisionless stellar systems. The threshold radius of 25 kpc is not quantitatively justified; for example, the paper does not compare the radial acceleration of the gas particles with the centripetal acceleration expected from the potential, nor does it estimate the impact of the non-circular motions on the inferred circular velocity. If the outer gas were closer to equilibrium, the velocity increase beyond 25 kpc would provide a direct mass constraint and could change the derived dark matter fraction substantially.
minor comments (6)
- [Figure 3] The reduced chi-square of 2.2 for model 371 is still significantly larger than 1; the paper should discuss whether remaining systematic discrepancies affect the mass estimate.
- [Section 2] The correction factor of 0.94 applied to the Chemin et al. (2009) RC is introduced descriptively; the authors should state how this factor was derived and what its uncertainty is, since it enters the construction of the averaged RC.
- [Figure 9] The left and right panels of Figure 9 use different radial ranges (35 kpc vs 300 kpc); the axes should be labeled consistently so that the reader can compare the mass distributions.
- [Abstract] The abstract and Section 5 quote a 68% dark matter fraction without noting that this is extrapolated from a model-dependent DM profile; adding a caveat would bring the abstract in line with the limitations discussed in the text.
- [Figure 5] The caption of Figure 5 mentions that blue points identify young stars, but the figure panel does not define the color coding; the caption should be self-contained.
- [Section 5] The comparison with Jiao et al. (2023) for the Milky Way would benefit from stating which halo profile is assumed in that study, since the difference between Einasto and Dehnen profiles is invoked as the reason for the discrepancy.
Circularity Check
Dark-matter fraction at 137 kpc inherits its radial halo shape from prior same-author simulation H18; the 68% dark fraction is therefore not independently determined by the rotation curve, though the RC shape tests have non-circular content.
-
self citation load bearing
[Section 3, 'Rotation curves from merger modeling' (model 288 selection and DM scaling); Section 5, discussion of R200; footnote 6.]
"H18 presented a set of five simulated models of M31 that provided very similar RCs (see their Appendix A), though they did not compare them to observational data. ... We first chose model 288 because it provides a HI disk with a size that is comparable to the one observed (see H18’s Figure 1). ... we held to this 32% baryonic fraction because it directly comes from our modeling that predicts a DM distribution extending up to 137 kpc."
Model 371 is constructed by taking H18 model 288 and rescaling only its DM normalization by a factor fit to the observed RC at 20 kpc. The observed HI RC extends only to about 35 kpc, so the cumulative mass at R200 = 137 kpc—and hence the 68% dark fraction—is not measured by the RC; it is inherited from H18's outer DM profile. H18 is prior work by the same group, and no independent constraint on halo concentration or profile shape (e.g., NFW versus Einasto versus cored) is given. The paper's own footnote admits the 32% baryonic fraction 'directly comes from our modeling.' The central mass/dark-fraction claim is therefore carried by a same-author simulation, not derived from the new rotation-curve data alone.
full rationale
The paper is transparent about the calibration step: it states 'we varied the DM content to best match the observed RC' and that the mass is 'obtained after scaling it to the observed HI rotation curve.' If the paper's only claim were the rotation-curve fit, that would be a fit rather than circular reasoning. The concern is that the headline quantity—Mtot = 4.5 x 10^11 solar masses within 137 kpc and the 68% dark fraction—depends on the outer DM profile, which is taken from H18 model 288 and only rescaled by the factor fit at 20 kpc. Because the RC constrains only the inner region (less than or about 35 kpc, with the normalization chosen at 20 kpc), the outer mass is an extrapolation of the same authors' earlier simulation. The paper acknowledges this in footnote 6 but does not supply an independent test of the halo shape. That is a load-bearing self-citation rather than a circular equation: the result is not identical to its input, but its numerical value is largely carried by the cited prior model. There is also non-circular content: the 14 kpc bump is tied to the disk component, the velocity rise beyond 25 kpc is linked to returning tidal-tail material, and the model reproduces several morphological features. These independent tests prevent the paper from being wholly circular, but the central mass and dark-fraction numbers would shift if a different outer halo profile were assumed. Score 4 reflects 'some self-citation; central claim still has independent content.'
Assumptions & free parameters
free parameters (4)
- Dark matter scaling factor =
1.6
- Chemin et al. RC normalization factor =
0.94
- Dehnen DM profile parameters (M0, h, n) =
M0=5.93e11 Msun, h=21.64 kpc, n=1.41
- Model 371 stellar mass =
1.2e11 Msun
assumptions (4)
- domain assumption M31 underwent a gas-rich major merger 2-3 Gyr ago
- ad hoc to paper The radial shape of M31's dark matter halo is the same as in H18 model 288, only rescaled by 1.6
- domain assumption Gas beyond about 25 kpc is not in virial equilibrium because of returning tidal tail material
- domain assumption The observed HI rotation curve at 20 kpc is a clean tracer of the enclosed mass, with DM dominating over baryons and no important non-equilibrium effect
Cite this review
Pith. "Pith review of Dark matter fraction derived from the M31 rotation curve." pith.science (2026). https://pith.science/paper/ZS42T2W3
@misc{pith2026241202737,
  author       = {Pith},
  title        = {Pith review of: Dark matter fraction derived from the M31 rotation curve},
  year         = {2026},
  howpublished = {\url{https://pith.science/paper/ZS42T2W3}},
  note         = {Machine review of arXiv:2412.02737}
}
abstract
Mass estimates of a spiral galaxy derived from its rotation curve must account for the galaxy's past accretion history. There are several lines of evidence indicating that M31 experienced a major merger 2 to 3 Gyr ago. Here, we have generated a dynamical model of M31 as a merger remnant that reproduces most of its properties, from the central bar to the outskirts. The model accounts for the past major merger, and reproduces the details of M31's rotation curve, including its 14 kpc bump and the observed increase of velocity beyond 25 kpc. Furthermore, we find non-equilibrium and oscillatory motions in the gas of the merger-remnant outskirts caused by material in a tidal tail returning to the merger remnant. A total dynamical M31 mass of 4.5 $\times 10^{11} M_{\odot}$ within 137 kpc has been obtained after scaling it to the observed HI rotation curve. Within this radial distance, 68% of the total dynamical mass is dark.
Figures


Figures from the paper (6 more)




Reference graph
Works this paper leans on
-
[1]
Babcock, H. W. 1939, Lick Observatory Bulletin, 498, 41
work page 1939
-
[2]
Barnes, J. E. 2002, MNRAS, 333, 481
work page 2002
-
[3]
Barnes, J. E. & Hernquist, L. 1996, ApJ, 471, 115
work page 1996
-
[4]
2023, arXiv e-prints, arXiv:2305.03293
Bhattacharya, S. 2023, arXiv e-prints, arXiv:2305.03293
arXiv 2023
-
[5]
Bhattacharya, S., Arnaboldi, M., Gerhard, O., et al. 2021, A&A, 647, A130
work page 2021
-
[6]
2023, MNRAS, 522, 6010 Blaña Díaz, M., Gerhard, O., Wegg, C., et al
Bhattacharya, S., Arnaboldi, M., Hammer, F., et al. 2023, MNRAS, 522, 6010 Blaña Díaz, M., Gerhard, O., Wegg, C., et al. 2018, MNRAS, 481, 3210 Blaña Díaz, M., Wegg, C., Gerhard, O., et al. 2017, MNRAS, 466, 4279
work page 2023
-
[7]
1978, PhD thesis, University of Groningen, Netherlands
Bosma, A. 1978, PhD thesis, University of Groningen, Netherlands
1978
-
[8]
2009, ApJ, 705, 1395
Chemin, L., Carignan, C., & Foster, T. 2009, ApJ, 705, 1395
2009
Show all 45 references
-
[9]
2024, in American Astronomical So- ciety Meeting Abstracts, V ol
Chen, Z., Williams, B., Lang, D., et al. 2024, in American Astronomical So- ciety Meeting Abstracts, V ol. 243, American Astronomical Society Meeting Abstracts, 428.06
2024
-
[10]
2010, A&A, 511, A89
Corbelli, E., Lorenzoni, S., Walterbos, R., Braun, R., & Thilker, D. 2010, A&A, 511, A89
2010
-
[11]
J., Williams, B
Dalcanton, J. J., Williams, B. F., Lang, D., et al. 2012, ApJS, 200, 18
2012
-
[12]
1993, MNRAS, 265, 250
Dehnen, W. 1993, MNRAS, 265, 250
1993
-
[13]
B., et al
Delgado-Serrano, R., Hammer, F., Yang, Y . B., et al. 2010, A&A, 509, A78
2010
-
[14]
R., Koposov, S
Dey, A., Najita, J. R., Koposov, S. E., et al. 2023, ApJ, 944, 1
2023
-
[15]
E., Guhathakurta, P., Seth, A
Dorman, C. E., Guhathakurta, P., Seth, A. C., et al. 2015, ApJ, 803, 24
2015
-
[16]
J., Lynden-Bell, D., & Sandage, A
Eggen, O. J., Lynden-Bell, D., & Sandage, A. R. 1962, ApJ, 136, 748
1962
-
[17]
1965, Trudy Astrofizicheskogo Instituta Alma-Ata, 5, 87
Einasto, J. 1965, Trudy Astrofizicheskogo Instituta Alma-Ata, 5, 87
1965
-
[18]
M., Fardal, M., et al
Escala, I., Gilbert, K. M., Fardal, M., et al. 2022, AJ, 164, 20
2022
-
[19]
M., Wojno, J., Kirby, E
Escala, I., Gilbert, K. M., Wojno, J., Kirby, E. N., & Guhathakurta, P. 2021, AJ, 162, 45
2021
-
[20]
A., Weinberg, M
Fardal, M. A., Weinberg, M. D., Babul, A., et al. 2013, MNRAS, 434, 2779
2013
-
[21]
2024, ApJ, 963, 22
Feng, Z.-X., Li, Z., Shen, J., et al. 2024, ApJ, 963, 22
2024
-
[22]
Gnedin, O. Y . & Ostriker, J. P. 1999, ApJ, 513, 626
1999
-
[23]
2009, A&A, 507, 1313
Hammer, F., Flores, H., Puech, M., et al. 2009, A&A, 507, 1313
2009
-
[24]
Hammer, F., Puech, M., Chemin, L., Flores, H., & Lehnert, M. D. 2007, ApJ, 662, 322
2007
-
[25]
2018, Monthly Notices of the Royal As- tronomical Society, 475, 2754
Hammer, F., Yang, Y ., Wang, J., et al. 2018, Monthly Notices of the Royal As- tronomical Society, 475, 2754
2018
-
[26]
F., Cox, T
Hopkins, P. F., Cox, T. J., Younger, J. D., & Hernquist, L. 2009, ApJ, 691, 1168
2009
-
[27]
Ibata, R., Irwin, M., Lewis, G., Ferguson, A. M. N., & Tanvir, N. 2001, Nature, 412, 49
2001
-
[28]
2023, Astronomy & Astrophysics, 678, A208
Jiao, Y ., Hammer, F., Wang, H., et al. 2023, Astronomy & Astrophysics, 678, A208
2023
-
[29]
2021, Astronomy & Astrophysics, 654, A25
Jiao, Y ., Hammer, F., Wang, J., & Yang, Y . 2021, Astronomy & Astrophysics, 654, A25
2021
-
[30]
R., Sharma, S., Lewis, G
Kafle, P. R., Sharma, S., Lewis, G. F., Robotham, A. S. G., & Driver, S. P. 2018, MNRAS, 475, 4043
2018
-
[31]
R., Dolphin, A
Lewis, A. R., Dolphin, A. E., Dalcanton, J. J., et al. 2015, ApJ, 805, 183
2015
-
[32]
1925, MNRAS, 85, 865
Lundmark, K. 1925, MNRAS, 85, 865
1925
-
[33]
Mayall, N. U. 1951, Publications of Michigan Observatory, 10, 19
1951
-
[34]
F., Frenk, C
Navarro, J. F., Frenk, C. S., & White, S. D. M. 1997, The Astrophysical Journal, 490, 493Ð508
1997
-
[35]
Navarro, J. F. & Steinmetz, M. 2000, ApJ, 538, 477
2000
-
[36]
Ostriker, J. P. & Peebles, P. J. E. 1973, ApJ, 186, 467 Planck Collaboration, Aghanim, N., Akrami, Y ., et al. 2020, A&A, 641, A6
1973
-
[37]
2024, ApJ, 972, 70
Roche, C., Necib, L., Lin, T., Ou, X., & Nguyen, T. 2024, ApJ, 972, 70
2024
-
[38]
C., Ford, W
Rubin, V . C., Ford, W. K., J., & Thonnard, N. 1978, ApJ, 225, L107
1978
-
[39]
Sanderson, R. E. & Helmi, A. 2013, MNRAS, 435, 378
2013
-
[40]
& Ostriker, J
Toth, G. & Ostriker, J. P. 1992, ApJ, 389, 5
1992
-
[41]
2024, in EAS2024, 184
Tsakonas, C., Bhattacharya, S., Arnaboldi, M., et al. 2024, in EAS2024, 184
2024
-
[42]
Veljanoski, J., Ferguson, A. M. N., Mackey, A. D., et al. 2013, ApJ, 768, L33
2013
-
[43]
L., Evans, N
Watkins, L. L., Evans, N. W., & An, J. H. 2010, MNRAS, 406, 264
2010
-
[44]
F., Dolphin, A
Williams, B. F., Dolphin, A. E., Dalcanton, J. J., et al. 2017, ApJ, 846, 145
2017
-
[45]
2024, MNRAS, 528, 2653 Article number, page 9 of 9
Zhang, X., Chen, B., Chen, P., Sun, J., & Tian, Z. 2024, MNRAS, 528, 2653 Article number, page 9 of 9
2024
Reviewed August 11, 2026 · model on record in the stance chip above.
Discussion (0). Continue with ORCID to comment.