REVIEW 4 major objections 7 minor 18 references
X-Sifter: detecting transients in X-ray data using the optimal Poisson matched filter
T0 review · 4 major / 7 minor · reviewed 2026-08-11 · deepseek-v4-flash
Pith's one-line read X-Sifter detects 30% more X-ray sources than the standard Chandra catalog.
desk verdict A worthwhile pipeline paper whose headline sensitivity gain over CSC2.1 is not yet quantitatively established because the comparison does not control for threshold differences. read the letter →
The pith
A machine-rendered reading of the paper's core claim, the machinery that carries it, and where it could break.
The reading
What carries the argument
The load-bearing object is the Poisson noise matched filter kernel $K_{\mathrm{PMF}}(F)=\ln(1+\frac{F}{B}P)$, where $P$ is the normalized point spread function and $B$ the background, applied by cross-correlating the image with this kernel. Because the kernel depends on the unknown source flux $F$, the pipeline imposes a thresholding relation (Equation 14) that fixes the filter flux $F_{\mathrm{th}}$ to equal the source flux at the detection limit, making the test approximately optimal for the faintest sources of interest. The implementation handles real data by partitioning each CCD into $16\times16$ sectors with buffers, modeling or rotating PSF stamps per sector and per energy channel, estimating a constant background per sector from the median of gridded tiles, and combining independent energy channels in quadrature. Precomputed libraries of PSF stamps and of the noise distribution $P(S|H_0)$ for a grid of background values keep runtime practical.
What would settle it
Run X-Sifter on simulated images with a known background gradient inside a single sector, such as a linear ramp across the sector with the same mean as a flat field, and compare the recovered flux and signal-to-noise of injected sources to the flat case; if the detection threshold shifts or completeness drops by more than the claimed margin, the sector-constant assumption is falsified. Alternatively, apply the code to a real field with strong structured background, such as the Galactic ridge, and compare against a deeper reference catalog: if the 30 percent gain vanishes or false positives appear, the assumption fails.
Extended reading notes
Core claim
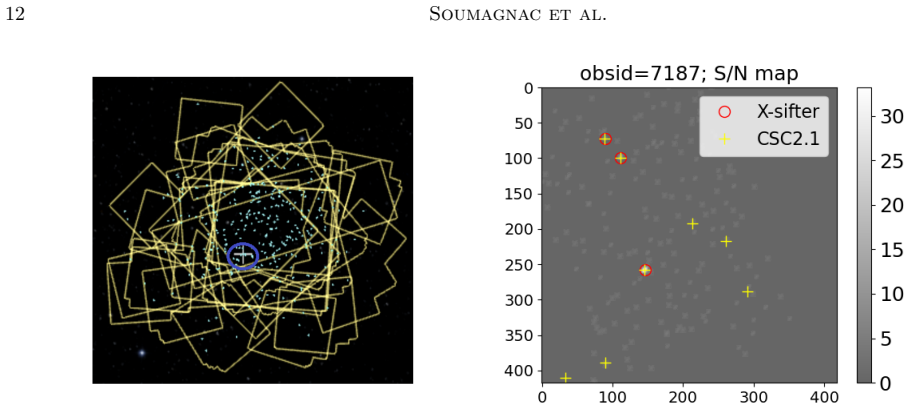
The central claim is that X-Sifter, a pipeline implementing the Poisson noise matched filter of Ofek & Zackay, recovers real Chandra sources with significantly higher sensitivity than the catalog standard. In a comparison restricted to fields observed only once with Chandra, X-Sifter detected about 30 percent more real sources than CSC2.1, all near the detection threshold. For sources detected by both methods, X-Sifter's signal-to-noise ratio was on average 1.3 times higher near the threshold, which the authors equate to a factor of 1.8 in survey speed. The paper further argues that temporal subdivision of exposures is essential for transient detection, since short bursts are buried in the background of long stacked exposures; in a check on fields observed many times, all quiescent sources found by X-Sifter had CSC2.1 counterparts, while the unmatched detections were variable on timescales shorter than the stack.
Load-bearing premise
The pipeline assumes the background is constant within each 16 by 16 sector and estimates it as the median of gridded tiles after outlier rejection; if the true background varies inside a sector, the filter kernel and threshold are miscalibrated and the claimed sensitivity gain may not be realized.
Editorial extensions
If this is right
- Single-observation Chandra archival searches gain roughly 30 percent more detections near the threshold at the same false-alarm rate.
- The 1.3-fold signal-to-noise gain near threshold translates into a 1.8-fold increase in survey speed, allowing surveys to reach the same depth in less exposure time.
- Temporal subdivision of exposures, when enabled, can expose short transients that are missed by catalogs built from stacked images, at the cost of running the pipeline multiple times.
- The kernel and thresholding relation are general for any Poisson imaging instrument; the authors state the pipeline can be adapted to XMM-Newton and similar data.
Reading between the lines
- The sector-constant background assumption is likely the limiting factor in crowded fields or regions with strong background gradients; testing on such fields would show whether the claimed gain holds there.
- The exponential extrapolation of the gamma-S curve used for high-significance conversion is acknowledged in the paper to lose accuracy, so X-Sifter's signal-to-noise values above about 7 sigma may be less reliable than the catalog's.
- The same filtering formalism could be applied to count images in other Poisson-dominated regimes, such as gamma-ray or neutrino telescopes, with appropriate PSF and background models.
Signed reviews
Editorial analysis
A structured set of objections, weighed in public.
Referee Report
Summary. The paper presents X-Sifter, a source-detection pipeline for X-ray images based on the Poisson matched filter of Ofek & Zackay (2018b). The pipeline partitions each CCD into 16x16 sectors and several energy channels, models the PSF with MARX, estimates a single background value per sector, precomputes the null-hypothesis distribution of the detection statistic to set thresholds, and filters each sector to produce a combined S/N map. The authors validate with injected-source simulations and compare detections with the Chandra Source Catalog 2.1 in ten single-observation fields. They claim ~30% more sources detected, a 1.3x higher S/N near the detection limit, and a factor 1.8 increase in survey speed. They also report a small false-positive check on five stacked fields.
Significance. If the sensitivity gains are real, X-Sifter would be a valuable community tool: it implements the optimal Poisson matched filter in a practical way, with publicly released code, precomputed PSF libraries, and handling of energy-dependent PSF and background variations. The injection tests demonstrate internal consistency of the implementation. However, the headline quantitative claims are not yet convincingly supported: the comparison with CSC2.1 is not performed at matched false-alarm probabilities, the S/N conversion relies on an approximate extrapolation acknowledged by the authors, and the false-positive check uses a different sample than the main comparison. The background estimator is a single median per sector, which may be biased in structured fields. These issues are addressable, but the current paper does not establish the advertised factors.
major comments (4)
- [Section 4.2] The claimed ~30% increase in detected sources and the 1.3x higher S/N are not supported by a matched-threshold comparison. The paper does not state the false-alarm probability gamma or the corresponding S/N threshold used by X-Sifter for this comparison, nor does it give the effective significance threshold used by CSC2.1/wavdetect. If X-Sifter ran at a lower threshold, the 55 extra sources near the detection limit would be a threshold artifact. The mean S/N ratio is also not apples-to-apples because X-Sifter converts its S statistic to Gaussian sigma via the gamma-S relation, which the paper itself notes in Sections 2.2.3 and 4.2 is approximate and becomes inaccurate at high sigma. The authors should present the comparison at equal expected false detections per field, report the thresholds used by both pipelines, and provide uncertainties on the ratio (55/179 carries a binomial error of roughly +/-6%).
- [Section 4.3] The false-positive check does not validate the reality of the 55 extra sources in the single-observation fields. It uses five different fields with stacked CSC detections, where only 10 X-Sifter sources lack CSC counterparts, all attributed to transients or variability. This sample is much smaller and drawn from different data. To support the claim that the 55 extra sources are real, the authors should examine a random subset of those sources directly, for example by using any other observations of the same regions, or by injecting sources into pure simulated background images and running the full pipeline with the same threshold to estimate the empirical false-positive rate.
- [Section 3.1, step 4(c)] The background for a 16x16 sector is a single median value computed from a 4x4 grid of tiles after iterative outlier rejection. If the true background is spatially varying within a sector, or if the outlier rejection is biased by bright sources or flares, the single value of B enters both the PMF kernel (Equation 2) and the threshold (Equation 14), potentially miscalibrating the detection significance. The injection test in Section 4.1 uses the same background estimator and is therefore insensitive to this bias. The authors should test the pipeline on fields with structured background, or add a simulation with a known background gradient, to quantify the effect on completeness and false-alarm rate.
- [Section 4.1] The injection test is partially circular. The injected flux Fth is derived from Equation 14 using the same background estimate and PSF that the pipeline will use, so the recovered S/N peaking at the chosen sigma is largely by construction. This demonstrates numerical correctness but not absolute sensitivity. The external comparison to CSC2.1 is meant to provide the missing calibration, but the threshold-matching issues in the first major comment prevent it from doing so. A test with sources injected at random fluxes over a range (not only Fth) would provide a more meaningful completeness curve.
minor comments (7)
- [Abstract] The symbol '∼=' should be '≈' (an approximate equality sign, not a tilde-equals).
- [Section 2.2.3] The notation mixes 'Sthresh' and 'Sth'; please use one consistent symbol throughout.
- [Section 2.2.3] The phrase 'slope ranging from ∼ −1/2 and ∼ −3/2' should read 'between ∼ −1/2 and ∼ −3/2'.
- [Section 3.1, step 4(c)] The background estimation description should clarify that the final representative background is the median of the tile means, not a single global fit to the sector.
- [Section 3.4] 'X-swifter' is a typo for 'X-Sifter'.
- [Section 4.2] 'Theses two sources' should be 'These two sources'; the paper would also benefit from listing the ten OBSIDs used for the comparison, either in a table or in an appendix.
- [Section 4.3] 'X=Sifter' is a typo for 'X-Sifter'.
Circularity Check
Central sensitivity claim is externally benchmarked; only the injected-source validation is circular by construction.
-
fitted input called prediction
[Section 4.1 (simulation validation), using Eq. 14 from §2.2.1]
"For a false-alarm probability γsim corresponding to a 4σ detection, and using the value of B measured in step (1) and the stamp P simulated in step (2), we calculate Fth by solving Equation 14; ... We generate a simulated image by injecting a source modeled as M(q − q0) = Poisson(B + FthP(q − q0)) at an arbitrary location q0 in the real image. ... We repeat this procedure 10,000 times and find that the distribution of signal-to-noise (S/N) levels peaks near 4σ, consistent with the γsim chosen."
Fth is not an independent test flux: it is solved from Eq. 14, which was derived (Eqs. 8–12) by imposing Sth = E(S_H1(Fs)) at Fs = Fth, with Sth the γsim-percentile of P(S|H0). Injecting Poisson(B+FthP) and filtering with K(Fth) therefore gives E(S)=Sth by construction, which converts to γsim (≈4σ). The measured 'peak near 4σ' is thus the defining equation read backward; the test can only check numerical consistency (solver/FFT/interpolation), not validate the thresholding relation or the detection statistic.
full rationale
The central derivation is otherwise self-contained: the Neyman-Pearson lemma justifies the likelihood-ratio test; Eq. 1–3 define the PMF statistic; Eqs. 8–14 derive the thresholding relation from the detection-limit definition; and P(S|H0) is obtained by Monte Carlo over the stated Poisson model. The headline ~30% sensitivity gain is benchmarked against the external Chandra Source Catalog, not against X-Sifter's own fitted quantities, so that claim has independent content. The only circular step is the §4.1 injection validation, where Fth is chosen by solving Eq. 14 and therefore reproduces the chosen 4σ peak by construction; this is a minor, non-load-bearing self-consistency check. The paper's unspecific γ threshold in the CSC comparison is a correctness risk, but it is not circularity. Self-citation of Ofek & Zackay (2018a,b) is not flagged because the cited PMF derivation is a published mathematical result with stated assumptions and is not fitted to the present data.
Assumptions & free parameters
free parameters (6)
- Fth =
determined by Equation 14 for each sector, background, and gamma
- Sector size and buffer =
16 by 16 sectors with a 160 pixel buffer
- Energy channels =
nc = 3 logarithmic channels by default
- Background tile grid =
n = 4 tiles per side by default
- False-alarm probability gamma =
4 sigma used in injection tests; pipeline threshold configurable
- PSF crop fraction =
99 percent by default
assumptions (6)
- domain assumption Pixel counts follow Poisson statistics with constant expected background B within a sector (Section 2.1, Equation 2).
- standard math Neyman-Pearson lemma establishes the likelihood-ratio test as most powerful at fixed false-alarm probability (Section 2.1).
- domain assumption MARX simulations accurately represent the Chandra PSF for all sectors and energy channels (Section 3.2.1).
- domain assumption PSF and background are approximately constant within each 16 by 16 sector (Section 3.1, step 3).
- domain assumption Energy channels provide independent information, so S/N values combine in quadrature (Equation 16, Section 2.2.5).
- ad hoc to paper The gamma-S relation can be extrapolated exponentially to low false-alarm probabilities (Section 2.2.3).
Cite this review
Pith. "Pith review of X-Sifter: detecting transients in X-ray data using the optimal Poisson matched filter." pith.science (2026). https://pith.science/paper/NMXTK44K
@misc{pith2026241207858,
  author       = {Pith},
  title        = {Pith review of: X-Sifter: detecting transients in X-ray data using the optimal Poisson matched filter},
  year         = {2026},
  howpublished = {\url{https://pith.science/paper/NMXTK44K}},
  note         = {Machine review of arXiv:2412.07858}
}
read the original abstract
We present X-sifter, a software package designed for near-optimal detection of sources in X-ray images and other forms of photon images in the Poisson-noise regime. The code is based on the Poisson-noise-matched filter (Ofek & Zackay), which provides an efficient method for calculating the delta log-likelihood function for source detection. The software accounts for several complexities inherent in real data, including variations in both the instrumental Point Spread Function (PSF) and background across the detector and as a function of energy. We validate the pipeline using real data with simulated source injections, as well as actual Chandra images. A comparison between the sources detected by our pipeline and those in the Chandra Source Catalog (CSC) suggests an approximate ~30% increase in the number of detected (real) sources. Near the detection limit, the reported S/N of our pipeline is approximately 1.3x higher than that of the CSC. This corresponds to a factor of 1.8 increase in survey speed.
Figures


Figures from the paper (6 more)


Reference graph
Works this paper leans on
- [1]
-
[2]
H., Lott, B., & The Fermi-LAT collaboration
Ballet, J., Bruel, P., Burnett, T. H., Lott, B., & The Fermi-LAT collaboration. 2023, arXiv e-prints, arXiv:2307.12546
arXiv 2023
-
[3]
1996, A&AS, 117, 393
Bertin, E., & Arnouts, S. 1996, A&AS, 117, 393
1996
-
[4]
1979, ApJ, 228, 939 De Luca, A., Salvaterra, R., Belfiore, A., et al
Cash, W. 1979, ApJ, 228, 939 De Luca, A., Salvaterra, R., Belfiore, A., et al. 2021, A&A, 650, A167
work page 1979
-
[5]
N., Primini, F
Evans, I. N., Primini, F. A., Glotfelty, K. J., et al. 2010, ApJS, 189, 37
2010
-
[6]
Evans, I. N., Evans, J. D., Mart ´ ınez-Galarza, J. R., et al. 2024, arXiv e-prints, arXiv:2407.10799
arXiv 2024
-
[7]
E., Kashyap, V., Rosner, R., & Lamb, D
Freeman, P. E., Kashyap, V., Rosner, R., & Lamb, D. Q. 2002, ApJS, 138, 185
work page 2002
-
[8]
1986, ApJ, 303, 336
Gehrels, N. 1986, ApJ, 303, 336
1986
Show all 18 references
-
[9]
1984, SAO Special Report, 393
Schwarz, J. 1984, SAO Special Report, 393
1984
-
[10]
M., Rutledge, R
Law, N. M., Rutledge, R. E., & Kulkarni, S. R. 2004, MNRAS, 350, 1079
2004
-
[11]
M., et al
Macias, O., Gordon, C., Crocker, R. M., et al. 2018, Nature Astronomy, 2, 387
2018
-
[12]
2012, MNRAS, 422, 1674
Masias, M., Freixenet, J., Llad´ o, X., & Peracaula, M. 2012, MNRAS, 422, 1674
2012
-
[13]
R., Bertsch, D
Mattox, J. R., Bertsch, D. L., Chiang, J., et al. 1996, ApJ, 461, 396
1996
-
[14]
Neyman, J., & Pearson, E. S. 1933, Philosophical Transactions of the Royal Society of London Series A, 231, 289
1933
-
[15]
O., Shvartzvald, Y., Sharon, A., et al
Ofek, E. O., Shvartzvald, Y., Sharon, A., et al. 2023, PASP, 135, 124502
2023
-
[16]
Stetson, P. B. 1987, PASP, 99, 191
1987
-
[17]
Stewart, I. M. 2006, A&A, 454, 997
2006
-
[18]
Zackay, B., & Ofek, E. O. 2017, ApJ, 836, 187
2017
Reviewed August 11, 2026 · model on record in the stance chip above.
Discussion (0). Continue with ORCID to comment.