REVIEW 4 major objections 5 minor 24 references
PGRID: Power Grid Reconstruction in Informal Developments Using High-Resolution Aerial Imagery
T0 review · 4 major / 5 minor · reviewed 2026-08-11 · deepseek-v4-flash
Pith's one-line read The paper demonstrates that a two-stage deep-learning pipeline can reconstruct overhead power distribution grids in refugee camps from high-resolution drone imagery alone.
desk verdict A practical, honest application paper for mapping distribution grids in refugee camps, but the 'high-fidelity grid map' claim outruns an evaluation that stops at component-level F1. read the letter →
The pith
A machine-rendered reading of the paper's core claim, the machinery that carries it, and where it could break.
The reading
What carries the argument
The load-bearing mechanism is the two-stage FCN8-plus-DeepLabV3 pipeline with point supervision. The pole detector uses a four-component negative-log-likelihood loss—image-level, point-level, split-level via watershed boundaries, and false-positive suppression—so that point labels suffice for learning full pole blobs. The line segmenter uses a scaling factor of 4 to turn pixel-level masks into patch-wise presence labels, making thin lines learnable without requiring precise pixel alignment. Hard negative mining adds fence-like distractors to training to reduce false pole detections, and the final vectorization step converts raster predictions into lightweight pole centroids and buffered line polygons for mapping.
What would settle it
Take a test area where ground-truth pole-to-pole connectivity is known, for example from a completed field survey in Kalobeyei, run PGRID, and compare graph-theoretic properties such as number of connected components, average line length per pole, and reachability of all poles between predicted and true grids. If line F1 stays around 0.8 while connectivity agreement is substantially lower, the claim that the method reconstructs grid layout would be falsified.
Extended reading notes
Core claim
The central discovery is that the visible distribution grid can be recovered from overhead imagery at roughly 6 cm per pixel by treating it as two separate tasks rather than one end-to-end graph problem. An FCN8 semantic segmentation network, trained with point supervision and a four-component loss, localizes poles; an asymmetric DeepLabV3 network, trained to classify 4x4 image patches as containing a line or not, segments electrical lines. The predicted poles and lines are vectorized, skeletonized, and buffered to form a unified power grid map. Evaluated on the Turkana camps, the pipeline generalizes from Kakuma training data to the Kalobeyei test area, and the pole detector also matches or beats a bounding-box object-detection baseline on a public benchmark of overhead grid imagery. The authors frame the output as a visual guide for humanitarian mappers rather than a standalone annotator.
Load-bearing premise
The reconstructed grid is only as complete as the electrical lines that are visible in the drone imagery, so if occlusion or construction gaps make visible lines an unreliable proxy for true grid topology, the reported component-level accuracy will not translate into accurate grid maps.
Editorial extensions
If this is right
- In unplanned settlements, overhead distribution grids can be mapped from roughly 6 cm/pixel aerial imagery without smart-meter data or field surveys.
- Point labels for poles are sufficient for detection, lowering the annotation cost compared to bounding boxes.
- The same two-stage approach transfers from a trained camp to a different camp within the same settlement, with small variance across trials.
- The line segmentation model detects line presence with F1 around 0.77–0.82 even when ground-truth labels are offset by about 2 meters.
- The resulting grid maps can be merged with existing global power-system datasets to expose previously unmapped low-voltage areas.
Reading between the lines
- Editorial inference: Because the model is trained to predict visible lines rather than pole-to-pole connectivity, the reconstructed graph is likely to undercount lines where wires are occluded by vegetation, buildings, or shadows; a post-processing step that infers missing connections between detected poles could recover some of this topology.
- Editorial inference: The reported F1 is component-level, not graph-level; a natural test is to measure whether the predicted pole and line sets reproduce the true grid's connectivity, such as number of connected components or lines per pole, rather than just pixel or point overlap.
- Editorial inference: The method should generalize to other informal settlements if imagery of comparable resolution is available, but the hard-negative mining and distance thresholds are tuned to poles with long shadows in Turkana; re-calibrating them elsewhere is a testable extension.
Signed reviews
Editorial analysis
A structured set of objections, weighed in public.
Referee Report
Summary. The paper presents PGRID, a two-stage pipeline for mapping low- and medium-voltage power distribution infrastructure from ~6 cm/pixel drone imagery. Poles are detected with an FCN8 segmentation model trained from point labels using a four-component loss, and electrical lines are segmented with a patch-wise DeepLabV3 model controlled by a scaling factor. Detected poles and lines are vectorized and overlaid into a 'unified grid.' The models are trained on the Kakuma camp and tested on the geographically held-out Kalobeyei camp, with additional experiments on the GridTracer benchmark. The reported results are pole-detection F1 of 0.71 and line-segmentation F1 of 0.82, and the paper argues that PGRID can augment existing global power-system datasets for humanitarian mapping.
Significance. If the reconstruction claim held, PGRID would be a practical, low-cost tool for mapping distribution grids in informal settlements, where such maps are often absent. The paper has several genuine strengths: a geographically held-out test split (Kakuma train, Kalobeyei test), point supervision that reduces annotation burden, benchmark comparison against GridTracer, hard-negative mining, repeated trials with reported standard deviations, and a commitment to open code and a demo. However, the central claim of reconstructing the grid layout is not directly evaluated. The reported metrics are component-level, several evaluation choices are tuned on the test set, and the headline numbers come from the best-performing sub-camp. These issues must be addressed before the significance of the layout-reconstruction contribution can be assessed.
major comments (4)
- [Section 7.4 and Table 6] The evaluation thresholds and a model hyperparameter are selected using the same Kalobeyei test set on which performance is reported. Section 7.4 justifies the 10m pole-matching threshold by measuring shadow lengths of 100 poles sampled from the test area, and Table 6 in Section 7.3 selects the scaling factor sf=4 by comparing mIOU/F1 on the Kalobeyei test camps. This makes the headline F1 scores optimistic estimates rather than unbiased predictions for a new area. Please fix these choices using only the Kakuma training/validation split (or a separate hold-out), or explicitly present the results as tuned on the test set and provide a validation-set-based estimate of expected performance.
- [Section 3.4 and Eq. (1)] The paper defines the objective as estimating the power-grid graph Ga, but it never evaluates the reconstructed graph. The 'unified power grid' in Section 3.4 is a vectorized overlay of independently detected pole centroids and buffered line polygons; no connectivity, node-edge incidence, connected-component, or path-level metric is reported. High component-level F1 does not imply correct topology, especially since Section 3.2 states that the model predicts visible lines rather than inferring pole-to-pole connections, and Section 5.2 notes that K2 labels contain lines with no visible line in the imagery. Please add graph-level evaluation (for example, edge precision/recall against manually traced grid connectivity, connected-component accuracy, or path-length fidelity), or restrict the claim to component detection and segmentation.
- [Section 3.2 and Table 5] Line segmentation is evaluated with a 2m buffer applied to predictions, because the test labels are offset by about 2m from visible lines. The reported F1 of 0.82 therefore measures whether a prediction falls within a 4m-wide corridor around the ground truth, not spatial fidelity of the line location. Please report an unbuffered or label-corrected alignment metric (for example, centerline distance or unbuffered mIOU) and quantify how much of the 0.82 score is attributable to the buffer. Without this, the claim that PGRID provides 'a detailed and accurate representation of electricity access' is not supported.
- [Abstract and Table 3] The headline pole-detection F1 of 0.71 is the K1 all-match value at the 10m threshold with a ResNet101 backbone. The corresponding values for K2 and K3 are 0.70 and 0.69, and at the 5m threshold the ResNet101 strict/all F1 values range from 0.67 to 0.68. Reporting the best sub-camp result in the abstract overstates overall performance. Please report a pooled or camp-weighted aggregate metric, and in the abstract state the threshold and matching variant used.
minor comments (5)
- [Section 2, Eq. (1)] The map M is never defined; the text should specify how P(X) and L(X) are combined (for example, proximity-based joining, buffering, or simple overlay) so that Eq. (1) is not merely notational.
- [Section 2] The grid graph Ga is described as 'undirected acyclic,' but distribution networks can contain loops and the method does not enforce acyclicity. Please rephrase or justify this assumption.
- [Table 6] The sensitivity analysis for the scaling factor reports point estimates without standard deviations or trial information; please include the same repeated-trial statistics used in Tables 3 and 5.
- [Figure 6 and Section 5.3] The comparison with the global power-system dataset of [3] is qualitative. Please add quantitative overlap statistics (for example, percentage of PGRID grid cells that fall outside the prior low-voltage coverage) and clarify that [3] is at 250m resolution, so cell-level disagreement does not imply a mapping error.
- [Section 5.1, Table 2] The text notes that PGRID 'performs comparably' to GridTracer-UNet on the line-segmentation benchmark, but on the three-region mean both methods achieve mIOU 0.41; the sentence should state the lack of improvement explicitly so the reader is not misled.
Circularity Check
Partial circularity: pole-matching threshold and line-buffer tolerance are fitted to the test set before computing the headline F1s, though the detection models are trained on geographically separate data.
-
fitted input called prediction
[Section 7.4 and Table 3 (pole detection evaluation)]
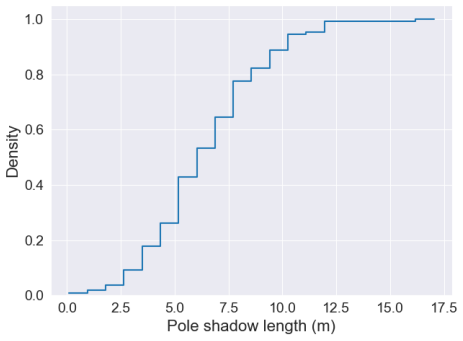
"we randomly sample 100 poles from the test set and measure the shadow lengths cast by the poles. ... 90% cast a shadow of 10 meters or less. ... Thus at a distance threshold of 10m, even using the strict one-to-one match, we observe improved performance for both ResNet backbones over a 5m and 7m."
The distance threshold th defines true positives in the pole F1 computation. The paper selects th=10m from the distribution of pole shadow lengths in the same Kalobeyei test set on which Table 3 reports the headline pole F1 (0.71 in the best cell). Because the tolerance is chosen to accommodate the centroid offsets observed in that test set, the reported F1 is partly a fit to the test set rather than an independent accuracy estimate; the metric improves by construction as th grows, and 10m was selected because it captures 90% of sampled test poles.
-
fitted input called prediction
[Section 3.2 and Table 5 (line segmentation evaluation)]
"Buffering is done because the ground truth test labels weakly align with visible electrical lines in the imagery as opposed to training labels that are highly aligned with visible electrical lines in the image. ... We observe that ground truth labels in the test set have an offset of ∼2m from visible electrical lines within the imagery."
The line F1 (headline 0.82) is computed after applying a 2m buffer to predictions, and the buffer size is set to the measured ~2m offset of the very test labels used in that F1. The evaluation thus relaxes the alignment requirement to match the test-set label error, so the detection F1 is a tolerance-adjusted score rather than an independent measure of line localization. This is a test-set-fitted evaluation parameter rather than a circular derivation of the grid itself, but it inflates the headline number.
full rationale
PGRID's claimed derivation is an empirical ML pipeline (point-supervised FCN8 for poles, patch-wise DeepLabV3 for lines, vectorized overlay), not a closed-form derivation, so there is no equation-level reduction. The central generalization claim has independent content: models are trained on Kakuma and tested on geographically distinct Kalobeyei (Section 4), and the same architectures are benchmarked on GridTracer's fixed test split (Section 5.1) with no load-bearing self-citation. The two flagged steps are evaluation-tolerance fits: th=10m is selected from the test-set pole shadow distribution (Section 7.4) and the 2m line buffer is set to the measured test-label offset (Section 3.2); both are then used to compute the headline F1s (0.71 pole, 0.82 line), making those metrics partly a function of test-set-derived tolerances. Additionally, the paper admits the model predicts visible lines, not pole-to-pole connectivity, and that no post-processing connects lines to poles (Sections 2 and 5.2), so the 'grid map' is an overlay of detections; that is a validity limitation, not a circular derivation, because the output detections are not defined in terms of the evaluation labels. Overall score 4 reflects partial circularity in the evaluation protocol while the underlying detection approach retains independent benchmark support.
Assumptions & free parameters
free parameters (3)
- scaling factor sf =
4
- distance threshold th =
10m
- line evaluation buffer =
2m
assumptions (6)
- domain assumption High-resolution drone imagery, ~6 cm/pixel, is sufficient to visually resolve electrical poles and distribution lines.
- domain assumption OSM and HOT mapper annotations, after manual realignment, are accurate enough to serve as ground truth for training and evaluation.
- domain assumption Electrical poles are spaced far enough apart that a 10m matching threshold will not create spurious pole matches.
- domain assumption The distribution grid can be modeled as an undirected acyclic graph.
- domain assumption The visual appearance of poles and lines in Kakuma Camp is similar enough to Kalobeyei Camp for the trained models to transfer.
- domain assumption Visible lines in the imagery are a sufficient signal for line segmentation; the model does not need to infer connections between poles.
Cite this review
Pith. "Pith review of PGRID: Power Grid Reconstruction in Informal Developments Using High-Resolution Aerial Imagery." pith.science (2026). https://pith.science/paper/MGSQOO5N
@misc{pith2026241207944,
  author       = {Pith},
  title        = {Pith review of: PGRID: Power Grid Reconstruction in Informal Developments Using High-Resolution Aerial Imagery},
  year         = {2026},
  howpublished = {\url{https://pith.science/paper/MGSQOO5N}},
  note         = {Machine review of arXiv:2412.07944}
}
read the original abstract
As of 2023, a record 117 million people have been displaced worldwide, more than double the number from a decade ago [22]. Of these, 32 million are refugees under the UNHCR mandate, with 8.7 million residing in refugee camps. A critical issue faced by these populations is the lack of access to electricity, with 80% of the 8.7 million refugees and displaced persons in camps globally relying on traditional biomass for cooking and lacking reliable power for essential tasks such as cooking and charging phones. Often, the burden of collecting firewood falls on women and children, who frequently travel up to 20 kilometers into dangerous areas, increasing their vulnerability.[7] Electricity access could significantly alleviate these challenges, but a major obstacle is the lack of accurate power grid infrastructure maps, particularly in resource-constrained environments like refugee camps, needed for energy access planning. Existing power grid maps are often outdated, incomplete, or dependent on costly, complex technologies, limiting their practicality. To address this issue, PGRID is a novel application-based approach, which utilizes high-resolution aerial imagery to detect electrical poles and segment electrical lines, creating precise power grid maps. PGRID was tested in the Turkana region of Kenya, specifically the Kakuma and Kalobeyei Camps, covering 84 km2 and housing over 200,000 residents. Our findings show that PGRID delivers high-fidelity power grid maps especially in unplanned settlements, with F1-scores of 0.71 and 0.82 for pole detection and line segmentation, respectively. This study highlights a practical application for leveraging open data and limited labels to improve power grid mapping in unplanned settlements, where the growing number of displaced persons urgently need sustainable energy infrastructure solutions.
Figures


Figures from the paper (6 more)


Reference graph
Works this paper leans on
-
[1]
Ttpla: An aerial-image dataset for detection and segmentation of transmission towers and power lines
Rabab Abdelfattah, Xiaofeng Wang, and Song Wang. Ttpla: An aerial-image dataset for detection and segmentation of transmission towers and power lines. In Proceedings of the Asian Conference on Computer Vision, 2020
2020
-
[2]
Duformer: Solving power line detection task in aerial images using semantic segmen- tation
Deyu An, Qiang Zhang, Jianshu Chao, Ting Li, Feng Qiao, Zhenpeng Bian, and Yong Deng. Duformer: Solving power line detection task in aerial images using semantic segmen- tation. In Chinese Conference on Pattern Recognition and Computer Vision (PRCV), pages 54–66. Springer, 2023
work page 2023
-
[3]
Predictive mapping of the global power system using open data
Christopher Arderne, Conrad Zorn, Claire Nicolas, and EE Koks. Predictive mapping of the global power system using open data. Scientific data, 7(1):19, 2020
work page 2020
-
[4]
Improved road connectivity by joint learning of orientation and segmentation
Anil Batra, Suriya Singh, Guan Pang, Saikat Basu, CV Jawa- har, and Manohar Paluri. Improved road connectivity by joint learning of orientation and segmentation. In Proceedings of the IEEE/CVF Conference on Computer Vision and Pattern Recognition, pages 10385–10393, 2019
work page 2019
-
[5]
What’s the point: Semantic segmentation with point supervision
Amy Bearman, Olga Russakovsky, Vittorio Ferrari, and Li Fei-Fei. What’s the point: Semantic segmentation with point supervision. In European conference on computer vision , pages 549–565. Springer, 2016
work page 2016
-
[6]
The morphological ap- proach to segmentation: the watershed transformation
Serge Beucher and Fernand Meyer. The morphological ap- proach to segmentation: the watershed transformation. In Mathematical morphology in image processing, pages 433–
-
[7]
Importance Of Green Energy and Solar Panels for Camps
Bonyan Organization. Importance Of Green Energy and Solar Panels for Camps. https : / / bonyan . ngo / displaced- and- refugees/solar- panels- in- refugee - camps / # :˜ : text = (80 % 25 ) %20of % 20the % 208 . 7 , have % 20no % 20access % 20to % 20electricity., 2024
work page 2024
-
[8]
Rethinking atrous convolution for seman- tic image segmentation
Liang-Chieh Chen, George Papandreou, Florian Schroff, and Hartwig Adam. Rethinking atrous convolution for seman- tic image segmentation. arXiv preprint arXiv:1706.05587 , 2017
arXiv 2017
Show all 24 references
-
[9]
Machine learning using satellite images and map features
Development Seed. Machine learning using satellite images and map features. http://devseed.com/ml-grid- detection/, 2017
2017
-
[10]
Mapping the electric grid: Using ML to augment human tracing of HV infrastructure
Development Seed. Mapping the electric grid: Using ML to augment human tracing of HV infrastructure. https: //devseed.com/ml-grid-docs/, 2018
2018
-
[11]
A new predictive model for more accurate electrical grid mapping
Dimitry Gershenson, Brandon Rohrer and Anna Lerner. A new predictive model for more accurate electrical grid mapping. https : / / engineering . fb . com / 2019/01/25/connectivity/electrical-grid- mapping/, 2019
2019
-
[12]
A scalable framework to measure the impact of spa- tial heterogeneity on electrification
Simone Fobi, Ayse Selin Kocaman, Jay Taneja, and Vijay Modi. A scalable framework to measure the impact of spa- tial heterogeneity on electrification. Energy for Sustainable Development, 60:67–81, 2021
2021
-
[13]
Gridtracer: Automatic mapping of power grids using deep learning and overhead imagery
Bohao Huang, Jichen Yang, Artem Streltsov, Kyle Brad- bury, Leslie M Collins, and Jordan M Malof. Gridtracer: Automatic mapping of power grids using deep learning and overhead imagery. IEEE Journal of Selected Topics in Ap- plied Earth Observations and Remote Sensing , 15:4956...
2021
-
[14]
Where are the blobs: Counting by localization with point supervision
Issam H Laradji, Negar Rostamzadeh, Pedro O Pinheiro, David Vazquez, and Mark Schmidt. Where are the blobs: Counting by localization with point supervision. In Pro- ceedings of the European Conference on Computer Vision (ECCV), pages 547–562, 2018
2018
-
[15]
Fully convolutional networks for semantic segmentation
Jonathan Long, Evan Shelhamer, and Trevor Darrell. Fully convolutional networks for semantic segmentation. In Pro- ceedings of the IEEE conference on computer vision and pat- tern recognition, pages 3431–3440, 2015
2015
-
[16]
Smart meter data analytics for distribu- tion network connectivity verification
Wenpeng Luan, Joshua Peng, Mirjana Maras, Joyce Lo, and Brian Harapnuk. Smart meter data analytics for distribu- tion network connectivity verification. IEEE Transactions on Smart Grid, 6(4):1964–1971, 2015
1964
-
[17]
The Modern Energy Minimum: The case for a new global electricity consumption thresh- old
Todd Moss, Morgan Bazalian, Moussa Blimpo, Lau- ren Culver, Meera Mahadavan Jacob Kincer, Vijay Modi, Bob Muhwezi, Rose Mutiso, Varun Sivaram, Jay Taneja, Mark Thurber, Johannes Urpelainen, and Michael Webber. The Modern Energy Minimum: The case for a new global electricity co...
2021
-
[18]
Faster r-cnn: Towards real-time object detection with region proposal networks
Shaoqing Ren, Kaiming He, Ross Girshick, and Jian Sun. Faster r-cnn: Towards real-time object detection with region proposal networks. IEEE transactions on pattern analysis and machine intelligence, 39(6):1137–1149, 2016
2016
-
[19]
Fine-grained distribution grid mapping using street view imagery
Qinghu Tang, Zhecheng Wang, Arun Majumdar, and Ram Rajagopal. Fine-grained distribution grid mapping using street view imagery. In Proceedings of the 33rd Conference on Neural Information Processing Systems (NeurIPS 2019), Vancouver, BC, Canada, pages 8–14, 2019
2019
-
[20]
Kenya - Kenya Electricity Network
The World Bank Group. Kenya - Kenya Electricity Network. https : / / energydata . info / dataset / kenya - kenya-electricity-network, 2024
2024
-
[21]
Refugees and Asylum-seekers in Turkana
UNHCR. Refugees and Asylum-seekers in Turkana. https://data.unhcr.org/en/country/ken/ 796, 2024
2024
-
[22]
Global Trends Re- port 2023
UNHCR The UN Refugee Agency. Global Trends Re- port 2023. https : / / www . unhcr . org / global - trends-report-2023, 2024
2023
-
[23]
Refugee Camps Explained
UNHCR The UN Refugee Agency. Refugee Camps Explained. https : / / www . unrefugees . org / news / refugee - camps - explained / #Howmanyrefugeesliveinrefugeecamps?, 2024
2024
-
[24]
Electrical pole detection illustration We deploy a Fully Convolutional Network (FCN8) se- mantic segmentation model to detect poles within the im- age
Supplementary Material 7.1. Electrical pole detection illustration We deploy a Fully Convolutional Network (FCN8) se- mantic segmentation model to detect poles within the im- age. Figure 7 illustrated the point supervision method used to train the pole detection model. A mask ...
Reviewed August 11, 2026 · model on record in the stance chip above.
Discussion (0). Continue with ORCID to comment.