REVIEW 4 major objections 6 minor 21 references
From Votes to Volatility Predicting the Stock Market on Election Day
T0 review · 4 major / 6 minor · reviewed 2026-08-11 · deepseek-v4-flash
Pith's one-line read The paper claims that adding LLM-generated political features—candidate impact scores and candidate context—to the StockMixer architecture improves S&P 500 return predictions on the 2024 U.S.
desk verdict Election-day forecast paper with a nice LLM-agent idea, but the evaluation is broken by test-set fitting and lookahead; the predictive claim doesn't survive. read the letter →
The pith
A machine-rendered reading of the paper's core claim, the machinery that carries it, and where it could break.
The reading
What carries the argument
The machinery is a small set of extra input features rather than a new network. For each candidate $c$, the sector-impact table from the LLM agents produces $candidate\_impact_{c,i,t} = \sum_{s=1}^{S} I_{c,s} I_{s,i}$, a score of $+1$ or $-1$ for stock $i$ depending on whether its sector is helped or hurt by that candidate. A second feature, $candidate\_context$, labels each minute as belonging to Candidate 1 or 2; training uses two models with fixed contexts, and testing blends them as $prediction_{ensemble,t} = w_1 prediction_{A,t} + w_2 prediction_{B,t}$, with weights such as $w_1 = 0.2$, $w_2 = 0.8$. The loss combines a mean-squared-error term with a pairwise ranking penalty so the model is rewarded both for accurate return ratios and for keeping top-ranked stocks in the right order.
What would settle it
Recompute the 2024-11-06 evaluation under a strict walk-forward protocol: political features built only from news dated before each minute, ensemble weights chosen on validation alone, and multiple random seeds; if the best ensemble's RIC no longer exceeds StockMixer's 0.2290, or the margin reverses, the reported improvement is not established.
Extended reading notes
Core claim
The central discovery, stated on the paper's own terms, is that political signals derived from a four-agent LLM framework can be turned into numerical input features that improve forecasting on election day. The agent framework produces a sector-level table of which candidate helps or hurts each industry; this table is encoded as candidate_impact_1 and candidate_impact_2 scores for every stock, and a candidate_context label marks each data point. By extending StockMixer with these extra columns and training two candidate-specific models that are blended with weights such as 20% and 80%, the authors report the best ensemble reaches RIC 0.2306 and SR 1.8163, while the StockMixer baseline reaches RIC 0.2290 and SR 1.7704. The paper presents this as the first combination of StockMixer with a political-awareness approach and frames the improvement as evidence that tailoring forecasting architectures to high-volatility election regimes is worthwhile.
Load-bearing premise
The load-bearing premise is that the political signals and the ensemble weights carry no information from the post-election test day itself, so that news and prices from 2024-11-06 did not leak into the features or model selection.
Editorial extensions
If this is right
- If the claim holds, scenario-specific political features can be added to an existing MLP-based forecaster as three extra columns, so election-day forecasting does not require a new architecture.
- The reported margins suggest that political signals help most on rank-based selection, measured by RIC, and on risk-adjusted returns, measured by Sharpe Ratio, while the pointwise correlation IC improves only modestly.
- Because the sector impact table is the only political input, the same approach can be rebuilt for another election by replacing the LLM agents' sector analysis.
- The single-day test means the claim is about the election-day regime, not about general market forecasting.
- The ensemble weighting scheme implies that once the winner is known, giving more weight to the model trained under the winning candidate's context is the configuration that performs best on the test day.
Reading between the lines
- A natural generalization would be to apply the same candidate-impact construction to the 2020 U.S. election and to elections in other countries, to see whether the political-signal edge is specific to the 2024 race or general to election-day regimes.
- A control experiment would rebuild the political features using only news articles timestamped before each test minute; if the reported gain survives this timing restriction, the mechanism is genuine rather than lookahead-driven.
- The same per-sector impact mapping could be transferred to other scheduled macro events, such as central-bank rate decisions, where sector-level expectations are also well defined before the announcement.
- The gains are small relative to metric fluctuation on a one-day test window, so averaging over several election-day periods would give a sharper estimate of the true effect size.
Signed reviews
Editorial analysis
A structured set of objections, weighed in public.
Referee Report
Summary. The paper proposes EDSMF, an extension of the StockMixer architecture that adds political features generated by an LLM-driven multi-agent pipeline, and applies it to one-minute S&P 500 data around the 2024 U.S. presidential election. The central claim, stated in the abstract and conclusion, is that EDSMF improves predictive performance on election day over the StockMixer baseline. Evidence is presented in Table 2, where four ensemble weighting configurations are compared with a random-assignment variant and the baseline on IC, RIC, Prec@10, and Sharpe Ratio. The paper also includes an ablation discussion and a promise of publicly available code.
Significance. If the claimed improvement were established, the paper would offer a concrete example of scenario-specific political conditioning for high-frequency stock forecasting, and the LLM-agent feature-generation pipeline would be of practical interest. The authors deserve credit for making code available, for reporting multiple runs, and for including an ablation-style comparison of ensemble weightings. However, the central result is not statistically or methodologically supported: the ensemble weights are selected on the test set, the political features are constructed with information that includes the test day and the actual winner, and the reported differences from baseline are tiny and unaccompanied by significance tests or confidence intervals. As presented, the paper does not demonstrate that EDSMF improves election-day prediction.
major comments (4)
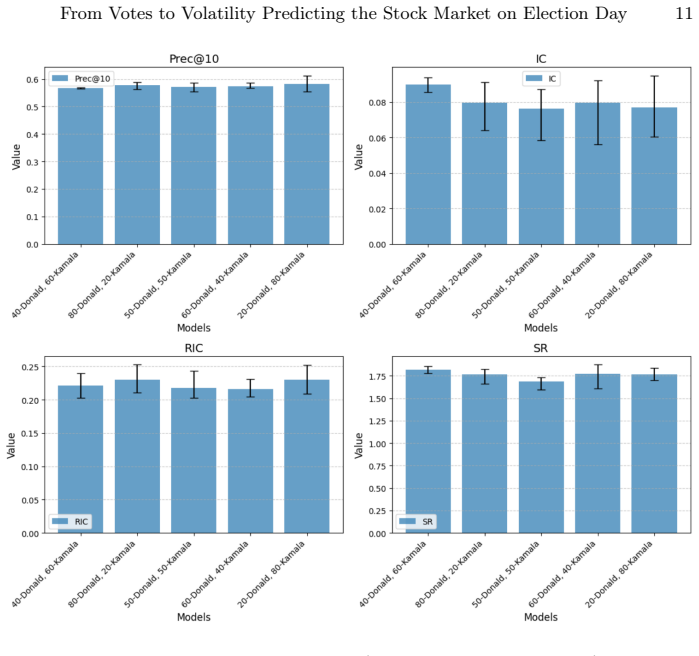
- [§4.2, Table 2] The ensemble weights are selected by evaluating all four configurations on the test set and then reporting the configuration that maximizes each metric. This makes the reported best values fitted maxima over four comparisons, not ex ante forecasts. With a best RIC of 0.2306 versus the baseline 0.2290, a best SR of 1.8163 versus 1.7704, and IC and Prec@10 both fluctuating around the baseline, the differences are not distinguishable from noise, particularly without confidence intervals or multiple-comparison correction. The paper should either pre-commit to ensemble weights before seeing the test set, use a nested validation procedure, or report uncertainty intervals and a proper significance test for all configurations.
- [§3.1 and §3.2, Algorithm 1] The political features contain lookahead information. The news corpus is described as running from 2024-01-01 to 2024-11-06, which includes the test date itself, and Algorithm 1 assigns candidate_context = 1 during the test phase because Candidate 1 is the actual winner. A genuine election-day forecast made before the outcome is known cannot condition on the winner or on post-election news. This breaks the causal attribution of any improvement to political awareness. The features should be rebuilt using only information available at each prediction timestamp (for example, news through the prior day and no knowledge of the winner), and the evaluation should be separated into pre-outcome and post-outcome periods.
- [§4.1] The setup states that samples are generated by sliding a 16-day lookback window over minute-level data, yet the dataset spans only 2024-10-30 to 2024-11-06, which is six trading days. A 16-day lookback is impossible unless the data actually extend earlier, in which case the dataset description is incomplete. This inconsistency undermines reproducibility and suggests that the pipeline description does not match the implemented experiment.
- [§4.2] No error bars, confidence intervals, or significance tests are provided for any of the metrics in Table 2. The statement that each model was trained at least three times and the lowest-loss checkpoint was selected does not address run-to-run variance, which in financial forecasting is typically substantial. Without distributional information, the reported improvements over baseline cannot be considered evidence of a real effect.
minor comments (6)
- [§2.2, Eq. (1)] Equation (1) defines the return ratio using p_t as the predicted closing price, but the return ratio should be computed from actual prices with the prediction compared against it. Please clarify the notation so that the target value is unambiguous.
- [§2.3] The descriptions of 'high' and 'low' refer to the 'trading day,' while the data are one-minute bars. Please specify whether these are the daily high and low or the minute-bar high and low.
- [§1.2, References] Reference [14] is never cited in the text; the LSTM-RGCN discussion points to [15], and the citation sequence skips [14]. Please reconcile the reference list.
- [§3.2] The ensemble strategy is described as 'consistent' for the test phase, but the two models receive candidate_context = 1 for both models at test time (Eq. (8)), so the ensemble at test time does not actually distinguish candidate contexts. Please clarify what the two models are contributing during testing.
- [§3.1, Table 1] The sector impact table assigns a binary +1/−1 to every sector for each candidate without any explanation of how these values were derived beyond the LLM agents. Please provide the prompts, the LLM version, and the conversion from qualitative outputs to these numerical signs so that the feature construction is reproducible.
- [Abstract] The abstract writes 'SP500' where the standard form is 'S&P 500'; please correct this typo.
Circularity Check
The central election-day improvement is the maximum of four test-set-selected ensemble weightings, and the political input features include the predicted day's outcome, so the Table 2 gains are partially circular.
-
fitted input called prediction
[Section 4.2, Table 2]
"Table 2 presents a comparison of the best ensemble configurations for each metric, alongside the baseline model (StockMixer) and a random assignment strategy. The model configuration '20-Candidate-1, 80-Candidate-2' achieved the highest RIC (0.2306) and competitive performance across other metrics. The '40-Candidate-1, 60-Candidate-2' configuration excelled in Sharpe Ratio (1.8163) and IC (0.0898), demonstrating the robustness of ensemble strategies in capturing candidate-specific influences."
The 'best ensemble configurations' are selected by ranking the four weight configurations on the test-period metrics shown in Table 2. The paper does not select weights on validation data; it reports the per-metric maximum over the test set. Therefore the reported RIC (0.2306) and SR (1.8163) improvements over StockMixer are the maximum of four test-set evaluations, i.e., the ensemble weights are parameters fitted to the test labels. Claiming that EDSMF improves performance because the best of four tested weightings beats the baseline is selection, not prediction, and no multiple-comparison correction or confidence interval is provided.
-
other
[Sections 3.1, 3.2 and 4.1 (Algorithm 1, Equation 8)]
"To create the political signals, we analyzed over 90,000 news articles from various U.S. news sources, published between 2024-01-01 and 2024-11-06, providing a comprehensive overview of the policies and campaign dynamics of the candidates. ... During testing, the candidate context is consistently set to the actual winner of the election (Candidate 1). For both models, the candidate context is defined as: candidate_contextt = 1, ∀t ∈ test period."
The test split is 2024-11-06 (Section 4.1), which is also the final date of the news corpus used to build the political signals, and candidate_context is set to the actual election winner for every test row. Since candidate_context and candidate_impact are input features in Equation (12), the model receives information that was not available when the predicted next-minute return would have been forecast. The political-signal improvement is therefore at least partly due to the input encoding the outcome being predicted. This is target leakage, making the claimed causal role of political awareness self-referential.
full rationale
The claimed election-day improvement is not a self-contained out-of-sample result. In Section 4.2 the paper selects for each metric the best of four ensemble weightings evaluated on the test day and reports those maxima against the StockMixer baseline; this is test-set model selection, so the reported RIC 0.2306 and SR 1.8163 are fitted maxima rather than forecasts. Independently, the political features are constructed from news through 2024-11-06 and candidate_context is set to the actual winner throughout the test period, while the test period is 2024-11-06, so the input features encode the outcome being predicted. There is no self-citation chain: StockMixer is an external baseline and the LLM-agent framework is original, which is why the score is not higher. Nonetheless, either issue alone breaks the causal attribution of the Table 2 gains to political awareness; taken together they make the central claim partially circular.
Assumptions & free parameters
free parameters (4)
- Ensemble weights w1, w2 =
w1=0.2, w2=0.8 (default); best configurations vary by metric
- Sector impact signs Ic,s =
Table 1: Candidate 1 positive for 8 sectors, negative for 3; Candidate 2 opposite
- EMA period n =
45 minutes
- Loss weighting alpha =
0.1
assumptions (4)
- domain assumption The minute-level price data for S&P 500 are accurate and survivorship-free.
- ad hoc to paper Random assignment of candidate_context during training yields a model that generalizes to the real election outcome.
- domain assumption The sector impact table (Table 1) captures the true economic sensitivity of each sector to each candidate.
- ad hoc to paper A 16-day lookback window is available given the dataset.
Cite this review
Pith. "Pith review of From Votes to Volatility Predicting the Stock Market on Election Day." pith.science (2026). https://pith.science/paper/3RD4W3NN
@misc{pith2026241211192,
  author       = {Pith},
  title        = {Pith review of: From Votes to Volatility Predicting the Stock Market on Election Day},
  year         = {2026},
  howpublished = {\url{https://pith.science/paper/3RD4W3NN}},
  note         = {Machine review of arXiv:2412.11192}
}
read the original abstract
Stock market forecasting has been a topic of extensive research, aiming to provide investors with optimal stock recommendations for higher returns. In recent years, this field has gained even more attention due to the widespread adoption of deep learning models. While these models have achieved impressive accuracy in predicting stock behavior, tailoring them to specific scenarios has become increasingly important. Election Day represents one such critical scenario, characterized by intensified market volatility, as the winning candidate's policies significantly impact various economic sectors and companies. To address this challenge, we propose the Election Day Stock Market Forecasting (EDSMF) Model. Our approach leverages the contextual capabilities of large language models alongside specialized agents designed to analyze the political and economic consequences of elections. By building on a state-of-the-art architecture, we demonstrate that EDSMF improves the predictive performance of the S&P 500 during this uniquely volatile day.
Figures
Reference graph
Works this paper leans on
-
[1]
Financial Analysts Journal26(2),111–113(1970)
Niederhoffer, V., Gibbs, S., Bullock, J.: Presidential elections and the stock market. Financial Analysts Journal26(2),111–113(1970). http://www.jstor.org/stable/ 4470664
work page 1970
-
[2]
P.: Stock market volatil- ity around national elections
Białkowski, J., Gottschalk, K., Wisniewski, T. P.: Stock market volatil- ity around national elections. Journal of Banking & Finance 32(9), 1941– 1953 (2008). https://doi.org/10.1016/j.jbankfin.2007.12.021. https://www. sciencedirect.com/science/article/pii/S0378426607004219
-
[3]
Allvine, F. C., O’Neill, D. E.: Stock market returns and the presidential election cycle: Implications for market efficiency. Financial Analysts Journal 36(5), 49– 56 (1980).https://doi.org/10.2469/faj.v36.n5.49. https://doi.org/10.2469/ faj.v36.n5.49
-
[4]
The Journal of Finance7(1),77–91(1952)
Markowitz,H.:Portfolioselection. The Journal of Finance7(1),77–91(1952). http: //www.jstor.org/stable/2975974
arXiv 1952
-
[5]
The Journal of Economic Perspectives 18(3), 3–24 (2004).http://www.jstor.org/stable/3216804
Perold,A.F.:Thecapitalassetpricingmodel. The Journal of Economic Perspectives 18(3), 3–24 (2004).http://www.jstor.org/stable/3216804
-
[6]
Journal of Time Series Analysis 11(2), 153–164 (1990)
Piccolo, D.: A distance measure for classifying ARIMA models. Journal of Time Series Analysis 11(2), 153–164 (1990). https://doi.org/10.1111/ j.1467-9892.1990.tb00048.x. https://onlinelibrary.wiley.com/doi/abs/10. 1111/j.1467-9892.1990.tb00048.x From Votes to Volatility Predicting the Stock Market on Election Day 13
arXiv 1990
-
[7]
Jour- nal of Econometrics 31(3), 307–327 (1986)
Bollerslev, T.: Generalized autoregressive conditional heteroskedasticity. Jour- nal of Econometrics 31(3), 307–327 (1986). https://doi.org/10.1016/ 0304-4076(86)90063-1. https://www.sciencedirect.com/science/article/ pii/0304407686900631
arXiv 1986
-
[8]
https://wires.onlinelibrary.wiley.com/doi/ abs/10.1002/wics.1314
Kroese,D.P.,Brereton,T.,Taimre,T.,Botev,Z.I.:WhytheMonteCarlomethodis so important today.WIREs Computational Statistics6(6), 386–392 (2014).https: //doi.org/10.1002/wics.1314. https://wires.onlinelibrary.wiley.com/doi/ abs/10.1002/wics.1314
Show all 21 references
-
[9]
A., Dumais, S
Hearst, M. A., Dumais, S. T., Osuna, E., Platt, J., Scholkopf, B.: Support vector machines. IEEE Intelligent Systems and their Applications 13(4), 18–28 (1998). https://doi.org/10.1109/5254.708428
1998
-
[10]
E.: K-nearest neighbor.Scholarpedia 4(2), 1883 (2009).https://doi
Peterson, L. E.: K-nearest neighbor.Scholarpedia 4(2), 1883 (2009).https://doi. org/10.4249/scholarpedia.1883
2009 doi
-
[11]
In:Proceed- ings of the 22nd ACM SIGKDD International Conference on Knowledge Discovery and Data Mining, pp
Chen, T., Guestrin, C.: XGBoost: A scalable tree boosting system. In:Proceed- ings of the 22nd ACM SIGKDD International Conference on Knowledge Discovery and Data Mining, pp. 785–794. ACM, 2016.https://doi.org/10.1145/2939672. 2939785. http://dx.doi.org/10.1145/2939672.2939785
2016
-
[12]
V., Gulin, A.: CatBoost: unbiasedboostingwithcategoricalfeatures.arXivpreprintarXiv:1706.09516(2019)
Prokhorenkova, L., Gusev, G., Vorobev, A., Dorogush, A. V., Gulin, A.: CatBoost: unbiasedboostingwithcategoricalfeatures.arXivpreprintarXiv:1706.09516(2019). https://arxiv.org/abs/1706.09516
2019 arXiv
-
[13]
In: Supervised Sequence Labelling with Recurrent Neural Networks , pp
Graves, A.: Long short-term memory. In: Supervised Sequence Labelling with Recurrent Neural Networks , pp. 37–45. Springer, Berlin, Heidelberg (2012). https://doi.org/10.1007/978-3-642-24797-2_4 . https://doi.org/10. 1007/978-3-642-24797-2_4
2012 doi
-
[14]
https://doi.org/10.1016/j.ejor.2017.11.054
Fischer, T., Krauss, C.: Deep learning with long short-term memory networks for financial market predictions.European Journal of Operational Research270(2), 654–669 (2018). https://doi.org/10.1016/j.ejor.2017.11.054. https://www. sciencedirect.com/science/article/pii/S0377221717310652
2018 doi
-
[15]
In:Proceedings of the Twenty-Ninth International Conference on International Joint Conferences on Artificial Intelligence, pp
Li, W., Bao, R., Harimoto, K., Chen, D., Xu, J., Su, Q.: Modeling the stock relation with graph network for overnight stock movement prediction. In:Proceedings of the Twenty-Ninth International Conference on International Joint Conferences on Artificial Intelligence, pp. 4541–...
2021
-
[16]
R.: Stock selec- tion via spatiotemporal hypergraph attention network: A learning to rank ap- proach
Sawhney, R., Agarwal, S., Wadhwa, A., Derr, T., Shah, R. R.: Stock selec- tion via spatiotemporal hypergraph attention network: A learning to rank ap- proach. Proceedings of the AAAI Conference on Artificial Intelligence35(1), 497– 504 (2021). https://doi.org/10.1609/aaai.v35i...
2021 doi
-
[17]
T., Nguyen, M
Huynh, T. T., Nguyen, M. H., Nguyen, T. T., Nguyen, P. L., Weidlich, M., Nguyen, Q. V. H., Aberer, K.: Efficient integration of multi-order dynamics and internal dynamics in stock movement prediction. arXiv preprint arXiv:2211.07400 (2022). https://arxiv.org/abs/2211.07400
2022 arXiv
-
[18]
Proceedings of the AAAI Conference on Artificial Intel- ligence 38(8), 8389–8397 (2024)
Fan, J., Shen, Y.: StockMixer: A simple yet strong MLP-based architecture for stock price forecasting. Proceedings of the AAAI Conference on Artificial Intel- ligence 38(8), 8389–8397 (2024). https://doi.org/10.1609/aaai.v38i8.28681. https://ojs.aaai.org/index.php/AAAI/article...
2024 doi
-
[19]
ACM Transactions on Information Systems 37(2), 1–30 (2019)
Feng, F., He, X., Wang, X., Luo, C., Liu, Y., Chua, T.-S.: Temporal relational ranking for stock prediction. ACM Transactions on Information Systems 37(2), 1–30 (2019). https://doi.org/10.1145/3309547. http://dx.doi.org/10.1145/ 3309547 14 F. Author et al
2019 doi
-
[20]
arXiv preprint arXiv:2110.13716 (2022).https://arxiv.org/abs/2110
Xu, W., Liu, W., Wang, L., Xia, Y., Bian, J., Yin, J., Liu, T.-Y.: HIST: A graph- based framework for stock trend forecasting via mining concept-oriented shared in- formation. arXiv preprint arXiv:2110.13716 (2022).https://arxiv.org/abs/2110. 13716
2022 arXiv
-
[21]
H., Jeong, M., Lee, S., Kim, J., Kang, J.: HATS: A hier- archical graph attention network for stock movement prediction
Kim, R., So, C. H., Jeong, M., Lee, S., Kim, J., Kang, J.: HATS: A hier- archical graph attention network for stock movement prediction. arXiv preprint arXiv:1908.07999 (2019). https://arxiv.org/abs/1908.07999
2019 arXiv
Reviewed August 11, 2026 · model on record in the stance chip above.
Discussion (0). Continue with ORCID to comment.