REVIEW 4 major objections 4 minor 28 references
Stochastic Model for a Piezoelectric Energy Harvester Driven by Broadband Vibrations
T0 review · 4 major / 4 minor · reviewed 2026-08-11 · deepseek-v4-flash
Pith's one-line read A Langevin model with a two-parameter diode bridge reproduces power-versus-load curves of a piezoelectric harvester; high-order correlations of one voltage reveal temporal asymmetry in the nonlinear setup.
desk verdict A competent incremental extension of the same group's Langevin model to rectified loads; the power-vs-R agreement is real but rests on two never-calibrated diode parameters, so the validation claim needs a caveat. read the letter →
The pith
A machine-rendered reading of the paper's core claim, the machinery that carries it, and where it could break.
The reading
What carries the argument
The load-bearing object is the coupled system of stochastic differential equations (1)–(6): an underdamped Langevin equation for the tip-mass displacement and velocity, an electromechanical coupling term $\theta v_p$ feeding the mechanical dynamics back into the electrical side, and a load equation whose current-voltage characteristic $f(v_p)$ is the only part that changes between configurations. For the linear load $f(v_p)=v_p/R$, the model is Gaussian and exactly solvable, giving the analytic power formula (7) used for parameter calibration. For the diode-bridge rectifier, $f(v_p)$ takes the effective form in Eq. (6) with two constants $I_{k0}$ and $G$, which the paper treats as the entire description of the nonlinear load. The second main tool is the set of connected three- and four-point correlation functions $C^{(3)}_{v_{\rm DC}}(t)$ and $C^{(4)}_{v_{\rm DC}}(t)$ defined in Eqs. (9)–(10); their asymmetry under time reversal is the diagnostic that reveals non-equilibrium dynamics from a single measured time series.
What would settle it
Repeat the experiment at an acceleration not used in calibration (for instance 0.9 g) or with a different storage capacitor, and test whether the numerical model with the same $I_{k0}$ and $G$ still reproduces the measured power-versus-resistance curve; if the predicted optimal resistance or peak power moves away from the data, the effective parameters are specific to the fitted conditions rather than predictive.
Extended reading notes
Core claim
The central claim is that the stochastic model of Eqs. (1)–(6) is a valid minimal description for this harvester in both load configurations. In the linear case the model is exactly solvable and yields a closed formula for the extracted power, $P_{\rm harv}^{(I)} = \frac{D_0 M^2 R\theta^2}{M(\gamma+R\theta^2)+C_p R\gamma(C_p K_s R+\gamma+R\theta^2)}$, whose parameters are fitted to one acceleration value and then successfully describe a second one. For the nonlinear diode-bridge configuration, the paper proposes a simplified two-parameter effective model of the rectifier, $I_{k0} = 9 \times 10^{-9}$ A and $G = -133 \times 10^{-11}\,\Omega^{-1}$, and numerical simulations of the same Langevin equations reproduce the experimentally measured average voltage and extracted power over the whole tested range of load resistances. The power curve is non-monotonic with a maximum near $30$ k$\Omega$, which is the optimal load for this rectifier circuit. The same data analysis shows that connected three- and four-point correlation functions of the single measured voltage $v_{\rm DC}$ are not symmetric under time reversal, revealing the non-equilibrium nature of the dynamics in the nonlinear configuration.
Load-bearing premise
The nonlinear power comparison depends on treating the diode bridge as two constant effective parameters, $I_{k0}=9\times10^{-9}$ A and $G=-133\times10^{-11}\,\Omega^{-1}$, valid for every load resistance and both acceleration levels, even though the paper does not disclose how those values were obtained.
Editorial extensions
If this is right
- For the linear resistive load, the optimal resistance is independent of the forcing acceleration, so one load value serves a range of vibration levels.
- The same fitted mechanical parameters describe both tested accelerations, indicating that calibrating the model on one condition may transfer to other driving intensities.
- The two-parameter diode model is enough to locate the optimal load of the rectifier circuit, which makes the model usable for designing the AC/DC stage without simulating the full diode bridge.
- In the nonlinear configuration, a single measured voltage time series is sufficient to expose time-reversal asymmetry through high-order correlations, unlike the linear configuration where cross-correlations between two variables were needed.
- Because the model captures the full probability distribution of $v_p$ in both setups, the approach is not limited to mean power but also describes voltage fluctuations, which matter for the electronics being powered.
Reading between the lines
- Since the paper does not explain how $I_{k0}$ and $G$ are obtained, the nonlinear agreement may be a calibration rather than an independent prediction; a sharper test would fix these two constants on one load and then predict the whole power curve.
- The admitted failure to reproduce the full $v_{\rm DC}$ distribution suggests that any quantity sensitive to higher cumulants of the rectified voltage—such as peak voltage stress on the storage capacitor or efficiency under intermittent loads—may require a more detailed diode model.
- The high-order-correlation diagnostic demonstrated here could be applied to other nonlinear energy-conversion or biological systems where only one observable is accessible; the paper does not establish the data length needed for reliable detection.
- If the effective diode parameters turn out to be universal for a given diode type or only depend on easily measured quantities, the model becomes a design tool; otherwise each circuit would need its own calibration.
Editorial analysis
A structured set of objections, weighed in public.
Referee Report
Summary. The paper presents a stochastic Langevin model for a piezoelectric energy harvester driven by broadband Gaussian vibrations and compares it with experiments in two load configurations. In Configuration (I), a linear resistive load is treated analytically, yielding the closed-form power expression in Eq. (7); the model parameters are fitted at one acceleration, and the curve is then compared with data at a second acceleration. In Configuration (II), a diode-bridge rectifier with a capacitor and load resistance is modeled by the effective nonlinear equation in Eq. (6), and numerical simulations are compared with measurements of the mean rectified voltage and harvested power as functions of load resistance, with a non-monotonic power curve and an optimum near R* ~ 30 kOhm. The paper also examines three- and four-point connected correlation functions of vDC, claiming that their time asymmetry reveals the nonequilibrium nature of the dynamics, with qualitative agreement between experiment and simulation.
Significance. If the nonlinear configuration were shown to be genuinely predictive, this would be a valuable contribution to stochastic modeling of piezoelectric harvesters with rectified loads, especially the compact effective description of the diode bridge in Eq. (6). The linear configuration is handled carefully: Eq. (7) is analytical, the parameters are fitted at one acceleration and the model then captures data at a second acceleration, and the Gaussian voltage distributions in Fig. 5 are consistent with the linear model. The proposed time-asymmetry analysis for a single measured variable is also interesting and well motivated by earlier work on linear systems. However, the nonlinear part of the paper, which is the main new experimental claim, is currently under-supported: the two effective diode parameters are introduced without disclosing how they were determined, no error bars are given for the central quantities, and the paper itself admits that the full vDC distribution is not captured by the model. These issues make it impossible to judge whether the agreement in Figs. 9 and 10 is an independent prediction or a two-parameter fit.
major comments (4)
- [Section III B, Eq. (6)] The effective diode parameters Ik0 = 9e-9 A and G = -133e-11 Ohm^-1 are introduced without stating how they were obtained. If they were chosen by matching the experimental power curve in Fig. 10, then the agreement shown there is a two-parameter interpolation rather than an independent model prediction. Please disclose the calibration procedure, and ideally validate Ik0 and G independently, for example by comparing the effective I-V characteristic in Eq. (6) with a measured diode-bridge characteristic, or by fitting at a single resistance and predicting the full R sweep.
- [Figs. 9 and 10, Section III B] No error bars or statistical uncertainties are reported for the mean rectified voltage and the harvested power. Without such uncertainties, the claim of good agreement for the non-monotonic power curve, and in particular for the optimal resistance near R* ~ 30 kOhm, cannot be assessed quantitatively. Please report error bars from repeated measurements or from bootstrap resampling, and give a quantitative measure of agreement such as relative error or chi-square per degree of freedom.
- [Fig. 11 and Section III B] The paper states that while average and variance are well described, the full vDC distribution is not reproduced, and attributes this to simplifications in the diode model. Since the harvested power in Eq. (8) is proportional to the second moment of vDC, the distribution tails directly affect the central quantity of the paper. Please quantify the contribution of the tail mismatch to <vDC^2> and discuss whether the model remains reliable for the power curve outside the tested range of load resistances.
- [Section III C, Figs. 12 and 13] The claim that time asymmetry is revealed by the high-order correlation functions is based on a visual comparison of C(3) and C(4) with their time-reversed counterparts. No statistical test, confidence intervals, or quantitative asymmetry measure is provided, and the simulation curves show only qualitative agreement with experiment. Please quantify the asymmetry, include error estimates, and state explicitly whether the simulation reproduces the experimental asymmetry within statistical uncertainty.
minor comments (4)
- [Section II] The experimental section reports the sampling rate fs = 5 kHz but not the duration of each time series or the number of independent realizations; these details are needed to assess stationarity and statistical precision.
- [Eqs. (9) and (10)] The definitions of C(3) and C(4) are not obviously normalized cumulants; please clarify the normalization and state explicitly that the time-reversed functions are computed from the same data with the time argument reversed.
- [Figs. 4-13] Using a consistent plotting style across panels, such as filled markers for experimental data and lines for simulations, would improve readability; where error bars are absent this should be stated in the captions.
- [Section III A] The parameter values M, theta, and gamma are quoted with uncertainties, but the fitting procedure is not described; a sentence on the fitting method (e.g., least squares on log P versus R) would be helpful.
Circularity Check
The diode-bridge power curve in Figs. 9-10 rests on undisclosed effective parameters Ik0 and G, so the nonlinear agreement is not shown to be an independent prediction rather than a fit.
-
fitted input called prediction
[Section III.B, Equation (6), Figures 9 and 10.]
"Here, we simplify the treatment, introducing two effective parameters, Ik0 and G, that appear in Equation (6). The effective values of these parameters used in numerical simulations are Ik0 = 9 × 10⁻⁹ A and G = −133 × 10−11 Ω−1."
The central nonlinear claim is that the model reproduces the measured harvested power P_harv^(II) = ⟨v_DC^2⟩/R over the whole resistance sweep in Fig. 10. The dynamics of v_DC are governed by Eq. (6), which depends directly on the two effective parameters Ik0 and G. The paper gives no derivation, no independent measurement, and no disclosed calibration procedure for these parameters; it simply states their values and then reports good agreement. With two free parameters one can match two moments ⟨v_DC⟩ and ⟨v_DC^2⟩ at a given R, and the negative slope G can tune the location of the optimal resistance. The paper itself admits, in the discussion of Fig.
full rationale
The linear configuration (I) is fitted to experimental data using the analytical formula (7), yielding M, θ, and γ, and those values are then fixed for the nonlinear configuration (II). This is a legitimate calibration step: the linear model has a closed-form prediction and the obtained parameters also reproduce the a = 1.0 g case and the voltage distribution in Fig. 5, so that part of the derivation is self-contained against external data. The circularity arises specifically for Configuration (II). The paper introduces two effective diode parameters, Ik0 and G, in Eq. (6), states their numerical values in the text, and then reports that the model reproduces ⟨v_DC⟩ (Fig. 9) and the harvested power ⟨v_DC^2⟩/R (Fig. 10) across many values of R. Crucially, no fitting procedure, measurement, or independent determination of Ik0 and G is given. These parameters directly control the diode current and hence the steady-state v_DC distribution and its moments. With two free parameters one can match two moments, and the fact that the full v_DC distribution is not reproduced (Fig. 11) indicates that the model is not capturing the real diode behavior beyond the second moment. Therefore, the central claim that the stochastic model 'reproduces' the nonlinear power curve is not established as an independent prediction; it could be a two-parameter fit to the very data it is compared against. The mechanical parameters being fitted separately does not remove this circularity, because the disputed quantities in Configuration (II) are exactly the diode parameters. No other circular steps were found: the high-order correlation analysis in Section III.C is a qualitative comparison between experimental and simulated asymmetry, and the authors explicitly state the quantitative disagreement, so that claim is not forced by construction. The paper also cites prior work by the same authors for the linear model, but that model is analytically solvable and the fit is against experimental data, so the citation is not the only support. Overall, the score reflects the partial circularity: the nonlinear power curve is not demonstrated to be a prediction rather than a fit.
Assumptions & free parameters
free parameters (5)
- M (tip mass) =
0.0112 kg
- theta (electromechanical coupling) =
0.0172 N/V
- gamma (air viscous friction) =
0.660 kg/s
- Ik0 (diode effective saturation current) =
9e-9 A
- G (diode effective conductance) =
-133e-11 ohm^-1
assumptions (6)
- domain assumption Broadband shaker acceleration is Gaussian white noise with amplitude D0 = a^2 Delta_t / 2 and Delta_t = 1/f_s = 0.0002 s.
- domain assumption Tip-mass dynamics is underdamped Langevin with linear elastic force -K_s x and viscous drag -gamma v.
- domain assumption Electromechanical coupling is linear and instantaneous: C_p dv_p/dt = theta v - i_p.
- ad hoc to paper The diode bridge can be represented by Eq. (6) with two constant effective parameters and C_DC = 100 uF.
- domain assumption Thermal fluctuations on the tip mass are negligible compared with shaker noise.
- standard math Stationary averages over long time series equal ensemble averages.
Cite this review
Pith. "Pith review of Stochastic Model for a Piezoelectric Energy Harvester Driven by Broadband Vibrations." pith.science (2026). https://pith.science/paper/SRHIHAED
@misc{pith2026241211816,
  author       = {Pith},
  title        = {Pith review of: Stochastic Model for a Piezoelectric Energy Harvester Driven by Broadband Vibrations},
  year         = {2026},
  howpublished = {\url{https://pith.science/paper/SRHIHAED}},
  note         = {Machine review of arXiv:2412.11816}
}
read the original abstract
We present an experimental and numerical study of a piezoelectric energy harvester driven by broadband vibrations. This device can extract power from random fluctuations and can be described by a stochastic model, based on an underdamped Langevin equation with white noise, which mimics the dynamics of the piezoelectric material. A crucial point in the modelisation is represented by the appropriate description of the coupled load circuit that is necessary to harvest electrical energy. We consider a linear load (resistance) and a nonlinear load (diode bridge rectifier connected to the parallel of a capacitance and a load resistance), and focus on the characteristic curve of the extracted power as a function of the load resistance, in order to estimate the optimal values of the parameters that maximise the collected energy. In both cases, we find good agreement between the numerical simulations of the theoretical model and the results obtained in experiments. In particular, we observe a non-monotonic behaviour of the characteristic curve which signals the presence of an optimal value for the load resistance at which the extracted power is maximised. We also address a more theoretical issue, related to the inference of the non-equilibrium features of the system from data: we show that the analysis of high-order correlation functions of the relevant variables, when in the presence of nonlinearities, can represent a simple and effective tool to check the irreversible dynamics.
Figures
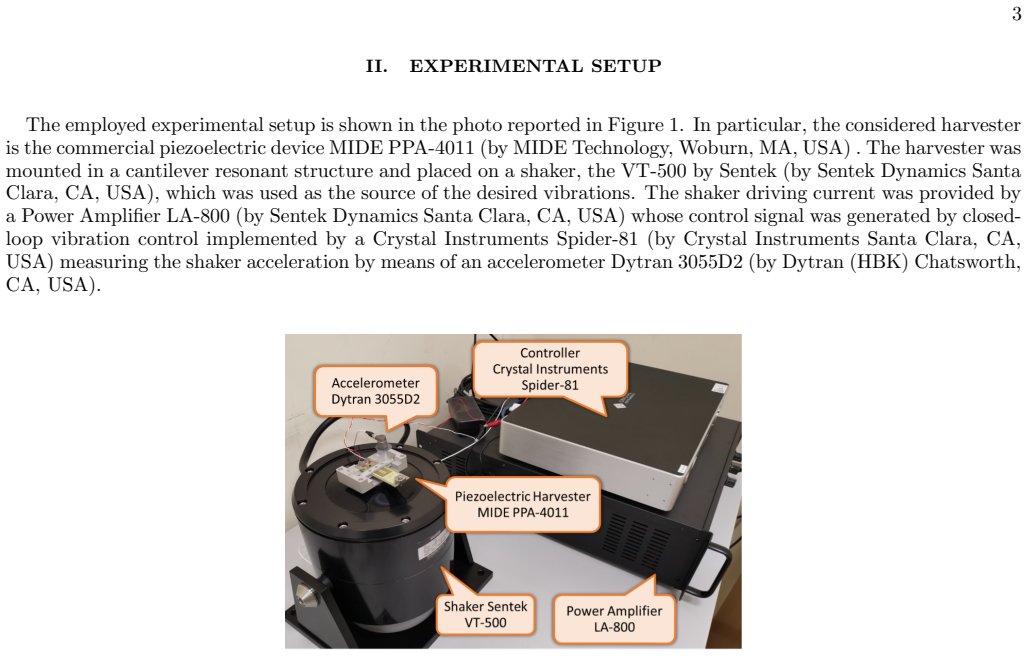


Figures from the paper (10 more)


Reference graph
Works this paper leans on
-
[1]
There’s plenty of energy at the bottom (micro and nano scale nonlinear noise harvesting)
Gammaitoni, L. There’s plenty of energy at the bottom (micro and nano scale nonlinear noise harvesting). Contemp. Phys. 2012, 53, 119–135
work page 2012
-
[2]
Energy harvesting in wireless sensor networks: A taxonomic survey
Singh, J.; Kaur, R.; Singh, D. Energy harvesting in wireless sensor networks: A taxonomic survey. Int. J. Energy Res. 2021, 45, 118–140
work page 2021
-
[3]
Liu, M.; Qian, F.; Mi, J.; Zuo, L. Biomechanical energy harvesting for wearable and mobile devices: State-of-the-art and future directions. Appl. Energy2022, 321, 119379
-
[4]
Pan, H.; Qi, L.; Zhang, Z.; Yan, J. Kinetic energy harvesting technologies for applications in land transportation: A comprehensive review. Appl. Energy2021, 286, 116518
-
[5]
Brownian motors: noisy transport far from equilibrium
Reimann, P. Brownian motors: noisy transport far from equilibrium. Phys. Rep.2002, 361, 57
work page 2002
-
[6]
Brownian Ratchet in a Thermal Bath Driven by Coulomb Friction
Gnoli, A.; Petri, A.; Dalton, F.; Gradenigo, G.; Pontuale, G.; Sarracino, A.; Puglisi, A. Brownian Ratchet in a Thermal Bath Driven by Coulomb Friction. Phys. Rev. Lett.2013, 110, 120601
work page 2013
-
[7]
Di Leonardo, R.; Angelani, L.; Dell’Arciprete, D.; Ruocco, G.; Iebba, V.; Schippa, S.; Conte, M.P.; Mecarini, F.; De Angelis, F.; Di Fabrizio, E. Bacterial ratchet motors. Proc. Natl. Acad. Sci. USA2010, 107, 9541–9545. https://doi.org/10. 1073/pnas.0910426107
-
[8]
Review on innovative piezoelectric materials for mechanical energy harvesting
Clementi, G.; Cottone, F.; Di Michele, A.; Gammaitoni, L.; Mattarelli, M.; Perna, G.; L´ opez-Su´ arez, M.; Baglio, S.; Trigona, C.; Neri, I. Review on innovative piezoelectric materials for mechanical energy harvesting. Energies 2022, 15, 6227. 11
work page 2022
Show all 28 references
-
[9]
A Passive Design Scheme to Increase the Rectified Power of Piezoelectric Energy Harvesters
Du, S.; Jia, Y.; Zhao, C.; Amaratunga, G.A.J.; Seshia, A.A. A Passive Design Scheme to Increase the Rectified Power of Piezoelectric Energy Harvesters. IEEE Trans. Ind. Electron.2018, 65, 7095
2018
-
[10]
Active Interface for Piezoelectric Harvesters Based on Multi-Variable Maximum Power Point Tracking
Costanzo, L.; Schiavo, A.L.; Vitelli, M. Active Interface for Piezoelectric Harvesters Based on Multi-Variable Maximum Power Point Tracking. IEEE Trans. Circuits Syst. I Regul. Pap.2020, 67, 2503
2020
-
[11]
Energy harvesters driven by broadband random vibrations
Halvorsen, E. Energy harvesters driven by broadband random vibrations. J. Microelectromechanical Syst.2008, 17, 1061
2008
-
[12]
Power Extracted From Piezoelectric Harvesters Driven by Non-Sinusoidal Vibra- tions
Costanzo, L.; Schiavo, A.L.; Vitelli, M. Power Extracted From Piezoelectric Harvesters Driven by Non-Sinusoidal Vibra- tions. IEEE Trans. Circuits Syst. I Regul. Pap.2019, 66, 1291
2019
-
[13]
Analysis of piezoelectric energy harvester under modulated and filtered white Gaussian noise
Quaranta, G.; Trentadue, F.; Maruccio, C.; Marano, G.C. Analysis of piezoelectric energy harvester under modulated and filtered white Gaussian noise. Mech. Sys. Signal Proc.2018, 104, 134
2018
-
[14]
Experimental Analysis of a Piezoelectric Energy Harvesting System for Harmonic, Random, and Sine on Random Vibration
Cryns, J.W.; Hatchell, B.K.; Santiago-Rojas, E.; Silvers, K.L. Experimental Analysis of a Piezoelectric Energy Harvesting System for Harmonic, Random, and Sine on Random Vibration. Adv. Acoust. Vib.2013, 10, 241025
2013
-
[15]
Stochastic thermodynamics of a piezoelectric energy harvester model
Costanzo, L.; Lo Schiavo, A.; Sarracino, A.; Vitelli, M. Stochastic thermodynamics of a piezoelectric energy harvester model. Entropy 2021, 23, 677
2021
-
[16]
Stochastic thermodynamics of an electromagnetic energy harvester
Costanzo, L.; Lo Schiavo, A.; Sarracino, A.; Vitelli, M. Stochastic thermodynamics of an electromagnetic energy harvester. Entropy 2022, 24, 1222
2022
-
[17]
Inference of Time-Reversal Asymmetry from Time Series in a Piezoelectric Energy Harvester
Costanzo, L.; Baldassarri, A.; Lo Schiavo, A.; Sarracino, A.; Vitelli, M. Inference of Time-Reversal Asymmetry from Time Series in a Piezoelectric Energy Harvester. Symmetry 2023, 16, 39
2023
-
[18]
Stochastic thermodynamics, fluctuation theorems and molecular machines
Seifert, U. Stochastic thermodynamics, fluctuation theorems and molecular machines. Rep. Prog. Phys.2012, 75, 126001
2012
-
[19]
Stochastic Systems with Time Delay: Probabilistic and Thermodynamic Descriptions of Non-Markovian Pro- cesses Far from Equilibrium; Springer Nature
Loos, S.A. Stochastic Systems with Time Delay: Probabilistic and Thermodynamic Descriptions of Non-Markovian Pro- cesses Far from Equilibrium; Springer Nature. 2021
2021
-
[20]
Inference of time irreversibility from incomplete informa- tion: Linear systems and its pitfalls
Lucente, D.; Baldassarri, A.; Puglisi, A.; Vulpiani, A.; Viale, M. Inference of time irreversibility from incomplete informa- tion: Linear systems and its pitfalls. Phys. Rev. Res.2022, 4, 043103. https://doi.org/10.1103/PhysRevResearch.4. 043103
2022 doi
-
[21]
Maximum power point of piezoelectric energy harvesters: A review of optimality condition for electrical tuning
Brenes, A.; Morel, A.; Juillard, J.; Lefeuvre, E.; Badel, A. Maximum power point of piezoelectric energy harvesters: A review of optimality condition for electrical tuning. Smart Mater. Struct.2020, 29, 033001
2020
-
[22]
Power-extraction circuits for piezoelectric energy harvesters in miniature and low-power applications
Dicken, J.; Mitcheson, P.D.; Stoianov, I.; Yeatman, E.M. Power-extraction circuits for piezoelectric energy harvesters in miniature and low-power applications. IEEE Trans. Power Electron.2012, 27, 4514–4529
2012
-
[23]
Available online: http://www.linear.com/product/LTC3331
-
[24]
Available online: http://www.ti.com/tool/TIDA-006900
-
[25]
Available online: https://datasheets.maximintegrated.com/en/ds/MAX17710.pdf
-
[26]
Inferring entropy production from short experiments
Manikandan, S.K.; Gupta, D.; Krishnamurthy, S. Inferring entropy production from short experiments. Phys. Rev. Lett. 2020, 124, 120603
2020
-
[27]
Temperature in and out of equilibrium: A review of concepts, tools and attempts
Puglisi, A.; Sarracino, A.; Vulpiani, A. Temperature in and out of equilibrium: A review of concepts, tools and attempts. Phys. Rep.2017, 709, 1–60
2017
-
[28]
Sym´ etrie des fluctuations dans le renversement du temps
Pomeau, Y. Sym´ etrie des fluctuations dans le renversement du temps. J. Phys. 1982, 43, 859–867
1982
Reviewed August 11, 2026 · model on record in the stance chip above.
Discussion (0). Continue with ORCID to comment.