REVIEW 5 major objections 5 minor 19 references
Evaluating the Efficacy of Vectocardiographic and ECG Parameters for Efficient Tertiary Cardiology Care Allocation Using Decision Tree Analysis
T0 review · 5 major / 5 minor · reviewed 2026-08-11 · deepseek-v4-flash
Pith's one-line read This paper tries to establish that vectorcardiographic markers of global electric heterogeneity, computed from standard 12-lead ECG traces, materially improve prediction of cardiovascular outcomes in a population already referred to…
desk verdict Real univariate signal in GEH markers, but the ML comparison is sunk by test-set selection; needs reanalysis before the main claim can be believed. read the letter →
The pith
A machine-rendered reading of the paper's core claim, the machinery that carries it, and where it could break.
The reading
What carries the argument
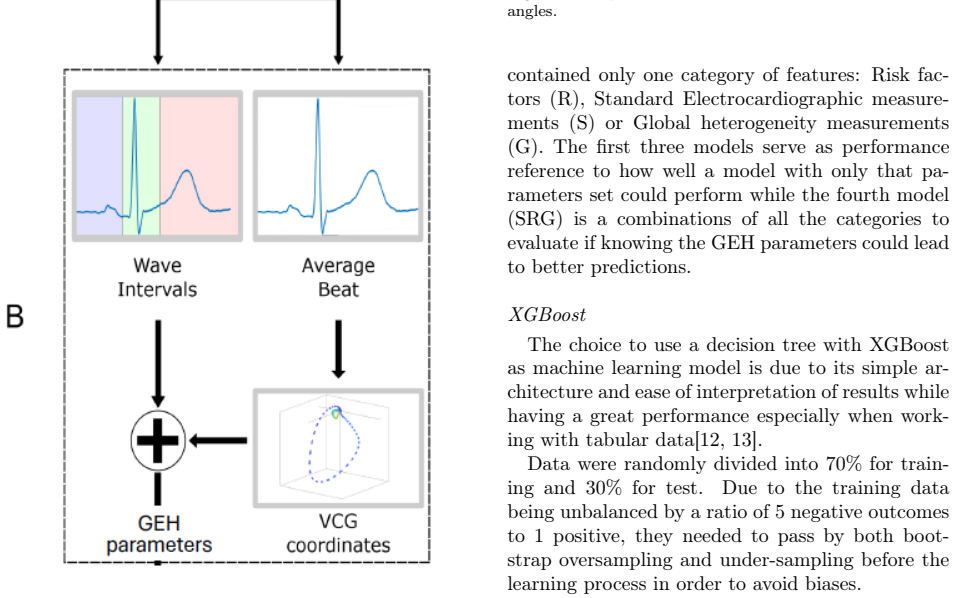
The load-bearing object is the derived vectorcardiogram: a Kors transformation matrix converts the standard 12-lead ECG into three orthogonal leads, and an adapted GEH analysis algorithm computes global electric heterogeneity markers from the measured wave boundaries. The decisive quantities are the spatial ventricular gradient (SVG) and the QRS-T angle, which summarize the direction and magnitude of repolarization relative to depolarization. The prediction machinery is a gradient-boosted decision-tree ensemble trained with class resampling, tuned on the area under the precision-recall curve, and represented by the best of 50 instances; the model's gain importance is used to attribute each feature's contribution. The argument works by showing the derived VCG markers survive in a model alongside clinical risk factors, where standard ECG intervals do not.
What would settle it
An external validation with adjudicated outcomes, or with non-responders tracked through registries, would settle the claim if it showed that adding GEH parameters to risk factors and standard ECG intervals does not raise the AUC, or that the combined model's specificity advantage disappears when follow-up is complete.
Extended reading notes
Core claim
The paper's central claim, stated in its conclusion, is that incorporating VCG features derived from standard ECG signals significantly enhances the triage and prediction of cardiovascular outcomes in a referred population. The evidence offered is comparative: models built from only standard ECG intervals, only risk factors, and only GEH parameters each performed worse than the combined model, and the combined model's feature-importance ranking put GEH measures at the top, with age and prior PCI also contributing. The QRS-T angle and the spatial ventricular gradient were the GEH parameters with the strongest statistical separation between outcome groups. The implication the authors draw is that the same 12-lead ECG already recorded at first attendance can be post-processed into VCG-based markers that improve allocation of tertiary cardiology care.
Load-bearing premise
The load-bearing assumption is that the outcome status obtained by phone follow-up is correct and that excluding the 29 patients who never answered a follow-up call does not bias the cohort; if those patients have different event rates, both the measured AUC and the feature-importance ranking could shift.
Editorial extensions
If this is right
- If the result holds in larger cohorts, tertiary referral algorithms can be upgraded using only software on existing ECG traces, with no extra patient visit or equipment.
- The combined model's fixed 94% sensitivity with specificity improved from roughly 3–20% to about 31%, implying that adopting it would reduce false-positive referrals to tertiary care while keeping event capture essentially unchanged.
- Standard ECG intervals alone had little discriminating power in this referred population; the gain came from VCG-derived heterogeneity markers and clinical history.
- Because the winning model is a decision tree, its cutoff rules can be inspected and audited by clinicians, which eases adoption in triage workflows.
Reading between the lines
- The authors do not compare the derived VCG markers against a separately recorded Frank-lead VCG, so this study leaves open whether direct VCG acquisition would strengthen or change the predictive gain.
- Because the outcome definition mixes mortality with revascularization procedures such as PCI and cardiac surgery, which are themselves clinical decisions, part of the model's signal may reflect who was offered treatment rather than who had spontaneous disease progression.
- A natural external check would be to validate the combined model in a primary-care or general-population cohort, where the prevalence of prior MI and PCI is much lower and the spectrum of ECG abnormalities is wider.
Signed reviews
Editorial analysis
A structured set of objections, weighed in public.
Referee Report
Summary. The paper evaluates whether vectorcardiographic (VCG) features obtained from a standard 12-lead ECG via the Kors transform (Global Electric Heterogeneity, GEH) improve machine-learning-based triage of patients referred to a tertiary cardiology center, relative to using only standard ECG parameters or risk factors. The authors train XGBoost models on four feature sets (S, R, G, SRG), select the best of 50 trained instances by highest AUC, and report that the combined SRG model achieves the best F2 score, AUC, sensitivity, and specificity (Table 2). The conclusion is that incorporating VCG features significantly enhances triage and prediction of cardiovascular outcomes.
Significance. If the central claim were supported by valid evaluation, the paper would provide a practical, low-cost decision-support tool for cardiology triage and add to the evidence that GEH markers carry incremental prognostic information beyond standard ECG intervals and risk factors. The univariate associations in Table 1 (e.g., QRST angles, SVG, age, previous MI/PCI/diabetes) are plausible and consistent with prior literature. The study has the strength of using real-world referred-population data and a transparent decision-tree model with feature-importance reporting. However, the comparative performance claim is currently undermined by a model-selection protocol that uses test-set labels, and by inconsistent reporting of the main results; these issues must be fixed before the significance of the clinical claim can be assessed.
major comments (5)
- [§2 (XGBoost) and Table 2] The representative model for each feature set is selected as the single instance with the highest AUC among 50 trained instances, and this selection is made using the same 30% test set on which all metrics in Table 2 and Figure 4 are reported. This constitutes selection on the test set: each reported AUC is a maximum over 50 random seeds rather than an unbiased estimate of model performance. Because the variance across seeds is likely to differ across feature sets (S, R, G, SRG), the observed advantage of SRG (AUC 67.6% vs 62.5% for R) could be inflated or even entirely artifactual, even if the true predictive difference is zero. An unbiased evaluation protocol—such as nested cross-validation, or selection of the representative within each training fold only—is required before any statement about the superiority of SRG can be made. This issue directly affects the central conclusion in §5 that VCG features 'significantly enhance' triage.
- [§4 Discussion and Table 2] The Discussion states: 'When all parameters were combined, the model achieved a higher Area Under the Curve (AUC) of 76.3%, an F1 score of 0.48, and a specificity of 49.25%, while maintaining a fixed sensitivity of 94.12%.' These numbers appear nowhere in Table 2, which reports for SRG an AUC of 67.6%, an F2 score of 0.62, and a specificity of 30.77%. The reader cannot determine which analysis produced the headline values. If the 76.3% AUC comes from a different threshold, a different run, or a different evaluation split, the manuscript must state this explicitly and reconcile the discrepancy; as written, the results section and discussion contradict each other.
- [§2 (Model's performance)] The classification threshold is chosen from the test-set ROC curve to yield approximately 90% sensitivity, and the sensitivity (94.12%) and specificity values in Table 2 are then computed on the same test set at that threshold. This is a second, independent source of test-set leakage: the threshold is a free parameter tuned on the same data used to report performance, which optimistically biases the reported specificity and F2 scores. The threshold should be selected inside the training loop (e.g., by cross-validation on the training portion) or fixed a priori by a rule that does not use test labels.
- [§2 (Population)] The outcome is determined solely by phone follow-up, and the 29 patients (out of 303) who did not answer any follow-up call are excluded from the analysis. If non-responders differ systematically from responders in their event rates or risk-factor distribution, the model's performance and feature-importance estimates could be distorted. The manuscript should compare baseline characteristics of included versus excluded patients, or at minimum discuss the likely direction and magnitude of this selection bias, since the outcome status is the target variable of the study.
- [§5 Conclusion and §2 (XGBoost)] The claim that GEH features 'significantly enhance' prediction is not supported by any statistical hypothesis test comparing the models. The univariate p-values in Table 1 do not establish incremental predictive value in a multivariable model, and no test is reported for the difference between the SRG and R (or S, G) AUCs. The paper should include a formal comparison of model performance—for example, a DeLong test for paired AUCs, a likelihood-ratio test in a logistic-regression framework with the same features, or confidence intervals from a properly conducted cross-validation—to substantiate the 'significant enhancement' language used in the abstract and conclusion.
minor comments (5)
- [Abstract and §2] The phrase 'Kors Matriz' should be 'Kors matrix' (also appears in the Data Pre-processing section).
- [§1 Introduction] The sentence 'The goal is to provide an improved diagnostic tool having a high Sensitivity with the biggest sensibility possible' is awkward and should be reworded; 'sensibility' is not the correct term here.
- [§4 Discussion] The Discussion reports SVG values of 66.0 [43.4, 86.2] for the no-event group and 45.6 [31.4, 64.4] for the event group, but Table 1 lists 65.0 [42.4, 85.9] and 45.6 [29.5, 61.9]. The discrepancy in IQRs should be corrected or explained.
- [Keywords] The keyword 'Survival Prediction' is misleading because the study analyzes a binary 1-year outcome, not time-to-event survival data; 'Outcome Prediction' would be more accurate.
- [§2 (Data Pre-processing)] The description of the GEH computation says an 'adapted version' of Tereshchenko's algorithm was used, but the details of the adaptation are not provided; the manuscript should specify what was modified relative to the published algorithm, since this affects reproducibility.
Circularity Check
Reported SRG advantage is a test-set-selected maximum, not an independent prediction.
-
fitted input called prediction
[Section 2, 'XGBoost' and 'Model's performance'; Table 2]
"Data were randomly divided into 70% for training and 30% for test. ... From all the 50 instances in one model, the one with the higher AUC was selected to be the final XGBoost tree for the model. ... The threshold can be chosen as a bare minimum or as a maximum to the prediction be considered as positive, depending of which case will lead to a higher AUC."
The same 30% test labels are used (i) to select the best of 50 random-seed XGBoost instances per feature set, (ii) to choose the decision threshold, and (iii) to compute the reported AUC, F2, sensitivity, and specificity in Table 2. Therefore each Table 2 entry is a maximum over 50 test-set AUCs (and a threshold tuned on the test ROC) by construction, not an unbiased out-of-sample estimate. The conclusion that SRG 'significantly enhances' triage is then based on this same in-sample selection; SRG's higher AUC (67.6% vs 62.5%) and specificity (30.8% vs 6.15%) can be inflated by differential selection bias even if the true predictive difference is zero. No nested or repeated cross-validation is reported to separate the selection artifact from a genuine GEH benefit.
full rationale
The GEH/VCG feature computation itself is not circular: it uses the Kors transformation and the Tereshchenko GEH algorithm as external, published methods, and the features are not fitted to the outcome. The univariate associations (e.g., QRST angle, SVG) are also independent evidence. However, the central ML comparison—the claim that adding GEH parameters 'significantly enhances' triage—rests on Table 2, whose metrics are produced by selecting the best of 50 instances on the same 30% test set used for evaluation, and by choosing the sensitivity threshold from the test ROC. This makes the reported 'best model' performance a fitted quantity rather than a prediction: the SRG advantage is, at least in part, an artifact of max-selection on test labels. The Discussion additionally reports an AUC of 76.3%, F1 0.48, and specificity 49.25% for SRG that do not appear in Table 2, so the headline numbers cannot be traced to a defined evaluation protocol. Because the enhancement claim reduces, by construction, to a selection on the evaluation data, a score of 6 is appropriate: partial circularity of the central predictive comparison, while the feature derivation remains independent.
Assumptions & free parameters
free parameters (3)
- XGBoost learning factor and number of rounds =
not reported
- Classification threshold =
not reported
- Oversampling and undersampling ratio =
not reported
assumptions (5)
- domain assumption Kors transformation matrix converts 12-lead ECG to VCG.
- domain assumption Tereshchenko GEH algorithm correctly extracts GEH markers from annotated ECG.
- domain assumption Phone follow-up accurately identifies cardiovascular events.
- domain assumption Exclusion of non-responders does not bias the cohort.
- domain assumption XGBoost hyperparameters tuned on training folds generalize to the test set.
Cite this review
Pith. "Pith review of Evaluating the Efficacy of Vectocardiographic and ECG Parameters for Efficient Tertiary Cardiology Care Allocation Using Decision Tree Analysis." pith.science (2026). https://pith.science/paper/N7FW7B4R
@misc{pith2026241211839,
  author       = {Pith},
  title        = {Pith review of: Evaluating the Efficacy of Vectocardiographic and ECG Parameters for Efficient Tertiary Cardiology Care Allocation Using Decision Tree Analysis},
  year         = {2026},
  howpublished = {\url{https://pith.science/paper/N7FW7B4R}},
  note         = {Machine review of arXiv:2412.11839}
}
read the original abstract
Use real word data to evaluate the performance of the electrocardiographic markers of GEH as features in a machine learning model with Standard ECG features and Risk Factors in Predicting Outcome of patients in a population referred to a tertiary cardiology hospital. Patients forwarded to specific evaluation in a cardiology specialized hospital performed an ECG and a risk factor anamnesis. A series of follow up attendances occurred in periods of 6 months, 12 months and 15 months to check for cardiovascular related events (mortality or new nonfatal cardiovascular events (Stroke, MI, PCI, CS), as identified during 1-year phone follow-ups. The first attendance ECG was measured by a specialist and processed in order to obtain the global electric heterogeneity (GEH) using the Kors Matriz. The ECG measurements, GEH parameters and risk factors were combined for training multiple instances of XGBoost decision trees models. Each instance were optmized for the AUCPR and the instance with higher AUC is chosen as representative to the model. The importance of each parameter for the winner tree model was compared to better understand the improvement from using GEH parameters. The GEH parameters turned out to have statistical significance for this population specially the QRST angle and the SVG. The combined model with the tree parameters class had the best performance. The findings suggest that using VCG features can facilitate more accurate identification of patients who require tertiary care, thereby optimizing resource allocation and improving patient outcomes. Moreover, the decision tree model's transparency and ability to pinpoint critical features make it a valuable tool for clinical decision-making and align well with existing clinical practices.
Figures


Figures from the paper (1 more)

Reference graph
Works this paper leans on
-
[1]
who.int/news-room/fact-sheets/detail/ cardiovascular-diseases-(cvds), 2022
World health organization - cardio- vascular diseases (cvds), https://www. who.int/news-room/fact-sheets/detail/ cardiovascular-diseases-(cvds), 2022. Accessed: 2022-09-01
work page 2022
-
[2]
URL: https://www.portal.cardiol
Sociedade Brasileira de Cardiologia, Relatório an- ual 2022, 2022. URL: https://www.portal.cardiol. br/arquivos/gerais/relatorio-anual-2022.pdf, ac- cessed: 2024-07-19
work page 2022
-
[3]
Who - cardiovascular diseases, https://www.who.int/ health-topics/cardiovascular-diseases#tab=tab_1,
-
[4]
E. J. Topol, High-performance medicine: the con- vergence of human and artificial intelligence, Nature medicine 25 (2019) 44–56
work page 2019
-
[5]
Z. Bouzid, Z. Faramand, R. E. Gregg, S. Helman, C. Martin-Gill, S. Saba, C. Callaway, E. Sejdić, S. Al- Zaiti, Novel ecg features and machine learning to opti- mize culprit lesion detection in patients with suspected acute coronary syndrome, Journal of Electrocardiology 69 (2021) 31–7
work page 2021
-
[6]
A. Mincholé, J. Camps, A. Lyon, B. Ro- dríguez, Machine learning in the electrocardio- gram, Journal of Electrocardiology 57 (2019) S61–4. URL: https://www.sciencedirect.com/ science/article/pii/S0022073619304571. doi:https: //doi.org/10.1016/j.jelectrocard.2019.08.008
-
[7]
J. W. Waks, C. M. Sitlani, E. Z. Soliman, M. Kabir, E. Ghafoori, M. L. Biggs, C. A. Henrikson, N. So- toodehnia, T. Biering-Sørensen, S. K. Agarwal, et al., Global electric heterogeneity risk score for prediction of sudden cardiac death in the general population: the atherosclerosis risk in communities (aric) and cardio- vascular health (chs) studies, Cir...
work page 2016
-
[8]
L.Tereshchenko, Globalelectricalheterogeneity: Mech- anisms and clinical significance, in: 2018 Comput- ing in Cardiology Conference (CinC), 2018, pp. 1–
work page 2018
Show all 19 references
-
[9]
Vondrák, M
J. Vondrák, M. Penhaker, Review of processing patho- logical vectorcardiographic records for the detection of heart disease, Frontiers in Physiology (2022). URL: https://www.frontiersin.org/journals/ physiology/articles/10.3389/fphys.2022.856590. doi:10.3389/fphys.2022.856590
2022
-
[10]
doi:10.22489/CINC.2018.165
URL: https://www.cinc.org/archives/2018/pdf/ CinC2018-165.pdf. doi:10.22489/CINC.2018.165
2018 doi
-
[11]
Tereshchenkolab, Global-electrical-heterogeneity, https://github.com/Tereshchenkolab/ Global-Electrical-Heterogeneity, 2020
2020
-
[12]
Jaros, R
R. Jaros, R. Martinek, L. Danys, Comparison of differ- ent electrocardiography with vectorcardiography trans- formations, Sensors 19 (2019) 3072
2019
-
[13]
Shwartz-Ziv, A
R. Shwartz-Ziv, A. Armon, Tabular data: Deep learn- ing is not all you need, Information Fusion 81 (2022) 84–90
2022
-
[14]
Accessed: 2022-11-25
Xgboost, https://www.kaggle.com/code/dansbecker/ xgboost/notebook, 2018. Accessed: 2022-11-25
2018
-
[15]
Saito, M
T. Saito, M. Rehmsmeier, The precision-recall plot is more informative than the roc plot when evaluating bi- nary classifiers on imbalanced datasets, PloS one 10 (2015) e0118432
2015
-
[16]
H. J. Weerts, A. C. Mueller, J. Vanschoren, Impor- tance of tuning hyperparameters of machine learning algorithms, arXiv preprint arXiv:2007.07588 (2020)
2020 arXiv
-
[17]
K. T. Haq, K. J. Lutz, K. K. Peters, N. E. Craig, E. Mitchell, A. K. Desai, N. W. L. Stencel, E. Z. Soliman, J. A. C. Lima, L. G. Tereshchenko, Re- producibility of global electrical heterogeneity mea- surements on 12-lead ecg: The multi-ethnic study of atherosclerosis 69 (202...
2021 doi
-
[18]
J. D. Pollard, K. T. Haq, K. J. Lutz, N. M. Rogovoy, K. A. Paternostro, E. Z. Soliman, J. Maher, J. A. Lima, S. K. Musani, L. G. Tereshchenko, Electrocardiogram machine learning for detection of cardiovascular disease inafricanamericans: thejacksonheartstudy, European Heart Jo...
2021
-
[2022]
Accessed: 2022-06-01
2022
Reviewed August 11, 2026 · model on record in the stance chip above.
Discussion (0). Continue with ORCID to comment.