REVIEW 3 major objections 4 minor 51 references
Does the random nature of cell-virus interactions during in vitro infections affect TCID$_{50}$ measurements and parameter estimation by mathematical models?
T0 review · 3 major / 4 minor · reviewed 2026-08-11 · deepseek-v4-flash
Pith's one-line read TCID50 numbers are not virion counts; a new formula converts between them.
desk verdict Solid methodological core, undermined by an acknowledged but unresolved cell-type mismatch in the empirical application; still worth a peer review with major revisions. read the letter →
The pith
A machine-rendered reading of the paper's core claim, the machinery that carries it, and where it could break.
The reading
What carries the argument
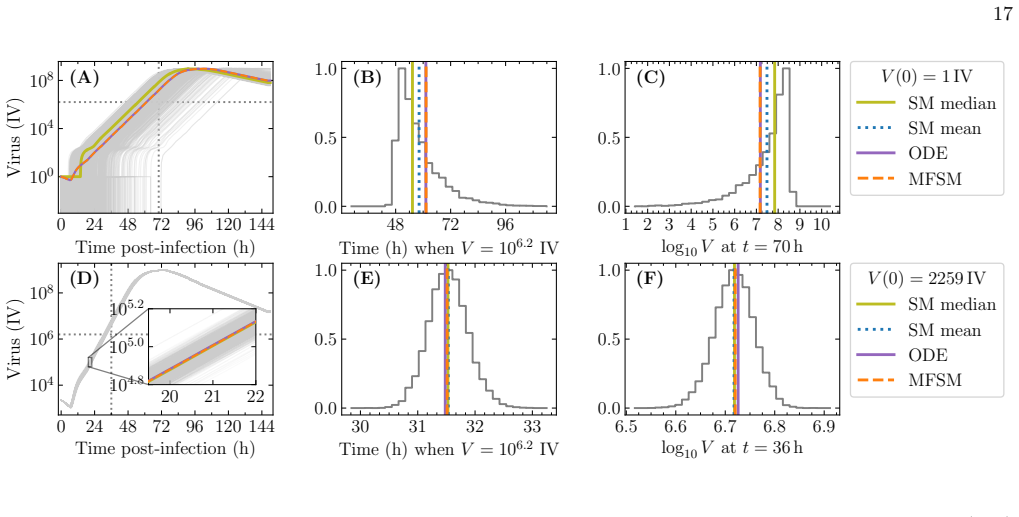
The load-bearing object is the extinction probability $P_{V\to\text{Extinction}}$ in Eqn (1), derived from a stochastic model with Erlang-distributed eclipse and infectious phases, negative-binomial per-cell virion production, and loss of infectivity and cell entry. Its complement, $P_{V\to\text{Establishment}} = 1 - P_{V\to\text{Extinction}}$, converts infectious virions to measured specific infections as in Eqn (2). The new likelihood $L_{ED}$ (Eqn 5) is a product over dilution columns of binomial infection probabilities, with no Gaussian error assumption, and it naturally includes measurements below the detection limit. Parameter estimation uses MCMC, and for the stochastic model the random number seed is added as a parameter so each parameter set maps to a single deterministic trajectory.
What would settle it
Measure the establishment probability directly: inoculate many replicate wells with a dilution expected to contain about one infectious virion, count the fraction that become infected, and compare with Eqn (1) evaluated at the estimated parameters. If the measured fraction differs from the predicted $P_{V\to\text{Establishment}}$ by more than the assay's sampling error, the conversion underlying every IV-unit estimate is wrong; a simpler version is to repeat the authors' parameter estimation with the ED assay performed in the same A549 cells used for the infections and check whether $\gamma$, $\rho$, and $P_{V\to\text{Establishment}}$ shift.
Extended reading notes
Core claim
The paper's central claim is expressed as Eqn (2): the measured infection-causing dose concentration (SIN/ml) equals the actual infectious virion concentration (IV/ml) multiplied by $P_{V\to\text{Establishment}} = 1 - P_{V\to\text{Extinction}}$, the probability that an infection initiated with a single infectious virion establishes. That probability is parameter-dependent and given by Eqn (1), so the conversion factor between SIN and IV is not a constant but part of what the model must estimate. Building on this, the paper proposes a likelihood, $L_{ED}$ (Eqn 5), that uses the full endpoint-dilution outcome rather than a Gaussian residual assumption, and it re-expresses the model's infectious titre in IV units rather than SIN units. In IV units, physical constraints (one IV cannot infect more than one cell; IV cannot exceed total vRNA) break the degeneracies that otherwise plague parameter estimation. Applied to experimental influenza A infections, the framework yields statistically similar phase durations and production rates to standard approaches, but with the added ability to estimate quantities such as the probability of infection establishment and the number of IV entry events per successful cell infection.
Load-bearing premise
The entire conversion and all IV-unit parameter estimates rest on treating the ED assay and the infection experiments as sharing the same infection parameters, even though the infections used A549 cells and the ED assay used MDCK cells; the paper states explicitly that this assumption was not true.
Editorial extensions
If this is right
- Measurements below the assay's detection limit (no infected wells at any dilution) are handled by $L_{ED}$ directly, instead of being set to the limit of detection as in Gaussian-residual likelihoods.
- Expressing virus in IV units with the constraints $\gamma \le 1$ cell/IV and IV $\le$ vRNA removes the $(\gamma, \rho)$ degeneracy, giving finite, meaningful posterior intervals for each parameter.
- The stochastic model and the ODE give statistically indistinguishable parameter estimates for the in vitro infections considered, so the 15-fold extra computation buys little for such well-inoculated infections.
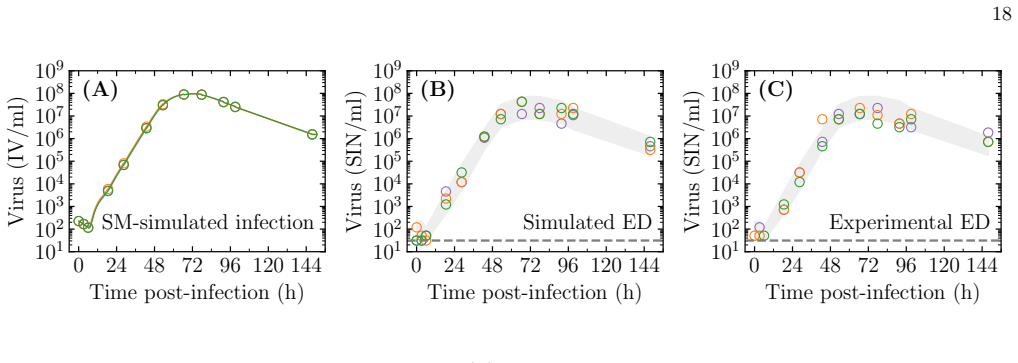
- Simulated ED assay noise alone reproduces the scatter among experimental triplicates, implying that replicate variability in such experiments comes largely from the measurement assay and could be reduced by more wells per dilution or finer dilution steps.
- The estimated parameters imply that 1 SIN corresponds to roughly 1.1 to 5.8 infectious virions under the conditions studied, and that about 1 to 5 infectious virion entry events are needed for one successful cell infection.
Reading between the lines
- The authors stop short of saying so, but the same logic implies that comparing viral titres across cell types, or between an assay and an infection done in different cells, carries an unknown conversion factor: equal TCID50 readings can correspond to very different numbers of infectious virions in the two settings.
- A testable extension is to run the identical infection experiment with the ED assay performed in the same cell line as the infection; if the shared-parameter assumption is correct, parameter posteriors should match the authors' results, and if not, the discrepancy would quantify cell-type effects on establishment.
- A concrete assay-design improvement follows directly from the paper: increasing the number of replicate wells per dilution and using finer dilution steps should narrow the measurement noise identified as the dominant source of inter-replicate scatter, and this can be verified in silico before spending reagents.
- The framework should port to plaque and focus-forming assays, which share the 'one dose causes one infection' assumption; expressing those titres in IV units would require the same establishment-probability conversion, possibly with assay-specific parameters.
Signed reviews
Editorial analysis
A structured set of objections, weighed in public.
Referee Report
Summary. The paper develops a stochastic framework for interpreting TCID50 endpoint dilution (ED) assays in terms of infectious virions (IV) for in vitro virus infection models. The central result is Eqn. (2): the experimentally measured infection-causing dose concentration (SIN/ml) equals the actual infectious virion concentration (IV/ml) multiplied by the establishment probability P_V→Establishment of an infection initiated with a single infectious virion. The authors introduce a new likelihood (LED) based on the raw ED assay outcome (number of infected wells per dilution), compare it to a Gaussian residual likelihood (LNR), express the model virus variable in IV rather than SIN units with physical constraints, and compare ODE versus stochastic model predictions. Using published A549 influenza infection data with MDCK-based ED assays, they estimate parameters under four model variants and argue that ED assay stochasticity explains the inter-replicate variability observed in experimental infections. The paper includes substantial methodological derivations, including the extinction probability, the ED likelihood, and the infecting-time distribution, all validated against stochastic simulations.
Significance. If the results hold, the paper offers an important conceptual advance: it gives a principled, parameter-dependent conversion between a commonly measured infectivity unit (SIN/TCID50) and the biologically meaningful number of infectious virions, and it introduces a likelihood that correctly handles below-detection ED outcomes. The methodological strengths include careful stochastic derivations checked against simulation (e.g., Eqn. (1), the infecting-time distribution in Sec. IV.H), a deliberate comparison of likelihood choices, and physically motivated constraints in IV units that can improve identifiability of parameters such as γ and ρ. The paper is also refreshingly explicit about its limitations. However, the empirical demonstration of the framework rests on an acknowledged incorrect assumption that A549 infection experiments and MDCK ED assays share all infection parameters, which biases the quantitative parameter estimates and the conclusions built on them. The methodological components remain valuable and potentially correct, but the paper's current claims about IV-unit parameter values and the source of inter-replicate variability require revision.
major comments (3)
- [§II.D and Discussion (third limitation)] The conversion C_model(t) = [V(t)/s] · P_V→Establishment(π) for the ED assay (Eqn. (2) and its use in the LED likelihood) relies on parameters π estimated from the A549 SC/MC infections being applied to the MDCK ED assay. The manuscript itself states, in the Discussion, that this shared-parameter assumption 'was not the case.' Because P_V→Establishment depends on cell-type-specific parameters (notably γ and β), any difference in establishment probability between A549 and MDCK cells multiplies the IV-to-SIN conversion by a constant. This directly biases the IV-unit estimates of γ, β, ρ, and all derived quantities (B, R0, tinf, P_V→Establishment) reported in Tables I and II, and consequently the identifiability discussion in §II.D and the noise-attribution conclusion in §II.E. To make the empirical claims load-bearing, the authors should either re-analyze the data with ED assays performed in the same cell type as the infections, or explicitly propagate the uncertainty in the cell-type-specific establishment probability and demonstrate that the qualitative conclusions are robust to plausible differences between A549 and MDCK.
- [§II.D, Figure 8O and Table IV] The claimed individual identifiability of γ and ρ when [V] = IV relies on the physical constraint that IV cannot exceed vRNA, which in practice is imposed by a single data pair: the post-rinse SC infectious titre (10^7 SIN/ml, measured by MDCK ED) and the post-rinse total vRNA (10^7.76 vRNA/ml), giving P_V→Establishment ≥ 0.174. This constraint mixes MDCK-based SIN measurements with A549-based vRNA measurements, so it is exactly the type of quantity affected by the A549/MDCK parameter mismatch. If the true MDCK establishment probability differs from the A549-derived value, the inferred IV scale and hence the posterior bounds on γ and ρ change, weakening the conclusion that IV units resolve the γ–ρ degeneracy. The authors should show how the γ and ρ posteriors change under a range of plausible P_V→Establishment values in the ED assay, or obtain a same-cell-type measurement to anchor this constraint.
- [§II.E, Figure 13] The conclusion that ED assay stochasticity alone explains the experimentally observed inter-replicate variability is based on simulating ED assays from SM-predicted IV time courses using the MAP parameter set (Table I, SM,IV,LED). Since that parameter set is obtained under the acknowledged A549/MDCK sharing assumption, the simulated ED noise band in Figure 13B is not an unbiased representation of the actual ED assay noise for the experimental samples. If P_V→Establishment in the MDCK ED assay differs from the A549-based value, the simulated SIN values and their dispersion shift, and the visual match with the experimental triplicates in Figure 13C is no longer meaningful. The authors should either verify this conclusion with same-cell-type data or temper the claim to state that the observed variability is consistent with ED noise under the (unverified) assumption of shared parameters.
minor comments (4)
- [§II.C, Eqns. (4)–(5)] The notation C_model(t|π) is used both for the model prediction in SIN/ml (when [V]=SIN) and for the model prediction converted to SIN/ml via the establishment probability (when [V]=IV). The text explains the distinction, but the equations would be clearer if the two quantities were written as C_model^SIN(t) and C_model^IV(t)·P_V→Establishment.
- [Table II] The p-values are described as one-tailed fractions of pairwise comparisons, which is not a standard hypothesis test. This should be stated in the caption so that readers do not interpret them as conventional two-sided p-values.
- [§IV.F, Eqn. (17)] The derivation of the ED likelihood uses the small-x approximation ln(1−x) ≈ −x. The approximation is well justified because p = C_actual·V_vir with V_vir ≈ 5.2×10^−16 ml, but the paper should state the numerical magnitude explicitly so that the approximation's validity is transparent.
- [§II.E, Figure 13] The grey band in panel (B) represents the 95% range of 10,000 simulated ED outcomes at each time point for the SM-predicted IV concentration, while the experimental points are three independent infection replicates. The text should note that this comparison does not include infection-to-infection variability beyond the mean IV trajectory, only ED sampling noise.
Circularity Check
Minor self-consistency in the Eqn. (2) demonstration; the central likelihood and parameter-estimation framework is not circular.
-
self definitional
[Section II.A, Eqn. (2) and Figure 2B/Figure 5]
"The random outcome for each well, i.e. whether infection took place or not (1 or 0, respectively), is determined based on the number of IV received by the well (V i,j 0) and the SM-predicted likelihood that infection will fail (PV → Extinction). ... Cmeasured = Cactual · PV → Establishment."
In the simulated ED assay, a well receiving V0 IVs is scored infected with probability 1 − (PV→Extinction)^V0, so for V0 = 1 the per-IV establishment probability is exactly PV→Establishment by construction. The 'demonstration' in Figure 5 divides the midSIN-estimated titres by PV→Establishment and recovers Cactual; this recovery is guaranteed by the simulation's own infection rule, not by independent data. Eqn. (2) is therefore a built-in identity of the simulation rather than an empirically established relation. This does not undermine the LED likelihood, which uses Eqn. (2) as a deliberate modeling conversion, but the paper's wording 'demonstrated' overstates the independence of this step.
full rationale
The central parameter-estimation methodology is otherwise self-contained. The LED likelihood is derived analytically from the binomial/Poisson sampling structure of the ED assay (Section IV.F), and the establishment probability PV→Extinction comes from the authors' prior peer-reviewed derivation (Quirouette et al. 2023), whose stated model assumptions do not include the present target results; it is a mathematical consequence of the stochastic model, not an unverified ansatz or fitted parameter. The acknowledged A549-versus-MDCK mismatch is explicitly stated by the authors as an incorrect simplifying assumption; it is a validity threat to the reported numerical estimates, but it is not circularity. The comparisons among likelihoods, units, and stochastic versus ODE models are in-sample methodological evaluations rather than fitted parameters renamed as predictions. The only notable circular aspect is the self-consistency check used to present Eqn. (2), which is minor because the relation is subsequently used as a modeling conversion rather than as an externally validated prediction.
Assumptions & free parameters
free parameters (6)
- τE (mean eclipse phase duration) =
7 h (mode, SM-IV-LED)
- τI (mean infectious phase duration) =
25 h (mode, SM-IV-LED)
- ρRNA (total virus production rate) =
10^3.1 vRNA/(cell·h)
- ρ (infectious virion production rate) =
10^1.7 IV/(cell·h)
- γ (cells infected per IV entry) =
10^-0.64 cell/IV
- β (IV loss rate due to cell entry) =
10^-6.8 ml/(cell·h)
assumptions (4)
- domain assumption PV→Extinction (Eqn. 1), derived in Quirouette et al. 2023, correctly describes infection establishment in an ED well.
- ad hoc to paper Infections (A549 cells) and ED assays (MDCK cells) share all infection parameters except cell number and volume.
- domain assumption One viral RNA measured by qRT-PCR corresponds to one physical virion, and sampled virions retain the infectivity they had during the infection (no freeze-thaw loss).
- domain assumption The ED well infection process can be modeled by independent Bernoulli trials with per-virion success probability PV→Establishment.
Cite this review
Pith. "Pith review of Does the random nature of cell-virus interactions during in vitro infections affect TCID$_{50}$ measurements and parameter estimation by mathematical models?." pith.science (2026). https://pith.science/paper/K5G2WNSJ
@misc{pith2026241212960,
  author       = {Pith},
  title        = {Pith review of: Does the random nature of cell-virus interactions during in vitro infections affect TCID$_50$ measurements and parameter estimation by mathematical models?},
  year         = {2026},
  howpublished = {\url{https://pith.science/paper/K5G2WNSJ}},
  note         = {Machine review of arXiv:2412.12960}
}
read the original abstract
Endpoint dilution (TCID50) assays cannot count the number of infectious virions (IVs), and instead are limited to counting the number of Specific INfections caused by the sample (SIN). The latter depends not only on whether virions are infectious, but also on the cells and the experimental conditions under which they interact. These interactions are random and controlled by parameters such as the rates at which IVs lose infectivity, enter cells, or fail to replicate following cell entry. Here, stochastic TCID50 assays are simulated to determine how the random number of infected wells relates to the parameters and the number of IVs in a sample. We introduce a new parameter estimation method based on the likelihood of observing a given TCID50 assay outcome given the model-predicted number of IVs in the sample. We then successively evaluate how parameter estimates are affected by the use of: 1) the new likelihood function vs the typical assumption of Gaussian-distributed measurement errors; 2) IV vs SIN units to express virus in the model; and 3) a stochastic vs an ODE model to simulate the course of a virus infection. Unlike previous methods, the new likelihood correctly handles measurements beyond the detection limits, and results in non-Gaussian distributions. Expressing virus using IV units makes it possible to impose physical constraints (e.g. one IV cannot infect more than one cell), and yields more biologically useful parameters (e.g. mutation emergence likelihood depends on the number of IVs, not SIN, produced). Using a stochastic rather than an ODE model we show that the variability observed between replicate in vitro virus infections is consistent with the level of stochasticity introduced by the TCID50 assay, which can be reduced through better assay design. The framework introduced herein offers several important improvements over current methods and should be widely adopted.
Figures


Figures from the paper (17 more)




Reference graph
Works this paper leans on
-
[1]
F. G. Hayden, J. J. Treanor, R. S. Fritz, M. Lobo, R. F. Betts, M. Miller, N. Kinnersley, R. G. Mills, P. Ward, and S. E. Straus, Use of the oral neuraminidase inhibitor oseltamivir in experimental human influenza: Randomized controlled trials for prevention and treatment, JAMA 282, 1240 (1999)
work page 1999
-
[2]
F. G. Hayden, L. Jennings, R. Robson, G. Schiff, H. Jackson, B. Rana, G. McClelland, D. Ipe, N. Roberts, and P. Ward, Oral oseltamivir in human experimental influenza B infection, Antivir. Ther. 5, 205 (2000)
work page 2000
-
[3]
L. Barroso, J. Treanor, L. Gubareva, and F. G. Hayden, Efficacy and tolerability of the oral neuraminidase inhibitor peramivir in experimental human influenza: Randomized, controlled trials for prophylaxis and treatment, Antivir. Ther. 10, 901 (2005)
work page 2005
-
[4]
J. P. DeVincenzo, M. W. McClure, J. A. Symons, H. Fathi, C. Westland, S. Chanda, R. Lambkin-Williams, P. Smith, Q. Zhang, L. Beigelman, L. M. Blatt, and J. Fry, Activity of oral ALS-008176 in a respiratory syncytial virus challenge study, N. Engl. J. Med. 373, 2048 (2015)
work page 2015
-
[5]
F. G. Hayden, N. Sugaya, N. Hirotsu, N. Lee, M. D. de Jong, A. C. Hurt, T. Ishida, H. Sekino, K. Yamada, S. Portsmouth, K. Kawaguchi, T. Shishido, M. Arai, K. Tsuchiya, T. Uehara, A. Watanabe, and Baloxavir Marboxil Investigators Group, Baloxavir marboxil for uncomplicated influenza in adults and adolescents, N. Engl. J. Med. 379, 913 (2018)
work page 2018
-
[6]
M. Stevens, S. Rusch, J. John DeVincenzo, Y.-I. Kim, L. Harrison, E. A. Meals, A. Boyers, J. Fok-Seang, D. Huntjens, N. Lounis, K. Mari¨ en, B. Remmerie, D. Roymans, A. Koul, and R. Verloes, Antiviral activity of oral JNJ-53718678 in healthy adult volunteers challenged with respiratory syncytial virus: A placebo-controlled study, J. Infect. Dis. 218, 748 (2018)
work page 2018
-
[7]
J. DeVincenzo, L. Cass, A. Murray, K. Woodward, E. Meals, M. Coates, L. Daly, V. Wheeler, J. Mori, C. Brindley, A. Davis, M. McCurdy, K. Ito, B. Murray, P. Strong, and G. Rapeport, Safety and antiviral effects of nebulized PC786 in a respiratory syncytial virus challenge study, J. Infect. Dis. 225, 2087 (2022)
work page 2022
-
[8]
J. Hammond, H. Leister-Tebbe, A. Gardner, P. Abreu, W. Bao, W. Wisemandle, M. Baniecki, V. M. Hendrick, B. Damle, A. Sim´ on-Campos, R. Pypstra, J. M. Rusnak, and EPIC-HR Investigators, Oral nirmatrelvir for high-risk, nonhospitalized adults with COVID-19, N. Engl. J. Med. 386, 1397 (2022)
work page 2022
Show all 51 references
-
[9]
J. P. DeVincenzo, T. Wilkinson, A. Vaishnaw, J. Cehelsky, R. Meyers, S. Nochur, L. Harrison, P. Meeking, A. Mann, E. Moane, J. Oxford, R. Pareek, R. Moore, E. Walsh, R. Studholme, P. Dorsett, R. Alvarez, and R. Lambkin-Williams, Viral load drives disease in humans experimental...
2010
-
[10]
M. L. Houben, F. E. J. Coenjaerts, J. W. A. Rossen, M. E. Belderbos, R. W. Hofland, J. L. L. Kimpen, and L. Bont, Disease severity and viral load are correlated in infants with primary respiratory syncytial virus infection in the community, J. Med. Virol. 82, 1266 (2010)
2010
-
[11]
Takeyama, K
A. Takeyama, K. Hashimoto, M. Sato, T. Sato, S. Kanno, K. Takano, M. Ito, M. Katayose, H. Nishimura, Y. Kawasaki, and M. Hosoka, Rhinovirus load and disease severity in children with lower respiratory tract infections, J. Med. Virol. 84, 1135 (2012)
2012
-
[12]
D. R. Feikin, B. M. Alraddadi, M. Qutub, O. Shabouni, A. Curns, I. K. Oboho, S. M. Tomczyk, B. J. Wolff, J. T. Watson, and T. A. Madani, Association of higher MERS-CoV virus load with severe disease and death, Saudi Arabia, 2014, Emerg. Infect. Dis. 21, 2029 (2015)
2015
-
[13]
Granados, A
A. Granados, A. Peci, A. McGeer, and J. B. Gubbay, Influenza and rhinovirus viral load and disease severity in upper respiratory tract infections, J. Clin. Virol. 86, 14 (2017)
2017
-
[14]
Goikhman, Y
Y. Goikhman, Y. Drori, N. Friedman, H. Sherbany, N. Keller, E. Mendelson, R. Pando, and M. Mandelboim, Adenovirus load correlates with respiratory disease severity among hospitalized pediatric patients, Int. J. Infect. Dis. 97, 145 (2020)
2020
-
[15]
McKay, M
B. McKay, M. Ebell, W. Z. Billings, A. P. Dale, Y. Shen, and A. Handel, Associations between relative viral load at diagnosis and influenza A symptoms and recovery, Open Forum Infect. Dis. 7, ofaa494 (2020)
2020
-
[16]
H. M. Creager, T. J. Kieran, H. Zeng, X. Sun, J. A. Pulit-Penaloza, K. E. Holmes, A. F. Johnson, T. M. Tumpey, T. R. Maines, C. A. A. Beauchemin, and J. A. Belser, Utility of human in vitro data in risk assessments of influenza A virus using the ferret model, J. Virol. 97, e01...
2023
-
[17]
T. J. Kieran, X. Sun, T. R. Maines, C. A. A. Beauchemin, and J. A. Belser, Exploring associations between viral titer measurements and disease outcomes in ferrets inoculated with 125 contemporary influenza A viruses, J. Virol.98, e0166123 (2024)
2024
-
[18]
Spearman, The method of ‘right and wrong cases’ (‘constant stimuli’) without gauss’s formulae, Br
C. Spearman, The method of ‘right and wrong cases’ (‘constant stimuli’) without gauss’s formulae, Br. J. Psychol. II, 227 (1908)
1908
-
[19]
K¨ arber, Beitrag zur kollektiven behandlung pharmakologischer reihenversuche, Archiv f
G. K¨ arber, Beitrag zur kollektiven behandlung pharmakologischer reihenversuche, Archiv f. Experiment. Pathol. u. Phar- makol. 162, 480 (1931)
1931
-
[20]
L. J. Reed and H. Muench, A simple method of estimating fifty per cent endpoints, Am. J. Hyg. 27, 493 (1938). 36
1938
-
[21]
Dulbecco, Production of plaques in monolayer tissue cultures by single particles of an animal virus, Proc
R. Dulbecco, Production of plaques in monolayer tissue cultures by single particles of an animal virus, Proc. Natl. Acad. Sci. U. S. A. 38, 747 (1952)
1952
-
[22]
Dulbecco and M
R. Dulbecco and M. Vogt, Biological properties of poliomyelitis viruses as studied by the plaque technique, Ann. N. Y. Acad. Sci. 61, 790 (1955)
1955
-
[23]
N. H. Wulff, M. Tzatzaris, and P. J. Young, Monte Carlo simulation of the Spearman-Kaerber TCID50, J. Clin. Bioinform. 2, 5 (2012)
2012
-
[24]
B. A. Mistry, M. R. D’Orsogna, and T. Chou, The effects of statistical multiplicity of infection on virus quantification and infectivity assays, Biophys. J. 114, 2974 (2018)
2018
-
[25]
Cresta, D
D. Cresta, D. C. Warren, C. Quirouette, A. P. Smith, L. C. Lane, A. M. Smith, and C. A. A. Beauchemin, Time to revisit the endpoint dilution assay and to replace the TCID 50 as a measure of a virus sample’s infection concentration, PLOS Comput. Biol. 17, e1009480 (2021)
2021
-
[26]
J. M. Conway and D. Coombs, A stochastic model of latently infected cell reactivation and viral blip generation in treated HIV patients, PLOS Comput. Biol. 7, e1002033 (2011)
2011
-
[27]
J. E. Pearson, P. Krapivsky, and A. S. Perelson, Stochastic theory of early viral infection: Continuous versus burst production of virions, PLOS Comput. Biol. 7, e1001058 (2011)
2011
-
[28]
J. M. Conway, B. P. Konrad, and D. Coombs, Stochastic analysis of pre- and postexposure prophylaxis against HIV infection, SIAM J. Appl. Math. 73, 904 (2013)
2013
-
[29]
F. S. Heldt, S. Y. Kupke, S. Dorl, U. Reichl, and T. Frensing, Single-cell analysis and stochastic modelling unveil large cell-to-cell variability in influenza A virus infection, Nat Commun. 6, 8938 (2015)
2015
-
[30]
A. W. Yan, P. Cao, and J. M. McCaw, On the extinction probability in models of within-host infection: The role of latency and immunity, J. Math. Biol. 73, 787 (2016)
2016
-
[31]
J. M. Conway and A. S. Perelson, Early HIV infection predictions: Role of viral replication errors, SIAM J. Appl. Math. 78, 1863 (2018)
2018
-
[32]
Czuppon, F
P. Czuppon, F. D´ ebarre, A. Gon¸ calves, O. Tenaillon, A. S. Perelson, J. Guedj, and F. Blanquart, Success of prophylactic antiviral therapy for SARS-CoV-2: Predicted critical efficacies and impact of different drug-specific mechanisms of action, PLOS Comput. Biol. 17, e10087...
2021
-
[33]
Quirouette, D
C. Quirouette, D. Cresta, J. Li, K. P. Wilkie, H. Liang, and C. A. A. Beauchemin, The effect of random virus failure following cell entry on infection outcome and the success of antiviral therapy, Sci. Rep. 13, 17243 (2023), 2208.00637
2023 arXiv
-
[34]
P. F. Simon, M.-A. de La Vega, ´Eric Paradis, E. Mendoza, K. M. Coombs, D. Kobasa, and C. A. A. Beauchemin, Avian influenza viruses that cause highly virulent infections in humans exhibit distinct replicative properties in contrast to human H1N1 viruses, Sci. Rep. 6, 24154 (2016)
2016
-
[35]
Sazonov, D
I. Sazonov, D. Grebennikov, M. Kelbert, A. Meyerhans, and G. Bocharov, Viral infection dynamics model based on a Markov process with time delay between cell infection and progeny production, Mathematics 8, 1207 (2020)
2020
-
[36]
Morris, J
D. Morris, J. Maclean, and A. J. Black, Computation of random time-shift distributions for stochastic population models, J. Math. Biol. 89, 33 (2024), 2306.17331
2024 arXiv
-
[37]
A. W. Yan, J. Zhou, C. A. A. Beauchemin, C. A. Russell, W. S. Barclay, and S. Riley, Quantifying mechanistic traits of influenza viral dynamics using in vitro data, Epidemics 33, 100406 (2020)
2020
-
[38]
B. P. Holder and C. A. A. Beauchemin, Exploring the effect of biological delays in kinetic models of influenza within a host or cell culture, BMC Public Health 11, S10 (2011)
2011
-
[39]
C. A. A. Beauchemin, T. Miura, and S. Iwami, Duration of SHIV production by infected cells is not exponentially distributed: Implications for estimates of infection parameters and antiviral efficacy, Sci. Rep. 7, 42765 (2017)
2017
-
[40]
L. E. Liao, J. Carruthers, S. J. Smither, CL4 Virology Team, S. A. Weller, D. Williamson, T. R. Laws, I. Garc ´ ıa-Dorival, J. Hiscox, B. P. Holder, C. A. A. Beauchemin, A. S. Perelson, M. L´ opez-Garc ´ ıa, G. Lythe, J. N. Barr, and C. Molina-Par ´ ıs, Quantification of Ebola...
2020
-
[41]
Handel, I
A. Handel, I. M. Longini Jr., and R. Antia, Neuraminidase inhibitor resistance in influenza: Assessing the danger of its generation and spread, PLOS Comput. Biol. 3, e240 (2007)
2007
-
[42]
Handel, I
A. Handel, I. M. Longini Jr., and R. Antia, Towards a quantitative understanding of the within-host dynamics of influenza A infections, J. R. Soc. Interface 7, 35 (2010)
2010
-
[43]
A. S. Perelson, L. Rong, and F. G. Hayden, Combination antiviral therapy for influenza: predictions from modeling of human infections, J. Infect. Dis. 205, 1642 (2012)
2012
-
[44]
E. G. Paradis, L. T. Pinilla, B. P. Holder, Y. Abed, G. Boivin, and C. A. A. Beauchemin, Impact of the H275Y and I223V mutations in the neuraminidase of the 2009 pandemic influenza virus in vitro and evaluating experimental reproducibility, PLOS ONE 10, e0126115 (2015)
2015
-
[45]
Stegmann, P
T. Stegmann, P. Schoen, R. Bron, J. Wey, I. Bartoldus, A. Ortiz, J. L. Nieva, and J. Wilschut, Evaluation of viral membrane fusion assays. Comparison of the octadecylrhodamine dequenching assay with the pyrene excimer assay, Biochemistry 32, 11330 (1993)
1993
-
[46]
F. S. Heldt, T. Frensing, and U. Reichl, Modeling the intracellular dynamics of influenza virus replication to understand the control of viral RNA synthesis, J. Virol. 86, 7806 (2012)
2012
-
[47]
C. A. A. Beauchemin, J. J. McSharry, G. L. Drusano, J. T. Nguyen, G. T. Went, R. M. Ribeiro, and A. S. Perelson, Modeling amantadine treatment of influenza A virus in vitro, J. Theor. Biol. 254, 439 (2008)
2008
-
[48]
Noda, Native morphology of influenza virions, Front
T. Noda, Native morphology of influenza virions, Front. Microbiol. 2, 10.3389/fmicb.2011.00269 (2011)
2011 arXiv
-
[49]
L. E. Liao, S. Iwami, and C. A. A. Beauchemin, (In)validating experimentally derived knowledge about influenza A defective interfering particles, J. R. Soc. Interface 13, 20160412 (2016). 37
2016
-
[50]
C. A. A. Beauchemin, phymcmc: A convenient wrapper for emcee(2019)
2019
-
[51]
Foreman-Mackey, D
D. Foreman-Mackey, D. W. Hogg, D. Lang, and J. Goodman, emcee: The MCMC hammer, Publ. Astron. Soc. Pac. 125, 306 (2013)
2013
Reviewed August 11, 2026 · model on record in the stance chip above.
Discussion (0). Continue with ORCID to comment.