REVIEW 3 major objections 6 minor 1 cited by
The liquid-liquid phase transition of hydrogen and its critical point: Analysis from ab initio simulation and a machine-learned potential
T0 review · 3 major / 6 minor · reviewed 2026-08-11 · deepseek-v4-flash
Pith's one-line read Machine-learned finite-size scaling shows that hydrogen's molecular-to-atomic liquid transition is a genuine first-order phase change, with a critical point at 1250 ± 50 K and 155–160 GPa.
desk verdict First finite-size scaling study of the PBE-hydrogen LLPT; the qualitative first-order conclusion is plausible, but the 1250±50 K critical point rests on unquantified fits and MLIP biases. read the letter →
The pith
A machine-rendered reading of the paper's core claim, the machinery that carries it, and where it could break.
The reading
What carries the argument
The machine is a NequIP potential, an E(3)-equivariant graph neural network trained on 54,000 PBE configurations of 96 hydrogen atoms, which reproduces the DFT forces and energies well enough to run 200–2048-atom NPT trajectories for hundreds of picoseconds. The argument runs on finite-size scaling: the density susceptibility $\chi_N=\alpha D$ from a $\tanh$ fit to the equation of state should grow linearly with $N$ for a first-order transition, and the extrapolated $\alpha D/N$ distinguishes a true discontinuity from a size-dependent crossover. A second diagnostic is the potential-energy variance per unit volume, $c=(\langle E^2\rangle-\langle E\rangle^2)/L^3$, whose scaling with $N$ marks the transition and brackets the critical point.
What would settle it
A direct PBE ab initio molecular dynamics run — no machine-learned potential — at 1125 K and about 166 GPa with 1200 or 2048 atoms, long enough to observe several density switches, would settle the order of the transition: a bimodal density histogram whose $\alpha D/N$ extrapolation stays finite confirms first-order behavior, while a unimodal histogram whose width shrinks with system size would refute it. Alternatively, retraining the NequIP model with the molecular-phase pressure offset corrected and checking whether the critical point moves by more than 50 K would test the quoted uncertainty.
Extended reading notes
Core claim
The central claim is that in PBE-hydrogen the liquid-liquid phase transition is a weak first-order transition at temperatures around 1050–1300 K, with a critical point at 1200–1300 K and 155–160 GPa. The decisive evidence is finite-size scaling of the density susceptibility: fitting the density-pressure isotherm to $\rho(P)=D\tanh(\alpha(P-P_t))+\kappa(P-P_t)+\rho_t$ and computing $\chi_N=\alpha D$ gives an $\alpha D/N$ that extrapolates to a clearly finite value as $N\to\infty$ at 1125 K, proving a density discontinuity in the thermodynamic limit, while it vanishes at 1500 K, where the system is a crossover. The energy variance $c=(\langle E^2\rangle-\langle E\rangle^2)/L^3$ grows with system size at 1125 and 1200 K but not at 1300 or 1500 K, bracketing the critical point between 1200 and 1300 K. The paper therefore places the PBE-hydrogen critical point at 1250 ± 50 K, about 250–750 K below earlier estimates, and finds that the transition line meets the melting line near 170 GPa.
Load-bearing premise
The load-bearing premise is that the NequIP potential trained on 96-atom PBE configurations represents the free-energy surface of PBE-hydrogen accurately enough at 200–2048 atoms that its predicted transition order and critical point are unbiased at the quoted level, despite known biases in pressure, molecular bond length, and molecular orientation correlations.
Editorial extensions
If this is right
- In PBE-hydrogen the molecular-to-atomic liquid transition is first-order below roughly 1250 K, so a density discontinuity survives in the thermodynamic limit at temperatures such as 1125 K.
- The critical point is at 1250 ± 50 K and 155–160 GPa, well below the 1500–2000 K range of earlier estimates, placing it near the melting line.
- At 1500 K the same model shows no system-size dependence, so the molecular-to-atomic change there is a smooth crossover, not a transition.
- Because the density jump is only 2–3% of the total density, simulations with fewer than about a thousand atoms cannot reliably distinguish the transition from a crossover.
- The LLPT line likely meets the melting line around 170 GPa, implying a triple point among molecular solid, molecular liquid, and atomic liquid.
Reading between the lines
- If the machine-learned potential's roughly 4 GPa pressure offset in the molecular phase and its 1.46-times-larger quadrupole-quadrupole interaction are systematic rather than random, the true PBE critical point could shift beyond the quoted ±50 K; the paper does not propagate these biases into the uncertainty.
- The same finite-size scaling protocol could be applied to a potential trained on quantum Monte Carlo energies instead of PBE, directly testing whether the LLPT and its critical point survive in a more accurate model of hydrogen with quantum protons.
- If the critical point is as close to melting as this study suggests, static experimental probes of the LLPT may need to access metastable liquid states, much as in the proposed liquid-liquid transition of water.
- The tanh form of the equation-of-state fit assumes the transition is in the 3D Ising universality class; near the critical point, corrections to scaling from the lack of particle-hole symmetry could alter the inferred critical temperature, so the 50 K error bar may underestimate model uncertainty.
Editorial analysis
A structured set of objections, weighed in public.
Referee Report
Summary. The paper studies the liquid-liquid phase transition in hydrogen modeled with the PBE exchange-correlation functional and classical protons (PBE-hydrogen). It trains a NequIP equivariant neural network potential on 96-atom PBE configurations, validates it against 200-atom and 2048-atom AIMD data, and then performs long NPT molecular dynamics with the MLIP for systems of 200 to 2048 atoms. The authors fit the density-pressure equation of state to a tanh form (Eq. 1), extract the maximum susceptibility alpha*D (Eq. 2), and plot alpha*D/N versus 1/N. From the finite extrapolated intercept at T=1125 K and the vanishing intercept at 1500 K, together with the system-size dependence of energy fluctuations, they conclude that PBE-hydrogen has a genuine first-order LLPT ending at a critical point at 1250 +/- 50 K and 155-160 GPa, substantially lower than prior estimates and close to the melting line.
Significance. If the conclusion holds, this is an important step: it demonstrates that finite-size scaling can be applied to ab initio-quality hydrogen simulations through machine-learned potentials, and it would help settle a long-standing ambiguity between a first-order transition and a smooth crossover. The paper's strengths are its use of a standard FSS framework, direct comparisons to external AIMD data (200-atom VASP runs and Karasiev's 2048-atom runs), explicit discussion of MLIP validation pitfalls, and public training data. However, the central first-order and critical-point claims currently rest on an unquantified tanh-fit extrapolation and on the fidelity of a single MLIP in exactly the phase region where the documented model biases are largest. The significance is therefore conditional on the requested robustness checks.
major comments (3)
- [IV A, Eq. (1)-(2), Fig. 7] The proof that the transition is first-order rests on the claim that lim_{N->infinity} alpha*D/N is finite at T=1125 K. The paper reports no error bars on alpha, D, or the extrapolated intercept, and no goodness-of-fit for the tanh fits. With only four system sizes (N=400, 768, 1200, 2048) and five fitted parameters (D, alpha, kappa, P_t, rho_t), alpha and D are strongly correlated, and unweighted least-squares fits of this functional form can produce a spurious finite intercept. Moreover, the N=2048 trajectory at 175 GPa shows only five density switches in 200 ps (Fig. 4), and Appendix C states that statistical errors are not well estimated in the critical region because of critical slowing down; both facts undermine the reliability of the fitted density at the transition. The authors should provide bootstrap or block-ensemble uncertainties on alpha*D/N, report chi-squared per degree of freedom for each fit, and show the extrapolated intercept with confidence intervals. If the intercept at 1125 K is consistent with zero within uncertainty, the first-order conclusion is not established.
- [IV C and App. C] All evidence for the first-order character and the critical point comes from the NequIP model, not from direct DFT trajectories, so the attribution to PBE-hydrogen requires that the model biases do not change the transition order or shift the critical point. The paper documents a roughly 4 GPa pressure offset in the molecular phase (Fig. 2), stronger molecular ordering with shorter bonds (Fig. 13), and a quadrupole-quadrupole correlation 1.46 times larger than the PBE reference (Fig. 14). These biases are concentrated in the molecular liquid, precisely the phase whose relative stability determines the transition. The statement in Section IV C that MLIP imperfections are ruled out as a main source of error is therefore too strong. I request a sensitivity analysis: for example, retrain with different loss weights or cutoffs, or compare the FSS intercept and critical pressure between several MLIPs; alternatively, run direct AIMD FSS at the smallest sizes to anchor the MLIP trend. Without such checks, the quoted error 1250 +/- 50 K should not be interpreted as an uncertainty on PBE-hydrogen.
- [IV A, Fig. 8] The critical point estimate T_c=1250 +/- 50 K is inferred from the energy fluctuation variance c (Eq. 3) by the following criterion: at T=1200 K, c increases linearly with system size, while at T=1300 K the maxima for the largest systems overlap. This is a qualitative distinction; no quantitative FSS analysis of c is performed, and the authors state that the joint distribution data are too sparse for a scaling collapse. The text does not explain how 1250 +/- 50 is obtained from the four simulated temperatures (1125, 1200, 1300, 1500 K), nor how the uncertainty is estimated. The authors should state the criterion used to interpolate between 1200 K and 1300 K and provide a quantitative measure, such as the ratio c(N)/N as a function of N and T or a fit to a scaling form. This step is load-bearing for the central claim of a critical point at 1250 +/- 50 K.
minor comments (6)
- [Fig. 2 caption] The caption says the EOS is shown at four temperatures between 1100 K and 1500 K, but the figure legend lists 1100, 1200, 1300, and 1400 K; the text should be corrected.
- [Eq. (3) and Fig. 8] Equation (3) defines c as the variance of the total potential energy divided by L^3, i.e., per unit volume, while the Fig. 8 caption describes c as 'per atom' and the main text says 'per unit volume'; these differ by a factor N. Please make the normalization consistent.
- [IV A, Fig. 7] The sentence 'For system sizes varying from N=200 to N=2048' conflicts with the figure caption, which says the fits use the four largest sizes and treat N=200 as an extra check; the main text should state both facts clearly.
- [App. C, Fig. 12] The sentence 'The statistical error is smaller than symbol size, but is not well estimated in the critical region due to critical slowing down' is internally contradictory; please report how error bars were computed and where they are unreliable.
- [Data availability] The models are 'available on demand'; for reproducibility, the trained NequIP parameters should be deposited with a persistent identifier alongside the training data.
- [App. D, Eq. (D1)] The bonded-pair probability p_B(r) uses fitted parameters C=4.29 A^-1 and r0=0.766 A; please state the fitting procedure and data used, since these parameters feed the molecular analysis in Fig. 5.
Circularity Check
No circularity: the LLPT critical point emerges from finite-size scaling of a MLIP trained only on DFT forces/energies, with external AIMD validation.
full rationale
The paper's central claim, a first-order liquid-liquid phase transition in PBE-hydrogen ending at a critical point near 1250 K and 155-160 GPa, is not an input to the machine-learned potential. The NequIP potential is trained on DFT energies, forces, and stresses from 96-atom configurations, but the training data contain no phase labels, no transition pressures, and no critical-point values. The first-order character is established by a fresh finite-size scaling analysis: density-pressure isotherms from NPT simulations at four system sizes are fitted with the phenomenological tanh form of Eq. (1), and the resulting susceptibility maximum alpha-D is extrapolated in 1/N in Fig. 7. The finite intercept at 1125 K and the vanishing intercept at 1500 K are outputs of that analysis, not fitted constants reused as predictions. The critical-point estimate is then cross-checked by the independent energy-fluctuation scaling in Fig. 8. The self-cited training database (Niu et al., Ref. 23) supplies raw DFT data rather than an unverified theorem, and the model is validated against genuinely external AIMD data: 200-atom VASP calculations (Fig. 2, Fig. 3) and Karasiev's 2048-atom AIMD (Fig. 12). The acknowledged MLIP biases (about 4 GPa pressure offset in the molecular phase, stronger molecular ordering, and 1.46x quadrupole-quadrupole correlation) are accuracy concerns that could shift the transition location, but they do not make the derivation circular. The skeptic's worry about missing bootstrap error bars on the alpha-D intercept is a statistical robustness issue, not a reduction of the result to its inputs. No equation, fitted parameter, or cited result is equivalent by construction to the claimed prediction.
Assumptions & free parameters
free parameters (3)
- NequIP network weights =
trained on 48,000 of 54,000 PBE configurations, 100 epochs
- tanh EOS fit parameters D, alpha, kappa, P_t, rho_t =
per temperature and system size (not tabulated)
- persistent-bonding probability parameters C and r0 =
C = 4.29 per Ångstrom, r0 = 0.766 Ångstrom
assumptions (4)
- standard math Finite-size scaling of the double-Gaussian/tanh approximation: the maximum susceptibility of the order parameter to its conjugate field scales linearly with particle number for a first-order transition
- domain assumption Density is a valid scalar order parameter for the LLPT, placing it in the 3D Ising and lattice-gas universality class
- domain assumption The NequIP model generalizes from 96-atom training data to 400 to 2048 atom coexistence sampling without changing transition order or shifting the critical point beyond ±50 K
- domain assumption Classical protons with the PBE functional define the model system PBE-hydrogen, so nuclear quantum effects and functional choice are out of scope
Cite this review
Pith. "Pith review of The liquid-liquid phase transition of hydrogen and its critical point: Analysis from ab initio simulation and a machine-learned potential." pith.science (2026). https://pith.science/paper/JCBUNWWH
@misc{pith2026241214953,
  author       = {Pith},
  title        = {Pith review of: The liquid-liquid phase transition of hydrogen and its critical point: Analysis from ab initio simulation and a machine-learned potential},
  year         = {2026},
  howpublished = {\url{https://pith.science/paper/JCBUNWWH}},
  note         = {Machine review of arXiv:2412.14953}
}
read the original abstract
We simulate high-pressure hydrogen in its liquid phase close to molecular dissociation using a machine-learned interatomic potential. The model is trained with density functional theory (DFT) forces and energies, with the Perdew-Burke-Ernzerhof (PBE) exchange-correlation functional. We show that an accurate NequIP model, an E(3)-equivariant neural network potential, accurately reproduces the phase transition present in PBE. Moreover, the computational efficiency of this model allows for substantially longer molecular dynamics trajectories, enabling us to perform a finite-size scaling (FSS) analysis to distinguish between a crossover and a true first-order phase transition. We locate the critical point of this transition, the liquid-liquid phase transition (LLPT), at 1200-1300 K and 155-160 GPa, a temperature lower than most previous estimates and close to the melting transition.
Figures


Figures from the paper (12 more)




Forward citations
Cited by 1 Pith paper
-
Deep variational free energy prediction of dense hydrogen solid at 1200K
At 1200 K, deep variational free energy calculations find a transition from atomic liquid to molecular crystal in dense hydrogen at about 180 GPa, with kinks in pressure and entropy.
Reference graph
Works this paper leans on
-
[1]
100 120 140 160 180 200 Pressure (GPa) 800 1000 1200 1400 1600 1800 2000Temperature (K) Karasiev 2021 Morales 2010 Lorenzen 2010 LLPT, this work Karasiev 2021 Morales 2010 Lorenzen 2010 LLPT, this work FIG
work page 2021
-
[3]
The lines with symbols correspond to es- timations of the LLPT
Phase diagram of PBE-hydrogen obtained from dif- ferent calculations. The lines with symbols correspond to es- timations of the LLPT. The dark blue curve with squares corresponds to our estimation, the dashed part of the line rep- resents our estimation of the uncertainty in the critical point. Karasiev et al. 21 did not give an estimation for the critica...
work page 2000
-
[4]
(b) rs histogram for the same simulation
(a) Instantaneous rs value as a function of the simula- tion time for 2048 particles at P = 175 GPa and T = 1050 K. (b) rs histogram for the same simulation. The vertical line at rs = 1 .44 indicates the threshold used in panel (d). (c) Structure factor averaged over all time steps. (d) Radial dis- tribution function computed for configurations with rs > ...
-
[5]
Comparison between proton-proton radial distribu- tion functions from PBE (closed circles) and Nequip (lines) models for the systems of 200 atoms at T=1100K. Left panel: rs = 1.466 (0.855 gcm −3) in the molecular phase,right panel: rs = 1 .43 (0.922 gcm −3) in the atomic phase. PBE trajec- tories were 100fs and Nequip trajectories 250ps durations re- spec...
-
[6]
Average density as a function of pressure in N P Tsimulations for different system sizes using the Nequip MLIP model. Left 1125 K, right 1500 K. Dashed lines highlight the density difference between and low and high pressure phases. In both plots, the 200 atom EOS is not shown for clarity. Statistical error on ⟨ρ⟩ is indicated by small bars and do not exc...
-
[8]
Note that the time between jumps is rather long for this system. Only five jumps occurred in 200 ps, which makes an ab-initio study of the transition in this 2048 atom sys- tem costly. We show a direct comparison with the latter in fig
-
[9]
This shows two modes merging as the temperature increases. Close to the crit- ical point, the non-regular behavior of the distribution which emerges for large system size, is universal. How- ever, our data is too sparse to use the finite-size scaling behavior of the joint distribution. From Fig. 9 we may simply expect the critical point to occur when the ...
-
[12]
Variance of the potential energy per atom, c, for N = 768 , 1200 and 2048 atoms at 4 different temperatures from simulations in the N P Tensemble. −14.6 −14.5 1.43 1.44 1.45 rs p=175 GPa, T=1050 K −14.65 −14.60 −14.55 1.44 1.45 1.46 p=166 GPa, T=1125 K −14.7 −14.6 e (meV/atom) 1.46 1.47 rs p=158 GPa, T=1200 K −14.80 −14.75 e (meV/atom) 1.51 1.52 p=128 GPa...
Show all 17 references
-
[14]
The other lines are estimations of the melting temperature using AIMD with a PBE functional 13,42,43. C. Comparison with previous works The LLPT has been predicted in many previous works. In Fig. 1 we show those for classical hydrogen that use a PBE-DFT potential. We note that...
1935 arXiv
-
[17]
21 (blue curve and points) and the Nequip model (orange)
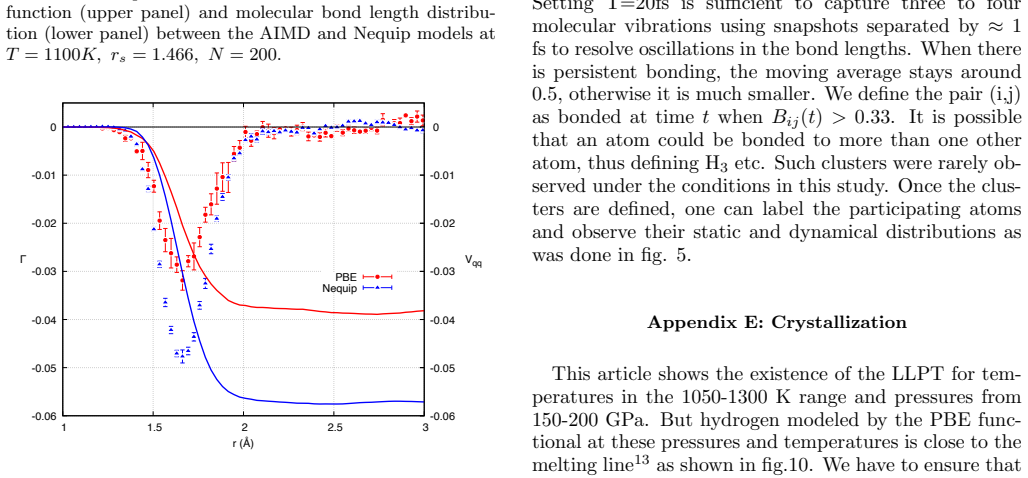
Comparison of density versus temperature between AIMD from ref. 21 (blue curve and points) and the Nequip model (orange). Both simulations used 2048 atoms with an NPT ensemble at 200 GPa. length distribution between the two models. Again we see a good but not perfect agreement...
-
[19]
We will refer to this as PBE-hydrogen
In this work, we restrict the scope of investigation from actual hydrogen to the understanding of hydrogen mod- eled with a Perdew-Burke-Ernzerhof (PBE) density func- tional and using classical protons. We will refer to this as PBE-hydrogen. We make this assumption for several...
2024 arXiv
-
[21]
Despite the imperfections, the previous simulation-based benchmarks showed quantita- tively good agreement, encouraging us to use the model for our LLPT study. IV. EXISTENCE, LOCA TION AND ORDER OF THE LIQUID-LIQUID PHASE TRANSITION To determine the location of the LLPT line a...
-
[23]
The current study used 54,000 config- urations with the energies, forces and stresses computed using the PBE functional
The database contains hydrogen configurations with 96 atoms in both the solid and liquid states at pressures between 50 and 200 GPa and at temperatures between 600 and 2000 K. The current study used 54,000 config- urations with the energies, forces and stresses computed using ...
2000
-
[24]
Figure 7 plots αD/N as a function of 1 /N. For system sizes varying from N = 200 to N = 2048, the extrapolated value limN →∞ αD/N remains clearly finite for T= 1125 K, proving that the system undergoes a first-order phase transition. It vanishes at 1500 K. In between lies the ...
-
[45]
Finally, Nequip allows for a stress error term in the loss function of eq
Hence we increased the value of λE so that it would dominate the loss function, even if the force errors are slightly higher. Finally, Nequip allows for a stress error term in the loss function of eq. (B1). We did not systematically investi- gate λS, but found that having a no...
-
[2022]
Hydrogen under pressure as a benchmark for machine-learning interatomic potentials,
pp. 11423–11436. 32 B. Cheng, G. Mazzola, C. J. Pickard, and M. Ceriotti, Nature 585, 217 (2020). 33 X. Fu, Z. Wu, W. Wang, T. Xie, S. Keten, R. Gomez-Bombarelli, and T. Jaakkola, arXiv preprint arXiv:2210.07237 (2022), https://doi.org/10.48550/arXiv.2210.07237. 34 T. Bischoff...
-
[2048]
Simulations are at least 250ps long
Pressures with the maximum variance of the energy at a given temperature are shown. Simulations are at least 250ps long. The energy and density is sampled each 25 fs and is shown as a dot. point will be inside the solid molecular hydrogen phase. As shown in App. C the Nequip m...
2023
Reviewed August 11, 2026 · model on record in the stance chip above.
Discussion (0). Continue with ORCID to comment.