REVIEW 4 major objections 5 minor 50 references
A linear regression model for quantile function data applied to paired pulmonary 3d CT scans
T0 review · 4 major / 5 minor · reviewed 2026-08-11 · deepseek-v4-flash
Pith's one-line read A fully parametric linear regression model for quantile function data yields closed-form estimators, confidence intervals, and residual densities for paired CT lung scans.
desk verdict A genuine methodological contribution with closed-form inference for quantile-function regression, but the d=1 Gaussian restriction is unvalidated and the clinical claims rest on it. read the letter →
The pith
A machine-rendered reading of the paper's core claim, the machinery that carries it, and where it could break.
The reading
What carries the argument
The load-bearing object is the space $Q_1^2$ of Gaussian quantile functions, where every quantile curve has the form $q(p) = a_0 + a_1 \Phi^{-1}(p)$. This restriction reduces each patient's entire lung voxel distribution to two scalars (mean and standard deviation), and the regression model becomes a bivariate linear model on these scalars. The errors $E_i$ are built from independent normal and exponential coefficients, giving a quantile normal-exponential distribution and making the likelihood tractable: the maximum-likelihood estimators of the intercept and slope on the means are the usual Gaussian linear-regression estimators, while the slope on the centered quantile curve is the minimum of the patient-wise ratio of post- to pre-treatment standard deviations. Explicit pivots for $\beta_2$ and the exponential scale $\beta$ follow from the memoryless property of the exponential distribution, which is what makes closed-form confidence intervals possible.
What would settle it
Re-fit the analysis with the polynomial degree $d$ chosen by BIC (allowing $d > 1$) on the same 44 patients and compare the empirical quantile functions to their Gaussian projections; if the average $L^2$ approximation error is large relative to the noise variance, or if the $\beta_2$ confidence interval shifts materially or crosses 1, the Gaussian restriction decides the central claim.
Extended reading notes
Core claim
The central discovery is a fully parametric linear regression model for quantile function data that supports closed-form statistical inference, analogous to ordinary least squares. Under the restriction to Gaussian quantile functions, each pre-treatment quantile function is represented by its mean and standard deviation, and the post-treatment quantile function is modeled as $Q_{Y,i} = \beta_0 + \beta_1 \mu_{q_{x,i}} + \beta_2 q_{x,i}^c + E_i$, with errors following a quantile normal-exponential distribution. The paper derives explicit maximum-likelihood estimators for all five parameters, their exact sampling distributions, pivots, and confidence intervals, as well as an approximate density for residual quantile functions and a confidence region for the mean response of a new patient. In the lung application, the estimate $\beta_2 = 0.638$ with 95% CI $[0.614, 0.647]$ is the key result: since $\beta_2 < 1$, the post-treatment quantile curves are shrunk toward their mean, implying lower variability of Hounsfield units and, per the clinical hypothesis, reduced air trapping.
Load-bearing premise
The whole inferential chain assumes each patient's pre- and post-treatment lung-density distributions are adequately described by Gaussian quantile functions, and that the fitted pre-treatment means and standard deviations are exact covariates with no estimation error; if either fails, the confidence intervals and the $-746.4$ HU threshold no longer have their stated interpretation.
Editorial extensions
If this is right
- If the model is correct, $\beta_2 < 1$ provides a quantitative, scan-derived biomarker for air-trapping improvement after one year of Benralizumab treatment.
- Clinicians can apply the method to any paired quantile-function dataset and obtain p-values and confidence intervals with the same ease as classical linear regression.
- The threshold $-746.4$ HU derived from $\beta_0$ and $\beta_1$ gives a baseline severity level above which a majority of patients (75% in this cohort) show measurable improvement.
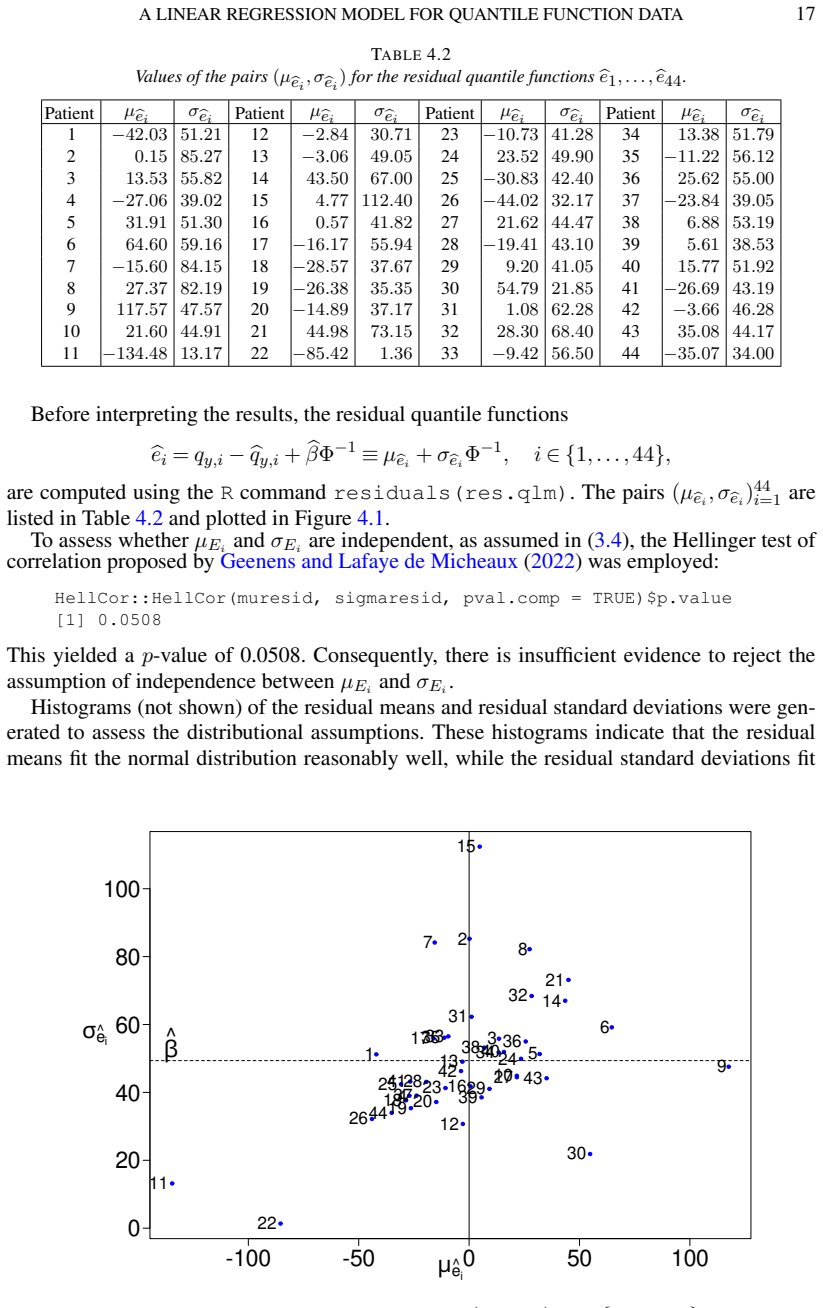
- The residual quantile functions provide a per-patient diagnostic tool, flagging outliers such as patients #9 and #11 for chart review.
- The method sets up an extension to polynomial degrees $d > 1$, which would allow non-Gaussian quantile shapes at the cost of losing explicit formulas.
Reading between the lines
- If the Gaussian quantile projection is a poor approximation to the actual CT voxel distributions, the reported confidence intervals may understate uncertainty, since the pre-treatment $(\mu, \sigma)$ values are estimated rather than known covariates; a simulation study that resamples the voxel-level data would quantify this.
- The method could be adapted to test treatment effects at the lobe level by applying the same regression separately to segmented lobes, which the authors suggest and which would preserve spatial information.
- Because the error distribution conflates measurement error with biological noise, the $\beta_2$ estimate likely reflects attenuation bias from noisy $\sigma_{q_x}$; a measurement-error variant of the model is a natural next step.
Signed reviews
Editorial analysis
A structured set of objections, weighed in public.
Referee Report
Summary. The paper proposes a fully parametric linear regression model for quantile function data, QY,i = β0 + β1 μ_qx,i + β2 q^c_x,i + E_i, with errors following a quantile normal-exponential distribution, and derives explicit maximum likelihood estimators, unbiased versions, pivot distributions, confidence intervals, and an approximate confidence region for a new mean response. The methodology is applied to paired pre- and post-treatment CT scans of 44 asthma patients, after projecting each patient's empirical Hounsfield-unit quantile function onto Gaussian quantile functions (d = 1). The main reported findings are β2 = 0.638 (95% CI 0.614 to 0.647), interpreted as reduced post-treatment variability, and a pre-treatment mean threshold of −746.4 HU above which 75% of severe patients show a positive response.
Significance. If the model assumptions hold, the paper makes a useful theoretical contribution: it provides a rare quantile-function regression model with explicit finite-sample distributions for all estimators and closed-form confidence intervals, and the derivations in Sections 6 and 7 are detailed and appear internally consistent. The paper also ships reproducible R code and data. The countervailing issue is that all inference is performed on Gaussian (d = 1) projections of the quantile functions, and the application does not validate this projection or the exponential error assumption; there is also no simulation evidence for the coverage of the approximate confidence regions. Thus the practical significance for the CT application is not yet established, although the theoretical framework is promising and worth developing further.
major comments (4)
- [Section 2.2 and Section 4] The paper's central inference is performed on Gaussian (d = 1) projections, but the adequacy of this projection is never demonstrated. Section 2.2 introduces a BIC procedure to select the polynomial degree d, yet Section 3.2 and Section 4 simply set d = 1 'as a proof-of-concept' and report no BIC-selected degrees, no L2 projection errors, and no visual comparison between the empirical quantile functions and the fitted Gaussian quantile functions. Since q_x,i and Q_Y,i in model (3.3) are replaced by (μ_qx,i, σ_qx,i) and (μ_qy,i, σ_qy,i), and since the clinical statements in Section 4.1 (β2 = 0.638, the −746.4 HU threshold, the 75% response rate) are expressed in those Gaussian parameters, poor Gaussian fit would sever the link between the regression outputs and the actual CT HU distributions. Please report the projection diagnostics (e.g., the projection norm available from Proposition 6.1), the BIC-selected degrees for each patient, and a sensitivity analysis showing how the estimates and threshold change when d = 2 is used or when the empirical quantile functions enter the analysis directly.
- [Section 3.2, model (3.3)] The covariates (μ_qx,i, σ_qx,i) are assumed non-random, but they are estimated from segmented images via a threshold-based segmentation and then orthogonal projection onto Q^2_1. With n = 44, the reported 95% confidence interval for β2 is extremely narrow (0.614 to 0.647), and this width reflects only the randomness in Q_Y,i under the model, not uncertainty in the preprocessing. The manuscript should either justify that the segmentation and projection variability is negligible (e.g., by repeating the analysis with different segmentation thresholds and with d = 1 versus d = 2) or incorporate this variability into the inference. As written, the confidence statements in Corollary 3.5 and Section 4.1 condition on the exact Gaussian projections being the true covariates.
- [Section 3.3 (Proposition 3.6) and Section 4] No simulation study is included to verify finite-sample behavior. The confidence intervals in Corollary 3.5 rest on exact sampling distributions under model (3.3), but the confidence region in Proposition 3.6 is only approximate because it plugs estimators into the density, and the residual-density p-values in Section 4 are also based on plug-in densities. With n = 44 and a non-normal pivot for β2, the actual coverage of these procedures is unknown. A simulation study under model (3.3) reporting coverage of the confidence intervals and of CR_{1−α}, together with the type I error of the test H0: β2 ≥ 1, would directly address this gap.
- [Section 4, residual diagnostics] The manuscript reports that the residual standard deviations fit the exponential distribution 'to a lesser extent', with mass concentrated in the center at the expense of the left tail, and proceeds because the exponential assumption enables explicit formulas. This is the distributional assumption on which all inference about β2 and β rests, so a qualitative histogram is not sufficient. Please add a formal goodness-of-fit assessment for the exponential error component (e.g., tests of exponentiality of the residual scale components or a likelihood-ratio comparison with a Gamma or Weibull error family) and show that the conclusion β2 < 1 and the reported confidence interval are robust to this choice. The p-value of 0.0508 from the Hellinger correlation test addresses only the independence of μ_E and σ_E, not the marginal exponential assumption.
minor comments (5)
- [Section 4.1] The threshold −746.4 HU and the responder rates (36% and 75%) are derived from the estimated coefficients β0 and β1, but no standard error or confidence interval is provided for these derived quantities; a delta-method or bootstrap interval would help calibrate the clinical claims.
- [Section 4, R output] In the console output, the statistic for β2hat is printed as −0.007, which is inconsistent with the estimate 0.638 and standard error 0.0088; please correct the formatting or explain what is being reported.
- [Introduction, Section 1] The statement that none of the existing Wasserstein regression techniques 'provide the capability for inference' is broad; for instance, Chen, Lin and Müller (2023) and related work provide asymptotic inference for Wasserstein regression. Please qualify the statement to 'no closed-form finite-sample inference' or cite the relevant inference results.
- [Figures 3.3 and 3.4] The interactive 3D widgets are referenced by external URLs; for archival reproducibility, please embed static versions as supplementary material or provide them in the GitHub repository.
- [Throughout] There are several typographical errors, including 'practionners' in Section 5 and 'Morevover' in Section 4.1; a careful proofreading pass is needed.
Circularity Check
No significant circularity: the parametric estimators and confidence intervals are derived from the stated likelihood, not from the fitted quantities they are used to interpret.
full rationale
The paper's derivation chain is self-contained. Model (3.3) specifies QY,i = β0 + β1 μ_qx,i + β2 q^c_x,i + Ei with Ei ~ QNE(0, σ², β, 0). Proposition 3.2 derives the maximum likelihood estimators from the product of a normal likelihood for μ_QY,i and a shifted exponential likelihood for σ_QY,i; Proposition 3.4 and Corollary 3.5 derive the pivots and confidence intervals from those exact distributions. None of these estimators is fitted to the quantity it is later used to 'predict': β2 is the MLE/ corrected minimum ratio under the exponential-scale model, and its confidence interval follows from the Pareto-Type II pivot. The d = 1 restriction to Gaussian quantile functions is an unvalidated modeling assumption—the paper does not report BIC-selected degrees or projection errors—but an unvalidated assumption is not circularity; it is a correctness or validity risk. The self-citations (Béclin 2024 for segmentation details, Geenens and Lafaye de Micheaux 2022 for the Hellinger correlation test, and the GitHub repository) are supporting tools rather than load-bearing steps in the statistical derivation, so they do not make the argument circular. The threshold −746.4 HU and the 36%/75% response rates in Section 4.1 are in-sample interpretive summaries built from the fitted β0 and β1; if 'positive effect' is taken to mean a positive fitted value, then the threshold is simply the zero of that fitted equation and the severe-subgroup claim is tautological rather than an independent empirical finding. However, this passage is an interpretation of the fitted model, not part of the derivation of the estimators or confidence intervals, and the core statistical content remains independent of it. Overall, the central inference machinery is not circular; the score reflects minor self-citation and a borderline interpretive passage, not a circular derivation.
Assumptions & free parameters
free parameters (3)
- beta0, beta1, beta2, sigma2, beta =
-85.92, 0.8838, 0.6384, 1616.84, 49.36
- Polynomial degree d =
1
- Threshold -746.4 HU =
-746.4 HU
assumptions (5)
- domain assumption The error terms in model (3.3) are iid QNE(0, sigma2, beta, 0), i.e., a normal-exponential distribution on quantile functions.
- domain assumption The pre-treatment quantile functions (mu_qx,i, sigma_qx,i) are deterministic, not affected by estimation error.
- domain assumption The empirical HU distributions are adequately approximated by Gaussian quantile functions (d = 1).
- domain assumption The random components mu_Ei and sigma_Ei are independent.
- standard math Standard distribution theory for normal, chi-square, exponential, gamma, and Pareto distributions, and the isometry between quantile functions and Wasserstein space.
invented entities (1)
-
QNE distribution (quantile normal-exponential)
Cite this review
Pith. "Pith review of A linear regression model for quantile function data applied to paired pulmonary 3d CT scans." pith.science (2026). https://pith.science/paper/27OCAGJK
@misc{pith2026241215049,
  author       = {Pith},
  title        = {Pith review of: A linear regression model for quantile function data applied to paired pulmonary 3d CT scans},
  year         = {2026},
  howpublished = {\url{https://pith.science/paper/27OCAGJK}},
  note         = {Machine review of arXiv:2412.15049}
}
read the original abstract
This paper introduces a new objective measure for assessing treatment response in asthmatic patients using computed tomography (CT) imaging data. For each patient, CT scans were obtained before and after one year of monoclonal antibody treatment. Following image segmentation, the Hounsfield unit (HU) values of the voxels were encoded through quantile functions. It is hypothesized that patients with improved conditions after treatment will exhibit better expiration, reflected in higher HU values and an upward shift in the quantile curve. To objectively measure treatment response, a novel linear regression model on quantile functions is developed, drawing inspiration from Verde and Irpino (2010). Unlike their framework, the proposed model is parametric and incorporates distributional assumptions on the errors, enabling statistical inference. The model allows for the explicit calculation of regression coefficient estimators and confidence intervals, similar to conventional linear regression. The corresponding data and R code are available on GitHub to facilitate the reproducibility of the analyses presented.
Figures


Figures from the paper (7 more)




Reference graph
Works this paper leans on
-
[1]
write newline
" write newline "" before.all 'output.state := FUNCTION format.url url empty "" url if FUNCTION article output.bibitem format.authors "author" output.check author format.key output output.year.check new.block format.title "title" output.check new.block crossref missing format.jour.vol output format.article.crossref output.nonnull format.pages output if ne...
-
[2]
bphdthesis [author] B\'eclin , M. F. M. F. ( 2024 ). \'Elaboration de mod\`eles intelligents \`a partir des donn\'ees d'imagerie scanner de patients sous traitement au Benralizumab , PhD thesis , Universit\'e de Montpellier , Montpellier, France . bphdthesis
work page 2024
-
[3]
bmisc [author] B\'eclin , M. F. M. F. , Lafaye de Micheaux , P. P. , Molinari , N. N. Ouimet , F. F. ( 2024 ). Quantile F unction R egression . Available online at https://github.com/FredericOuimetMcGill/QuantileFunctionRegression https://github.com/FredericOuimetMcGill/QuantileFunctionRegression . bmisc
work page 2024
-
[4]
barticle [author] Beyaztas , U. U. , Shang , H. L. H. L. Alin , A. A. ( 2022 ). Function-on-function partial quantile regression . Journal of Agricultural, Biological and Environmental Statistics 27 149--174 . 10.1007/s13253-021-00477-9 barticle
-
[5]
barticle [author] Beyaztas , U. U. , Shang , H. L. H. L. Saricam , S. S. ( 2024 ). Penalized function-on-function linear quantile regression . Computational Statistics 29 pp. 10.1007/s00180-024-01494-1 barticle
-
[6]
barticle [author] Beyaztas , U. U. , Tez , M. M. Shang , H. L. H. L. ( 2024 ). Robust scalar-on-function partial quantile regression . Journal of Applied Statistics 51 1359--1377 . 10.1080/02664763.2023.2202464 4753760 barticle
arXiv 2024
-
[7]
bincollection [author] Blanke , D. D. Bosq , D. D. ( 2021 ). Piecewise linear continuous estimators of the quantile function . In Advances in contemporary statistics and econometrics--- F estschrift in honor of C hristine T homas- A gnan ( A. A. Daouia A. A. Ruiz-Gazen , eds.) 9 , 161--175 . Springer, Cham . 10.1007/978-3-030-73249-3_9 4299279 bincollection
-
[8]
barticle [author] Bonneel , N. N. , Peyr\'e , G. G. Cuturi , M. M. ( 2016 ). W asserstein barycentric coordinates: histogram regression using optimal transport . ACM Transactions on Graphics Article No. 71, 1--10. 10.1145/2897824.2925918 barticle
arXiv 2016
Show all 50 references
-
[9]
barticle [author] Cabon , Y. Y. , Suehs , C. C. , Bommart , S. S. , Vachier , I. I. , Marin , G. G. , Bourdin , A. A. Molinari , N. N. ( 2019 ). k-nearest neighbor curves in imaging data classification . Frontiers in Applied Mathematics and Statistics 5 11 pp. 10.3389/fams.201...
2019
-
[10]
barticle [author] Cardot , H. H. , Crambes , C. C. Sarda , P. P. ( 2005 ). Quantile regression when the covariates are functions . Journal of Nonparametric Statistics 17 841--856 . 10.1080/10485250500303015 2180369 barticle
2005 doi
-
[11]
barticle [author] Chen , Y. Y. , Lin , Z. Z. M\" u ller , H. G. H. G. ( 2023 ). W asserstein regression . Journal of the American Statistical Association 118 869--882 . 10.1080/01621459.2021.1956937 4595462 barticle
2023
-
[12]
barticle [author] Chen , K. K. M\"uller , H. G. H. G. ( 2012 ). Conditional quantile analysis when covariates are functions, with application to growth data . Journal of the Royal Statistical Society: Series B (Statistical Methodology) 74 67--89 . 10.1111/j.1467-9868.2011.0100...
2012
-
[13]
barticle [author] Chen , L. A. L. A. Welsh , A. H. A. H. ( 2002 ). Distribution-function-based bivariate quantiles . Journal of Multivariate Analysis 83 208--231 . 10.1006/jmva.2001.2043 1934981 barticle
2002
-
[14]
bbook [author] Cleveland , W. S. W. S. ( 2004 ). The E lements of G raphing D ata , 2 ed. Hobart Press , Summit, NJ . bbook
2004
-
[15]
barticle [author] Dias , S. S. Brito , P. P. ( 2015 ). Linear regression model with histogram-valued variables . Statistical Analysis and Data Mining 8 75--113 . 10.1002/sam.11260 3342982 barticle
2015 doi
-
[16]
barticle [author] Galb\'an , C. J. C. J. , Han , M. K. M. K. , Boes , J. L. J. L. , Chughtai , K. A. K. A. , Meyer , C. R. C. R. , Johnson , T. D. T. D. , Galb\'an , S. S. , Rehemtulla , A. A. , Kazerooni , E. A. E. A. , Martinez , F. J. F. J. Ross , B. D. B. D. ( 2012 ). Comp...
2012 doi
-
[18]
barticle [author] Genofre , E. E. , Carstens , D. D. , DeBacker , W. W. , Muchmore , P. P. , Panettieri Jr , R. A. R. A. , Rhodes , K. K. , Shih , V. H. V. H. Trudo , F. F. ( 2023 ). The effects of benralizumab on airway geometry and dynamics in severe eosinophilic asthma: a s...
2023 doi
-
[19]
barticle [author] Ghodrati , L. L. Panaretos , V. M. V. M. ( 2022 ). Distribution-on-distribution regression via optimal transport maps . Biometrika 109 957--974 . 10.1093/biomet/asac005 4519110 barticle
2022 doi
- [20]
-
[21]
barticle [author] Ghosal , R. R. , Varma , V. R. V. R. , Volfson , D. D. , Hillel , I. I. , Urbanek , J. J. , Hausdorff , J. M. J. M. , Watts , A. A. Zipunnikov , V. V. ( 2023 ). Distributional data analysis via quantile functions and its application to modeling digital biomar...
2023 doi
-
[22]
barticle [author] Hartley , R. A. R. A. , Barker , B. L. B. L. , Newby , C. C. , Pakkal , M. M. , Baldi , S. S. , Kajekar , R. R. , Kay , R. R. , Laurencin , M. M. , Marshall , R. P. R. P. , Sousa , A. R. A. R. , Parmar , H. H. , Siddiqui , S. S. , Gupta , S. S. Brightling , C...
2016
-
[23]
u hler , A. A. M \
binproceedings [author] Heuberger , J. J. , Geissb \"u hler , A. A. M \"u ller , H. H. ( 2005 ). Lung CT segmentation for image retrieval using the Insight Toolkit (ITK) . In Medical Imaging and Telemedicine (MIT) 57--62 . binproceedings
2005
-
[24]
bmisc [author] Irpino , A. A. ( 2024 ). Hist DAW ass: H istogram- V alued D ata A nalysis . R package version 1.0.8 . 10.32614/CRAN.package.HistDAWass bmisc
2024 doi
-
[25]
barticle [author] Irpino , A. A. Verde , R. R. ( 2015 ). Linear regression for numeric symbolic variables: a least squares approach based on W asserstein distance . Advances in Data Analysis and Classification 9 81--106 . 10.1007/s11634-015-0197-7 3317894 barticle
2015 doi
-
[26]
barticle [author] Kato , K. K. ( 2012 ). Estimation in functional linear quantile regression . The Annals of Statistics 40 3108--3136 . 10.1214/12-AOS1066 3097971 barticle
2012 doi
-
[27]
bbook [author] Koenker , R. R. ( 2005 ). Quantile R egression . Econometric Society Monographs 38 . Cambridge University Press, Cambridge . 10.1017/CBO9780511754098 2268657 bbook
2005 doi
-
[28]
barticle [author] Li , M. M. , Wang , K. K. , Maity , A. A. Staicu , A. M. A. M. ( 2022 ). Inference in functional linear quantile regression . Journal of Multivariate Analysis 190 Paper No. 104985, 19 pp. 10.1016/j.jmva.2022.104985 4402003 barticle
2022
-
[29]
barticle [author] Liu , Y. Y. , Li , M. M. Morris , J. S. J. S. ( 2020 ). Function-on-scalar quantile regression with application to mass spectrometry proteomics data . The Annals of Applied Statistics 14 521--541 . 10.1214/19-AOAS1319 4117818 barticle
2020 doi
- [30]
-
[31]
bbook [author] Lorentz , G. G. G. G. ( 1986 ). Bernstein P olynomials , Second ed. Chelsea Publishing Co., New York . 864976 bbook
1986
-
[32]
bincollection [author] Marin , G. G. , Bommart , S. S. , Molinari , N. N. , Knabe , L. L. , Cabon , Y. Y. , Vachier , I. I. , Devautour , C. C. Bourdin , A. A. ( 2016 ). Fractal dimension as a global index of air trapping . In A38. Diagnostic Markers of Asthma and COPD A1448--...
2016
-
[33]
barticle [author] Mitsunobu , F. F. Tanizaki , Y. Y. ( 2005 ). The use of computed tomography to assess asthma severity . Current Opinion in Allergy and Clinical Immunology 5 85--90 . 10.1097/00130832-200502000-00015 barticle
2005 doi
-
[34]
barticle [author] Mutis , M. M. , Beyaztas , U. U. , Karaman , F. F. Shang , H. L. H. L. ( 2024 ). On function-on-function linear quantile regression . Journal of Applied Statistics . 10.1080/02664763.2024.2395960 barticle
2024
-
[35]
barticle [author] Okano , R. R. Imaizumi , M. M. ( 2024 ). Distribution-on-distribution regression with W asserstein metric: multivariate G aussian case . Journal of Multivariate Analysis 203 Paper No. 105334, 20 pp. 10.1016/j.jmva.2024.105334 4752834 barticle
2024
-
[36]
barticle [author] Panaretos , V. M. V. M. Zemel , Y. Y. ( 2019 ). Statistical aspects of W asserstein distances . Annual Review of Statistics and Its Application 6 405--431 . 10.1146/annurev-statistics-030718-104938 3939527 barticle
2019 doi
-
[37]
btechreport [author] Parzen , E. E. ( 1983 ). Informative Quantile Functions and Identification of Probability Distribution Types Technical Report No. A-26 , Texas A&M University . btechreport
1983
-
[38]
barticle [author] Pompe , E. E. , Galb\'an , C. J. C. J. , Ross , B. D. B. D. , Koenderman , L. L. , ten Hacken , N. H. T. N. H. T. , Postma , D. S. D. S. , van den Berge , M. M. , de Jong , P. A. P. A. , Lammers , J. W. J. J. W. J. Mohamed Hoesein , F. A. A. F. A. A. ( 2017 )...
2017 doi
-
[39]
barticle [author] Pompe , E. E. , Kwee , A. K. A. L. A. K. A. L. , Tejwani , V. V. , Siddharthan , T. T. Mohamed Hoesein , F. A. A. F. A. A. ( 2023 ). Imaging-derived biomarkers in Asthma: Current status and future perspectives . Respiratory Medicine 208 107130, 6 pp. 10.1016/...
2023
-
[40]
barticle [author] Rohr , K. K. , Stiehl , H. S. H. S. , Sprengel , R. R. , Buzug , T. M. T. M. , Weese , J. J. Kuhn , M. H. M. H. ( 2001 ). Landmark-based elastic registration using approximating thin-plate splines . IEEE Transactions on Medical Imaging 20 526--534 . 10.1109/4...
2001 doi
-
[41]
barticle [author] Sengupta , D. D. , Gupta , P. P. Biswas , A. A. ( 2022 ). A survey on mutual information based medical image registration algorithms . Neurocomputing 486 174--188 . 10.1016/j.neucom.2021.11.023 barticle
2022 doi
-
[42]
barticle [author] Siem , A. Y. D. A. Y. D. , de Klerk , E. E. Den Hertog , D. D. ( 2008 ). Discrete least-norm approximation by nonnegative (trigonometric) polynomials and rational functions . Structural and Multidisciplinary Optimization 35 327--339 . 10.1007/s00158-007-0135-...
2008 doi
-
[43]
barticle [author] Sumikawa , H. H. , Johkoh , T. T. , Yamamoto , S. S. , Yanagawa , M. M. , Inoue , A. A. , Honda , O. O. , Yoshida , S. S. , Tomiyama , N. N. Nakamura , H. H. ( 2009 ). Computed tomography values calculation and volume histogram analysis for various computed t...
2009 doi
-
[44]
barticle [author] Trivedi , A. A. , Hall , C. C. , Hoffman , E. A. E. A. , Woods , J. C. J. C. , Gierada , D. S. D. S. Castro , M. M. ( 2017 ). Using imaging as a biomarker for asthma . Journal of Allergy and Clinical Immunology 139 1--10 . 10.1016/j.jaci.2016.11.009 barticle
2017 doi
-
[45]
binproceedings [author] Verde , R. R. Irpino , A. A. ( 2010 ). Ordinary Least Squares for Histogram Data Based on W asserstein Distance . In Proceedings of COMPSTAT'2010 ( Yves Y. Lechevallier Gilbert G. Saporta , eds.) 581--588 . Physica-Verlag HD , Heidelberg . 10.1007/978-3...
2010 doi
-
[46]
barticle [author] Yan , Q. Q. , Li , H. H. Niu , C. C. ( 2023 ). Optimal subsampling for functional quantile regression . Statistical Papers 64 1943--1968 . 10.1007/s00362-022-01367-z 4672800 barticle
2023 doi
-
[47]
barticle [author] Yang , H. H. ( 2020 ). Random distributional response model based on spline method . Journal of Statistical Planning and Inference 207 27--44 . 10.1016/j.jspi.2019.10.005 4066120 barticle
2020 doi
-
[48]
barticle [author] Yang , H. H. , Baladandayuthapani , V. V. , Rao , A. U. K. A. U. K. Morris , J. S. J. S. ( 2020 ). Quantile function on scalar regression analysis for distributional data . Journal of the American Statistical Association 115 90--106 . 10.1080/01621459.2019.16...
2020
-
[49]
barticle [author] Zarei , F. F. , Jannatdoust , P. P. , Malekpour , S. S. , Razaghi , M. M. , Chatterjee , S. S. , Varadhan Chatterjee , V. V. , Abbasi , A. A. Haghighi , R. R. R. R. ( 2024 ). Quantitative analysis of lung lesions using unenhanced chest computed tomography ima...
2024 doi
-
[50]
barticle [author] Zhang , Z. Z. , Wang , X. X. , Kong , L. L. Zhu , H. H. ( 2022 ). High-dimensional spatial quantile function-on-scalar regression . Journal of the American Statistical Association 117 1563--1578 . 10.1080/01621459.2020.1870984 4480732 barticle
2022
-
[51]
barticle [author] Zhu , H. H. , Zhang , Y. Y. , Li , Y. Y. Lian , H. H. ( 2023 ). Semiparametric function-on-function quantile regression model with dynamic single-index interactions . Computational Statistics & Data Analysis 182 Paper No. 107727, 22 pp. 10.1016/j.csda.2023.10...
2023
Reviewed August 11, 2026 · model on record in the stance chip above.
Discussion (0). Continue with ORCID to comment.