REVIEW 4 major objections 5 minor 30 references
Synthetic Tabular Data Generation for Imbalanced Classification: The Surprising Effectiveness of an Overlap Class
T0 review · 4 major / 5 minor · reviewed 2026-08-11 · deepseek-v4-flash
Pith's one-line read Splitting majority into clear and overlap classes improves synthetic minority data.
desk verdict A genuinely simple and mostly convincing fix for imbalanced tabular generation, but the missing random-third-class control leaves the mechanism underdetermined. read the letter →
The pith
A machine-rendered reading of the paper's core claim, the machinery that carries it, and where it could break.
The reading
What carries the argument
The load-bearing mechanism is the overlap class $D_{01}$, defined as the subset of majority instances whose label is uncertain under a k-fold cross-validated random forest. For each fold, a random forest is trained on the other majority folds plus all minority instances; a majority point whose predicted majority probability falls below $1-\tau$ is declared overlapping and relabeled as class 2. The size of $D_{01}$ is capped by $\min(\text{minority count}, r\% \text{ of majority count})$, with $r$ tuned on a validation set per generator. This ternary labeling is then fed to any class-conditional generator, and the paper's CTabSyn variant adds the target-class embedding to the TabSyn denoiser input. The overlap class does double work: it teaches the generator where the minority boundary is, and its removal from classifier training acts as a principled under-sampling of boundary points.
What would settle it
Compute the true overlap region on a synthetic Gaussian-blob dataset where the Bayes boundary is known, then compare the random forest's overlap set with the truth. If ORD's gains disappear when the true overlap set is used instead of the estimated one—or if the estimated set is far from the truth yet gains remain—then random-forest disagreement is not the mechanism the paper claims.
Extended reading notes
Core claim
The central discovery is that deep generative models trained on imbalanced tabular data generate minority instances of far lower quality than majority instances, and that this failure can be substantially corrected without changing the generator's architecture. The correction is to label a subset of majority points that lie in the overlap region between the two classes as a third class, train the generator conditionally on these three classes, and then train the final classifier only on generated minority and clear-majority points plus real minority points. The paper demonstrates this through a paired comparison across CTGAN, CTABGAN+, TabDDPM, TabSyn, and ForestFlow, reporting accuracy gains in 26 of 32 (dataset, generator) combinations and a paired t-test p-value of 6.84e-05. It also provides visual and quantitative evidence on toy Gaussian-blob datasets where the true Bayes labels are known, showing that ORD reduces the fraction of wrongly generated minority points.
Load-bearing premise
A cross-validated random forest's disagreement score reliably marks where the two classes genuinely overlap, and the overlap size chosen on a validation set carries over to new data.
Editorial extensions
If this is right
- ORD is a drop-in preprocessing layer: any existing tabular synthesizer gains accuracy when trained on the ternary-labeled data, so future generators can inherit the benefit without architectural change.
- Classifiers trained on ORD-augmented data improve in macro-averaged accuracy, with the largest minority-accuracy gains on diffusion models such as TabSyn and ForestFlow.
- Augmenting synthetic data with real minority points $D_1$ further improves the average of four classifiers, suggesting that real minority examples carry information the generator still misses.
- The overlap region is dataset-specific: the optimal threshold $\tau$ varies (0.3 for Adult, lower for Cardio), so validation-based selection of $r$ is needed in practice.
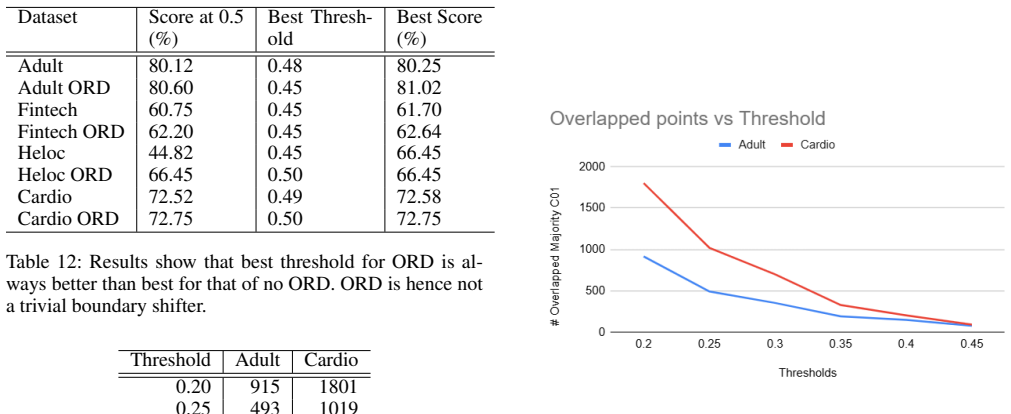
- ORD is not a simple boundary shift: tuning the decision threshold of a classifier trained without ORD does not match ORD's accuracy in the paper's comparison.
Reading between the lines
- Editorial inference: the overlap-detection idea could extend to multiclass settings by pairwise or one-vs-rest overlap labeling; a natural test is whether per-class ternary splits preserve the same gains for non-binary targets.
- Editorial inference: because the method works by making the generator's conditioning signal finer, other forms of auxiliary boundary information—such as density-ratio estimates or calibrated probabilities—might substitute for random forest disagreement and give larger gains.
- Editorial inference: a strong testable extension is to replace the random forest with an explicitly calibrated classifier; if gains persist with a calibrated overlap detector, then miscalibration of the random forest is not the limiting factor.
- Editorial inference: the method's reliance on validation-tuned $r$ per generator implies a small search cost; a practical extension would be a cheap heuristic for $r$ based on class-overlap statistics rather than a grid search.
Editorial analysis
A structured set of objections, weighed in public.
Referee Report
Summary. The paper proposes ORD, a preprocessing step for imbalanced tabular classification with generative data augmentation. ORD detects a subset of majority points that overlap the minority class using random-forest disagreement in k-fold cross-validation, relabels the training set as ternary (minority, overlap majority, clear majority), trains a class-conditional generator on those labels, and then trains the downstream classifier on balanced synthetic samples from minority and clear majority plus real minority points. The authors report improved classifier accuracy on four datasets across five generators, improved oracle-labeled quality of generated minority points on toy data, and ablations that attribute the gains to both improved generator quality and classifier-side downsampling of overlap points.
Significance. If the central claim is upheld, ORD is a simple, generator-agnostic intervention with practical value for imbalanced tabular data, and the observation that deep generative models degrade on minority classes is useful. Strengths include public code, multiple generators and classifiers, a paired statistical test, and oracle-based quality evaluation on toy data where the true Bayes label is known. However, because the active-ingredient claim is not tested against a placebo split of the majority class, the proposed explanation for the gains is currently unestablished, and a key ablation is confounded.
major comments (4)
- [Section 4.1 and Table 2] The central claim is that labeling the true overlap region as a third class improves generator quality, but the paper never compares ORD against a control in which the majority class is split at random (or by a non-overlap rule) into two labels with the same number of points. Without this placebo control, the gains in Table 2 cannot be attributed to the overlap region specifically; they could come from any fine-grained split of the majority class making the conditional generation task easier, or from the classifier-side removal of a subset of majority points. Please add a randomized-split control that matches the size of D01 for each dataset and generator, and report the paired comparison against ORD.
- [Table 6] The 'ORD before vs after synthesis' ablation is confounded. In the 'after' condition, applying the real-data overlap detector to binary-generated data removes an uncontrolled number of generated majority points; for Adult the resulting XGBoost accuracy (65.32) is far below the binary baseline (78.28 in Table 2), so the drop cannot be attributed solely to the absence of ternary training labels. The authors should control for the number of removed points, for example by also removing the same number of majority points at random from binary-generated data, and should report how many points were filtered in each condition.
- [Section 4.1 and Appendix Table 13] The parameterization of the overlap-set size is inconsistent as written. Section 4.1 states that 'the number of overlapped majority points = min(number of minority points, r% of majority points)', with r values 3, 5, 7, 9, but Appendix Table 13 reports overlap counts for Adult and Cardio at thresholds 0.20-0.45 that do not satisfy this formula. For Adult, 3% of the majority count (34,514) is 1,035, yet the largest count in Table 13 is 915 at threshold 0.20; for Cardio, threshold 0.30 yields 700, which equals the minority count if that count is 700, but then the min formula would cap at that value. The relationship between tau and r is therefore not reproducible as written. Please define the exact procedure used to set tau/r and report the resulting overlap counts for the main experiments.
- [Section 4.1 and Experimental Setup] The selection of the r parameter is not fully specified. The text says r is chosen by 'checking the performance on the validation set of a dataset' and then 'use the best r value with all datasets for a given synthesizer,' but it does not state which dataset's validation set is used, whether the same validation split is also used to tune baselines, or whether the reported test results are on data never used for r selection. If r was tuned on the same data used to report the main accuracy numbers, the paired t-test is not a fully held-out comparison. Please specify the exact protocol and, ideally, report the main results for each of the four candidate r values across all datasets and generators, since Appendix Tables 14-15 cover only Adult and Cardio with two synthesizers.
minor comments (5)
- [Table 1] The column semantics in Table 1 are unclear: 'Min/Maj' appears to be the ratio of the undersampled minority to the majority, but the Cardio row gives an 'Unb Min' value of 100 while the text and Appendix Table 13 suggest a minority count around 700; please clarify and correct the table.
- [Figure 1 and Algorithm 1] Figure 1 says 'use k-fold training to identify the overlap in the validation set,' but Algorithm 1 splits only the majority instances D0 into folds within the training set; the terminology should be made consistent.
- [Main tables] The main accuracy tables do not show error bars, and the discussion of gains and losses does not reference the standard deviations in Appendix Table 11. For example, Table 2 shows CTGAN ORD on Heloc dropping from 62.93 to 61.47, and CTAB-GAN+ ORD on Fintech dropping from 57.45 to 54.83; these decreases should be acknowledged when claiming a gain in accuracy.
- [Abstract and Section 5] The abstract and Section 5 refer to an 'Oracle Bayesian model,' but Table 4 uses an XGBoost classifier trained on real balanced data, not a Bayes classifier; the terminology should be adjusted to avoid overclaiming.
- [Contribution list] The paper lists CTabSyn as 'a new SOTA model,' but Table 2 shows that on Fintech the average-of-4 accuracy of CTabSyn without ORD (65.37) is higher than that of CTabSyn ORD (63.58); the SOTA claim should be qualified to the settings where it is actually supported.
Circularity Check
No significant circularity: ORD's gains are empirical, evaluated on held-out test data, and the overlap labels, oracle quality checks, and validation-tuned r do not reduce to the evaluation outcome.
full rationale
The paper's claims are empirical rather than derived from an equation-level chain, and no load-bearing step is equivalent to its inputs by construction. The overlap set D01 is defined by random-forest disagreement (Section 4.1), but the final classifier is evaluated on real held-out test sets, and the generator quality is measured either on toy data with a known Bayes-optimal label (Table 3) or with a separately trained XGBoost oracle on balanced real data (Table 4), not with the same fitted labels used to train the generator. The r parameter is selected on a validation set from {3%,5%,7%,9%} and then fixed across datasets for each synthesizer; this is standard hyperparameter selection, not a fitted input renamed as a prediction. There are no self-citations carrying the central premise, no imported uniqueness theorems, and no ansatz smuggled in via prior work by the same authors. The skeptic's concern that no arbitrary-third-class control was run is a legitimate threat to the interpretation of the ablation, but it is an experimental-validity critique, not a circularity: the paper's results could be explained by a different mechanism without any step being definitionally forced. Accordingly, the appropriate circularity score is 0.
Assumptions & free parameters
free parameters (3)
- r =
3%, 5%, 7%, 9% (best selected per generator via validation)
- tau =
0.3 for real datasets, 0.2 for toy
- k =
2
assumptions (3)
- domain assumption Random forest disagreement on confidence identifies the true overlap region between majority and minority distributions.
- domain assumption Adding a finer-grained third class label improves the generative model's ability to model the minority distribution.
- domain assumption The validation-based selection of r generalizes to the test set.
Cite this review
Pith. "Pith review of Synthetic Tabular Data Generation for Imbalanced Classification: The Surprising Effectiveness of an Overlap Class." pith.science (2026). https://pith.science/paper/VRONQK4J
@misc{pith2026241215657,
  author       = {Pith},
  title        = {Pith review of: Synthetic Tabular Data Generation for Imbalanced Classification: The Surprising Effectiveness of an Overlap Class},
  year         = {2026},
  howpublished = {\url{https://pith.science/paper/VRONQK4J}},
  note         = {Machine review of arXiv:2412.15657}
}
read the original abstract
Handling imbalance in class distribution when building a classifier over tabular data has been a problem of long-standing interest. One popular approach is augmenting the training dataset with synthetically generated data. While classical augmentation techniques were limited to linear interpolation of existing minority class examples, recently higher capacity deep generative models are providing greater promise. However, handling of imbalance in class distribution when building a deep generative model is also a challenging problem, that has not been studied as extensively as imbalanced classifier model training. We show that state-of-the-art deep generative models yield significantly lower-quality minority examples than majority examples. %In this paper, we start with the observation that imbalanced data training of generative models trained imbalanced dataset which under-represent the minority class. We propose a novel technique of converting the binary class labels to ternary class labels by introducing a class for the region where minority and majority distributions overlap. We show that just this pre-processing of the training set, significantly improves the quality of data generated spanning several state-of-the-art diffusion and GAN-based models. While training the classifier using synthetic data, we remove the overlap class from the training data and justify the reasons behind the enhanced accuracy. We perform extensive experiments on four real-life datasets, five different classifiers, and five generative models demonstrating that our method enhances not only the synthesizer performance of state-of-the-art models but also the classifier performance.
Figures


Figures from the paper (9 more)



Reference graph
Works this paper leans on
-
[1]
, " * write output.state after.block = add.period write newline
ENTRY address archivePrefix author booktitle chapter edition editor eid eprint howpublished institution isbn journal key month note number organization pages publisher school series title type volume year label extra.label sort.label short.list INTEGERS output.state before.all mid.sentence after.sentence after.block FUNCTION init.state.consts #0 'before.a...
-
[2]
write newline
" write newline "" before.all 'output.state := FUNCTION n.dashify 't := "" t empty not t #1 #1 substring "-" = t #1 #2 substring "--" = not "--" * t #2 global.max substring 't := t #1 #1 substring "-" = "-" * t #2 global.max substring 't := while if t #1 #1 substring * t #2 global.max substring 't := if while FUNCTION word.in bbl.in capitalize " " * FUNCT...
-
[3]
Adiputra, I. N. M.; and Wanchai, P. 2023. CTGAN-ENN: A tabular GAN-based Hybrid Sampling Method for Imbalanced and Overlapped Data in Customer Churn Prediction
work page 2023
-
[4]
Borisov, V.; Sessler, K.; Leemann, T.; Pawelczyk, M.; and Kasneci, G. 2023. Language Models are Realistic Tabular Data Generators. In The Eleventh International Conference on Learning Representations
work page 2023
-
[5]
Breiman, L. 2001. Random forests. Machine learning, 45: 5--32
2001
-
[6]
Chawla, N. V.; Bowyer, K. W.; Hall, L. O.; and Kegelmeyer, W. P. 2002. SMOTE: Synthetic Minority Over-sampling Technique. Journal of Artificial Intelligence Research, 16: 321–357
work page 2002
-
[7]
Chen, T.; and Guestrin, C. 2016. Xgboost: A scalable tree boosting system. In Proceedings of the 22nd acm sigkdd international conference on knowledge discovery and data mining, 785--794
2016
-
[8]
Douzas, G.; Bacao, F.; and Last, F. 2018. Improving imbalanced learning through a heuristic oversampling method based on k-means and SMOTE. Information Sciences, 465: 1--20
work page 2018
Show all 30 references
-
[9]
S.; and Roysdon, P
Gulati, M. S.; and Roysdon, P. F. 2023. TabMT: Generating tabular data with masked transformers. arXiv:2312.06089
2023 arXiv
-
[10]
Han, H.; Wang, W.-Y.; and Mao, B.-H. 2005. Borderline-SMOTE: a new over-sampling method in imbalanced data sets learning. In International conference on intelligent computing, 878--887. Springer
2005
-
[11]
A.; and Li, S
He, H.; Bai, Y.; Garcia, E. A.; and Li, S. 2008. ADASYN: Adaptive synthetic sampling approach for imbalanced learning. In 2008 IEEE international joint conference on neural networks (IEEE world congress on computational intelligence), 1322--1328. Ieee
2008
-
[12]
Hegselmann, S.; Buendia, A.; Lang, H.; Agrawal, M.; Jiang, X.; and Sontag, D. 2023. Tabllm: Few-shot classification of tabular data with large language models. In International Conference on Artificial Intelligence and Statistics, 5549--5581. PMLR
2023
-
[13]
M.; and Khoshgoftaar, T
Johnson, J. M.; and Khoshgoftaar, T. M. 2019. Survey on deep learning with class imbalance. Journal of big data, 6(1): 1--54
2019
-
[14]
Jolicoeur-Martineau, A.; Fatras, K.; and Kachman, T. 2024. Generating and imputing tabular data via diffusion and flow-based gradient-boosted trees. In International Conference on Artificial Intelligence and Statistics, 1288--1296. PMLR
2024
-
[15]
Kotelnikov, A.; Baranchuk, D.; Rubachev, I.; and Babenko, A. 2022. TabDDPM: Modelling Tabular Data with Diffusion Models. arXiv:2209.15421
2022 arXiv
-
[16]
Leng, Q.; Guo, J.; Tao, J.; Meng, X.; and Wang, C. 2024. OBMI: oversampling borderline minority instances by a two-stage Tomek link-finding procedure for class imbalance problem. Complex & Intelligent Systems, 1--18
2024
-
[17]
Li, Z.; Huang, M.; Liu, G.; and Jiang, C. 2021. A hybrid method with dynamic weighted entropy for handling the problem of class imbalance with overlap in credit card fraud detection. Expert Systems with Applications, 175: 114750
2021
-
[18]
K.; and Chan, H
Mathew, J.; Luo, M.; Pang, C. K.; and Chan, H. L. 2015. Kernel-based SMOTE for SVM classification of imbalanced datasets. In IECON 2015 - 41st Annual Conference of the IEEE Industrial Electronics Society, 001127--001132
2015
-
[19]
Papamakarios, G.; Pavlakou, T.; and Murray, I. 2017. Masked autoregressive flow for density estimation. Advances in neural information processing systems, 30
2017
-
[20]
Vaswani, A. 2017. Attention is all you need. arXiv preprint arXiv:1706.03762
2017 arXiv
-
[21]
Vuttipittayamongkol, P.; and Elyan, E. 2020. Neighbourhood-based undersampling approach for handling imbalanced and overlapped data. Information Sciences, 509: 47--70
2020
-
[22]
Wang, Z.; Wu, C.; Zheng, K.; Niu, X.; and Wang, X. 2019. SMOTETomek-based resampling for personality recognition. IEEE access, 7: 129678--129689
2019
-
[23]
Xu, L.; Skoularidou, M.; Cuesta-Infante, A.; and Veeramachaneni, K. 2019. Modeling Tabular data using Conditional GAN. In Neural Information Processing Systems
2019
-
[24]
Zhang, H.; Zhang, J.; Srinivasan, B.; Shen, Z.; Qin, X.; Faloutsos, C.; Rangwala, H.; and Karypis, G. 2024. Mixed-Type Tabular Data Synthesis with Score-based Diffusion in Latent Space. arXiv:2310.09656
2024 arXiv
-
[25]
Zhang, Y.-P.; Zhang, L.-N.; and Wang, Y.-C. 2010. Cluster-based majority under-sampling approaches for class imbalance learning. In 2010 2nd IEEE International Conference on Information and Financial Engineering, 400--404. IEEE
2010
-
[26]
Zhao, X.; Guan, S.; Xue, Y.; and Pan, H. 2024. HS-CGK: A Hybrid Sampling Method for Imbalance Data Based on Conditional Tabular Generative Adversarial Network and K-Nearest Neighbor Algorithm. Computing and Informatics, 43(1): 213--239
2024
-
[27]
Zhao, Z.; Birke, R.; and Chen, L. 2023. TabuLa: Harnessing Language Models for Tabular Data Synthesis. arXiv:2310.12746
2023 arXiv
-
[28]
Zhao, Z.; Kunar, A.; Birke, R.; and Chen, L. Y. 2022. CTAB-GAN+: Enhancing Tabular Data Synthesis. arXiv:2204.00401
2022 arXiv
-
[29]
V.; Birke, R.; and Chen, L
Zhao, Z.; Kunar, A.; der Scheer, H. V.; Birke, R.; and Chen, L. Y. 2021. CTAB-GAN: Effective Table Data Synthesizing. CoRR, abs/2102.08369
2021 arXiv
-
[30]
Zhou, Z.-H.; and Liu, X.-Y. 2005. Training cost-sensitive neural networks with methods addressing the class imbalance problem. IEEE Transactions on knowledge and data engineering, 18(1): 63--77
2005
Reviewed August 11, 2026 · model on record in the stance chip above.
Discussion (0). Continue with ORCID to comment.