REVIEW 4 major objections 6 minor 72 references
Adaptive Hierarchical Graph Cut for Multi-granularity Out-of-distribution Detection
T0 review · 4 major / 6 minor · reviewed 2026-08-11 · deepseek-v4-flash
Pith's one-line read AHGC claims a hierarchical graph cut over image similarities can detect out-of-distribution samples better than prior methods, cutting FPR95 by 40.47% on CIFAR-10 and 81.24% on CIFAR-100.
desk verdict New graph-cut method for semantically coherent OOD detection with strong reported numbers, but the claimed SOTA margin isn't yet supported: hyperparameters are tuned on the same test benchmarks, no error bars, and the 'consistently best' caption is contradicted by its own Table II. read the letter →
The pith
A machine-rendered reading of the paper's core claim, the machinery that carries it, and where it could break.
The reading
What carries the argument
The load-bearing construction is the hierarchical KNN graph cut. Each image is a node; an attention-aware graph cut module predicts linkage probabilities $p_{ij}$ and a density proxy $d_i$ for every node, then keeps for each node the edge to the highest-similarity neighbor whose density is no lower, so low-density boundary nodes attach to denser cluster cores and the graph splits into subgraphs. The assignment rule then propagates the majority label of each subgraph to unlabeled nodes whenever the labeled share passes the threshold $\rho$, and subgraph aggregation propagates peak-node and average features upward to the next level. The cosine-similarity maximization between two augmentations pushes the feature space to be more discriminative before the energy-based OOD score is applied.
What would settle it
Take the SC-OOD CIFAR-10 and CIFAR-100 benchmarks, run the AHGC training pipeline, and compare every pseudo-label assigned to an unlabeled Tiny-ImageNet image with that image's ground-truth semantic class. If more than about 5% of the unlabeled images that receive a pseudo-label are actually OOD under ground-truth semantics, the claimed mechanism is not doing the work.
Extended reading notes
Core claim
AHGC claims to solve multi-granularity OOD detection by treating unlabeled data as a mixture of ID and OOD rather than a pure OOD set. It constructs a hierarchical KNN graph on ResNet-18 features, uses a graph attention network to predict edge linkage and node density, cuts low-weight edges to form subgraphs, and assigns the majority ground-truth label within a subgraph to unlabeled images whenever the labeled fraction exceeds a threshold. The same encoder is then trained with the added pseudo-labeled samples, an equalization loss on remaining unlabeled samples, and an InfoNCE-style consistency loss between two augmentations. Detection uses temperature-scaled energy logits. The reported result is that AHGC achieves the best mean FPR95, AUROC, AUPR, and CCR across the six unlabeled datasets on both benchmarks, with representative FPR95 gains of 40.47% over UDG on CIFAR-10 and 81.24% over UDG on CIFAR-100 when Tiny-ImageNet is the unlabeled set.
Load-bearing premise
The method assumes that any subgraph whose labeled share exceeds the threshold $\rho$ is pure enough that assigning the majority label to every unlabeled image in it does not contaminate the training set; if OOD samples leak into those subgraphs, the reported separation is inflated.
Editorial extensions
If this is right
- If AHGC's performance holds, an OOD detector can exploit a mixed unlabeled pool without knowing which samples are OOD, removing the unrealistic purity assumption of outlier exposure methods.
- The pseudo-labeled ID samples recovered from the unlabeled pool also improve ID classification under low-FPR constraints, so detection and classification improve together.
- The method's gains on Tiny-ImageNet, LSUN, and Places365 suggest that label-granularity-aware alignment, not just covariate shift, is a large part of what made those datasets hard.
- Because the graph cut is trained with linkage and density supervision from labeled images, the approach can in principle be retrained whenever the labeled set changes, without new OOD data.
- The authors state the intended next step is extending AHGC to video OOD detection.
Reading between the lines
- The paper does not measure how often an OOD sample slips into a subgraph whose labeled share clears $\rho=0.5$; measuring that contamination rate on the Tiny-ImageNet ground-truth IDs would directly test whether the reported separation comes from semantic alignment or from pseudo-label noise.
- The same mechanism could be applied to open-set recognition or partial-label learning, where the unlabeled set is also assumed to contain known-class and novel-class samples at mixed granularity.
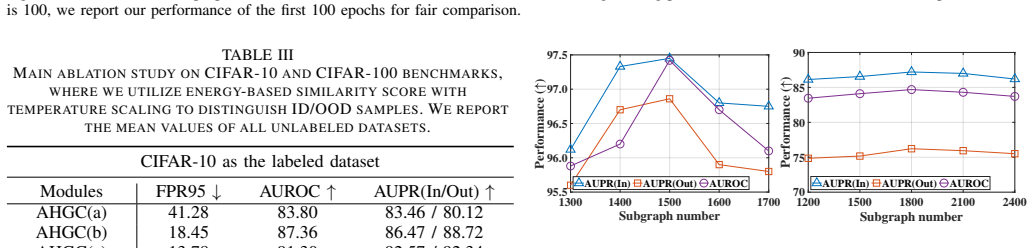
- One testable extension is to vary $\rho$ and the subgraph count while reporting pseudo-label precision; if precision degrades sharply for small $\rho$, the threshold is the true control knob of the method.
- The ablation study shows that the augmentation and equalization losses contribute much of the gain, so a reader should not assume the graph-cut module alone reproduces the headline numbers.
Signed reviews
Editorial analysis
A structured set of objections, weighed in public.
Referee Report
Summary. The paper proposes AHGC, an adaptive hierarchical graph-cut network for semantically coherent out-of-distribution detection. It builds a hierarchical KNN graph over labeled and unlabeled image features, cuts the graph into subgraphs using GAT-based linkage and density estimates, and pseudo-labels unlabeled samples in subgraphs whose labeled proportion exceeds a threshold rho. Training combines a classification loss, an equalization loss, an InfoNCE augmentation loss, and a co-training loss, while inference uses a temperature-scaled energy score. Experiments on the CIFAR-10 and CIFAR-100 SC-OOD benchmarks report large FPR95 improvements, including absolute drops of 40.47 and 81.24 percentage points on the Tiny-ImageNet unlabeled set.
Significance. If the reported results are trustworthy, AHGC is a novel and potentially important contribution to multi-granularity OOD detection: the graph-cut formulation with intra-subgraph label assignment is original, the ablation study is coherent and shows each loss component helping, and the reported margins over UDG and other SC-OOD methods are very large. The paper also gives a qualitative visualization supporting the intended semantic grouping. However, the absence of a validation protocol, the lack of error bars, and an internally inconsistent 'consistently best' caption substantially reduce the confidence that the headline SOTA claim is supported.
major comments (4)
- [Section V.E.5 and Fig. 6; Section V.E.2 and Fig. 5] Hyperparameters alpha, beta, gamma, delta, p_tau, rho, and the subgraph number K are selected by maximizing AUROC/AUPR on the same CIFAR-10/CIFAR-100 benchmark test sets that appear in Tables I and II. No held-out validation split or nested selection protocol is described in Section V.C or Section V.E. With at least seven tunable quantities and six OOD test sets per benchmark, the reported SOTA margins may reflect selection on the test benchmark rather than a validated algorithmic gain. Please add a proper validation split (or nested cross-validation), fix all hyperparameters on that split, and then report test results, along with multiple-seed means and standard deviations.
- [Table II caption and CIFAR-10 row] The caption's claim that 'Our AHGC achieves consistently the best performance on all OOD detection metrics' is directly contradicted by the CIFAR-10 OOD row: AHGC obtains AUROC 74.47 versus 78.95 for EBO and 78.92 for OE; AUPR(In) 78.21 versus 81.95 for OE; AUPR(Out) 67.13 versus 74.44 for EBO; and CCR@FPR10^-1 44.42 versus 48.67 for EBO. Section V.D's analysis partially acknowledges this, but the caption and the 'consistently best' statement must be corrected or carefully qualified.
- [Section IV.E and Section V.F] The paper never measures the contamination rate of pseudo-labeled subgraphs. The label-assignment rule in Section IV.E trusts any subgraph with rho > 0.5 and assigns the majority label to every unlabeled sample, so any OOD sample that lands in an ID-majority subgraph is trained as ID. The qualitative claim in Section V.F that 'no unlabeled OOD sample is mistakenly into ID cluster' is supported only by a few illustrative examples. Please report the fraction of OOD samples that receive pseudo-labels, the precision of the pseudo-labels on unlabeled ID samples, and ideally the label composition of the accepted subgraphs.
- [Tables I and II] All metrics are reported as single numbers with no error bars and no statement about the number of runs. Because the pipeline involves GAT, data augmentation, SGD, and iterative pseudo-labeling, a single run is insufficient to support claims of consistent superiority, especially in rows where margins are small (for example, Table II, Places365 AUROC: 81.73 for AHGC versus 80.96 for Scone, and Table I, CIFAR-100 AUROC: 92.72 versus 91.24). Please report mean and standard deviation over at least three to five seeds.
minor comments (6)
- [Abstract and Section V.D] The '81.24%' and '40.47%' improvements are absolute FPR95 reductions (for example, 81.73 − 0.49 = 81.24 for CIFAR-100/Tiny-ImageNet), not relative improvements; the text should say 'percentage points' to avoid ambiguity.
- [Eq. (7)] The InfoNCE denominator appears to include the positive pair twice: the first sum over b_j in B1 contains b^1_i, and the second sum over b_g in B0 contains b^0_i. Please clarify the intended contrastive form.
- [Section IV.C] The termination condition for the hierarchy, 'E'_l = empty set', is unclear, since at each level every node with non-empty candidate set adds one edge; please specify how convergence is reached and how the chosen total subgraph number K relates to the edge-selection process in Eq. (3).
- [Throughout] There are typographical and wording errors, including 'CIAFR-10', 'semantics relationship', and the duplicated GAT reference (references [55] and [61] are the same paper); these should be corrected.
- [Section V.E.3] The feature-encoder ablation is reported only for the CIFAR-10 benchmark, while the text says the method is evaluated on 'all the tasks'; please either add CIFAR-100 results or rephrase the claim.
- [Section V] No code-release or reproducibility statement is provided; please state whether the implementation will be made publicly available.
Circularity Check
No constructional circularity: the pseudo-labeling loop is a standard feedback mechanism, and the final OOD score is not defined as the graph-cut output.
full rationale
No load-bearing step in this paper reduces to its own inputs by definition. The pseudo-labels are produced by majority voting within graph-cut subgraphs built from learned features and ground-truth labels (Sec. IV-E), while the final OOD detector is a temperature-scaled energy score over classifier logits (Eq. 9), a distinct quantity rather than a restatement of subgraph purity or the pseudo-label rule. The model does train on its own pseudo-labels, but this is an iterative semi-supervised feedback loop, not a definitional identity, and the reported FPR95/AUROC numbers are not forced by that loop. The paper cites external work for the benchmarks and baseline numbers ([1]) and for learnability conditions ([71], [72]); none of these citations is by the present authors and none is used to forbid alternatives or to smuggle in the core assumption. The main methodological concern is that hyperparameters such as K, alpha, beta, gamma, delta, p_tau, and rho are selected using benchmark performance plots (Figs. 5-6) without an explicit separate validation split, so the headline margins may be optimistic; however, that is an experimental-validation risk, not circularity under the definitions used here. The central empirical claim is therefore self-contained as a benchmark comparison rather than being equivalent to its inputs by construction.
Assumptions & free parameters
free parameters (9)
- K (total subgraph number) =
1500 (CIFAR-10), 1800 (CIFAR-100)
- alpha (InfoNCE loss weight) =
0.15
- beta (equalization loss weight) =
0.5
- gamma (classification loss weight) =
1e-4
- delta (OOD decision threshold) =
0.7
- p_tau (edge connection threshold) =
0.3
- rho (labeled percentage threshold) =
0.5
- Temperature T in energy score =
not reported
- k (KNN neighbor count) =
not reported
assumptions (5)
- domain assumption Cosine similarity between feature embeddings measures semantic similarity across different label granularities.
- domain assumption A subgraph whose labeled percentage exceeds rho=0.5 is pure enough for majority voting to assign correct labels to all unlabeled members.
- domain assumption The SC-OOD benchmark partitions are semantically coherent, i.e., the designated ID samples in Tiny-ImageNet, LSUN, and Places365 truly share semantics with CIFAR classes.
- domain assumption The energy score with temperature-scaled logits separates ID from OOD samples.
- domain assumption Linkage and density learned on labeled nodes generalize to unlabeled nodes in the graph.
Cite this review
Pith. "Pith review of Adaptive Hierarchical Graph Cut for Multi-granularity Out-of-distribution Detection." pith.science (2026). https://pith.science/paper/T2E7ROG6
@misc{pith2026241215668,
  author       = {Pith},
  title        = {Pith review of: Adaptive Hierarchical Graph Cut for Multi-granularity Out-of-distribution Detection},
  year         = {2026},
  howpublished = {\url{https://pith.science/paper/T2E7ROG6}},
  note         = {Machine review of arXiv:2412.15668}
}
read the original abstract
This paper focuses on a significant yet challenging task: out-of-distribution detection (OOD detection), which aims to distinguish and reject test samples with semantic shifts, so as to prevent models trained on in-distribution (ID) data from producing unreliable predictions. Although previous works have made decent success, they are ineffective for real-world challenging applications since these methods simply regard all unlabeled data as OOD data and ignore the case that different datasets have different label granularity. For example, "cat" on CIFAR-10 and "tabby cat" on Tiny-ImageNet share the same semantics but have different labels due to various label granularity. To this end, in this paper, we propose a novel Adaptive Hierarchical Graph Cut network (AHGC) to deeply explore the semantic relationship between different images. Specifically, we construct a hierarchical KNN graph to evaluate the similarities between different images based on the cosine similarity. Based on the linkage and density information of the graph, we cut the graph into multiple subgraphs to integrate these semantics-similar samples. If the labeled percentage in a subgraph is larger than a threshold, we will assign the label with the highest percentage to unlabeled images. To further improve the model generalization, we augment each image into two augmentation versions, and maximize the similarity between the two versions. Finally, we leverage the similarity score for OOD detection. Extensive experiments on two challenging benchmarks (CIFAR- 10 and CIFAR-100) illustrate that in representative cases, AHGC outperforms state-of-the-art OOD detection methods by 81.24% on CIFAR-100 and by 40.47% on CIFAR-10 in terms of "FPR95", which shows the effectiveness of our AHGC.
Figures


Figures from the paper (4 more)



Reference graph
Works this paper leans on
-
[1]
Semantically coherent out-of-distribution detection,
J. Yang, H. Wang, L. Feng, X. Yan, H. Zheng, W. Zhang, and Z. Liu, “Semantically coherent out-of-distribution detection,” in Proceedings of the IEEE/CVF International Conference on Computer Vision , 2021, pp. 8301–8309
work page 2021
-
[2]
Learning multiple layers of features from tiny images,
A. Krizhevsky, “Learning multiple layers of features from tiny images,” Citeseer, 2009
2009
-
[3]
Tiny imagenet visual recognition challenge,
Y . Le and X. Yang, “Tiny imagenet visual recognition challenge,” CS 231N, vol. 7, no. 7, p. 3, 2015
2015
-
[4]
Fine-grained food classification methods on the uec food-100 database,
B. Arslan, S. Memis ¸, E. B. S¨onmez, and O. Z. Batur, “Fine-grained food classification methods on the uec food-100 database,”IEEE Transactions on Artificial Intelligence , vol. 3, no. 2, pp. 238–243, 2021
work page 2021
-
[5]
Garbagenet: a unified learning framework for robust garbage classification,
J. Yang, Z. Zeng, K. Wang, H. Zou, and L. Xie, “Garbagenet: a unified learning framework for robust garbage classification,” IEEE Transactions on Artificial Intelligence, vol. 2, no. 4, pp. 372–380, 2021
work page 2021
-
[6]
Approaches and applications of early classification of time series: A review,
A. Gupta, H. P. Gupta, B. Biswas, and T. Dutta, “Approaches and applications of early classification of time series: A review,” IEEE Transactions on Artificial Intelligence , vol. 1, no. 1, pp. 47–61, 2020
work page 2020
-
[7]
Result- based re-computation for error-tolerant classification by a support vector machine,
S. Liu, P. Reviriego, X. Tang, W. Tang, and F. Lombardi, “Result- based re-computation for error-tolerant classification by a support vector machine,” IEEE Transactions on Artificial Intelligence, vol. 1, no. 1, pp. 62–73, 2020
work page 2020
-
[8]
Multiscale repre- sentation learning for image classification: A survey,
L. Jiao, J. Gao, X. Liu, F. Liu, S. Yang, and B. Hou, “Multiscale repre- sentation learning for image classification: A survey,”IEEE Transactions on Artificial Intelligence , vol. 4, no. 1, pp. 23–43, 2021
work page 2021
Show all 72 references
-
[9]
Open set domain adaptation: Theoretical bound and algorithm,
Z. Fang, J. Lu, F. Liu, J. Xuan, and G. Zhang, “Open set domain adaptation: Theoretical bound and algorithm,” IEEE transactions on neural networks and learning systems , vol. 32, no. 10, pp. 4309–4322, 2020
2020
-
[10]
Uncertainty-aware op- timal transport for semantically coherent out-of-distribution detection,
F. Lu, K. Zhu, W. Zhai, K. Zheng, and Y . Cao, “Uncertainty-aware op- timal transport for semantically coherent out-of-distribution detection,” in Proceedings of the IEEE/CVF Conference on Computer Vision and Pattern Recognition, 2023, pp. 3282–3291
2023
-
[11]
Character-level street view text spotting based on deep multisegmen- tation network for smarter autonomous driving,
C. Zhang, Y . Tao, K. Du, W. Ding, B. Wang, J. Liu, and W. Wang, “Character-level street view text spotting based on deep multisegmen- tation network for smarter autonomous driving,” IEEE Transactions on Artificial Intelligence, vol. 3, no. 2, pp. 297–308, 2021
2021
-
[12]
An overview of artificial intelligence ethics,
C. Huang, Z. Zhang, B. Mao, and X. Yao, “An overview of artificial intelligence ethics,” IEEE Transactions on Artificial Intelligence , vol. 4, no. 4, pp. 799–819, 2022
2022
-
[13]
Accelerating point-voxel representation of 3d object detection for automatic driving,
J. Cao, C. Tao, Z. Zhang, Z. Gao, X. Luo, S. Zheng, and Y . Zhu, “Accelerating point-voxel representation of 3d object detection for automatic driving,” IEEE Transactions on Artificial Intelligence , 2023
2023
-
[14]
A baseline for detecting misclassified and out-of-distribution examples in neural networks,
D. Hendrycks and K. Gimpel, “A baseline for detecting misclassified and out-of-distribution examples in neural networks,” in International Conference on Learning Representations , 2016
2016
-
[15]
Improving calibration and out-of- distribution detection in deep models for medical image segmentation,
D. Karimi and A. Gholipour, “Improving calibration and out-of- distribution detection in deep models for medical image segmentation,” IEEE Transactions on Artificial Intelligence , vol. 4, no. 2, pp. 383–397, 2022
2022
-
[16]
Rule- based out-of-distribution detection,
G. De Bernardi, S. Narteni, E. Cambiaso, and M. Mongelli, “Rule- based out-of-distribution detection,” IEEE Transactions on Artificial Intelligence, 2023
2023
-
[17]
An out-of-distribution attack resistance approach to emotion categorization,
H. A. Shehu, W. N. Browne, and H. Eisenbarth, “An out-of-distribution attack resistance approach to emotion categorization,” IEEE Transac- tions on Artificial Intelligence , vol. 2, no. 6, pp. 564–573, 2021
2021
-
[18]
Few-shot learning network for out- of-distribution image classification,
I. Osman and M. S. Shehata, “Few-shot learning network for out- of-distribution image classification,” IEEE Transactions on Artificial Intelligence, 2022
2022
-
[19]
Learning bounds for open- set learning,
Z. Fang, J. Lu, A. Liu, F. Liu, and G. Zhang, “Learning bounds for open- set learning,” in International conference on machine learning. PMLR, 2021, pp. 3122–3132
2021
-
[20]
Enhancing the reliability of out- of-distribution image detection in neural networks,
S. Liang, Y . Li, and R. Srikant, “Enhancing the reliability of out- of-distribution image detection in neural networks,” in International Conference on Learning Representations , 2018
2018
-
[21]
Energy-based out-of-distribution detection,
W. Liu, X. Wang, J. Owens, and Y . Li, “Energy-based out-of-distribution detection,” Advances in neural information processing systems , vol. 33, pp. 21 464–21 475, 2020
2020
-
[22]
React: Out-of-distribution detection with rectified activations,
Y . Sun, C. Guo, and Y . Li, “React: Out-of-distribution detection with rectified activations,” Advances in Neural Information Processing Sys- tems, vol. 34, pp. 144–157, 2021
2021
-
[23]
A simple unified framework for detecting out-of-distribution samples and adversarial attacks,
K. Lee, K. Lee, H. Lee, and J. Shin, “A simple unified framework for detecting out-of-distribution samples and adversarial attacks,” Advances in neural information processing systems , vol. 31, 2018
2018
-
[24]
Self-supervised learning for generalizable out-of-distribution detection,
S. Mohseni, M. Pitale, J. Yadawa, and Z. Wang, “Self-supervised learning for generalizable out-of-distribution detection,” in Proceedings of the AAAI Conference on Artificial Intelligence , vol. 34, no. 04, 2020, pp. 5216–5223
2020
-
[25]
Out-of-distribution detection using an ensemble of self supervised leave-out classifiers,
A. Vyas, N. Jammalamadaka, X. Zhu, D. Das, B. Kaul, and T. L. Willke, “Out-of-distribution detection using an ensemble of self supervised leave-out classifiers,” in Proceedings of the European conference on computer vision (ECCV) , 2018, pp. 550–564
2018
-
[26]
Unsupervised out-of-distribution detection by maximum classifier discrepancy,
Q. Yu and K. Aizawa, “Unsupervised out-of-distribution detection by maximum classifier discrepancy,” in Proceedings of the IEEE/CVF international conference on computer vision , 2019, pp. 9518–9526
2019
-
[27]
Out-of-distribution detection using union of 1- dimensional subspaces,
A. Zaeemzadeh, N. Bisagno, Z. Sambugaro, N. Conci, N. Rah- navard, and M. Shah, “Out-of-distribution detection using union of 1- dimensional subspaces,” in Proceedings of the IEEE/CVF conference on Computer Vision and Pattern Recognition , 2021, pp. 9452–9461
2021
-
[28]
Generalized odin: Detecting out-of-distribution image without learning from out-of-distribution data,
Y .-C. Hsu, Y . Shen, H. Jin, and Z. Kira, “Generalized odin: Detecting out-of-distribution image without learning from out-of-distribution data,” in Proceedings of the IEEE/CVF conference on computer vision and pattern recognition, 2020, pp. 10 951–10 960
2020
-
[29]
How to exploit hyperspherical embeddings for out-of-distribution detection?
Y . Ming, Y . Sun, O. Dia, and Y . Li, “How to exploit hyperspherical embeddings for out-of-distribution detection?” in The Eleventh Interna- tional Conference on Learning Representations , 2023
2023
-
[30]
Adversarial reciprocal points learning for open set recognition,
G. Chen, P. Peng, X. Wang, and Y . Tian, “Adversarial reciprocal points learning for open set recognition,” IEEE Transactions on Pattern Analysis and Machine Intelligence, vol. 44, no. 11, pp. 8065–8081, 2021
2021
-
[31]
V os: Learning what you don’t know by virtual outlier synthesis,
X. Du, Z. Wang, M. Cai, and Y . Li, “V os: Learning what you don’t know by virtual outlier synthesis,” in ICLR, 2021
2021
-
[32]
Training confidence-calibrated classifiers for detecting out-of-distribution samples,
K. Lee, H. Lee, K. Lee, and J. Shin, “Training confidence-calibrated classifiers for detecting out-of-distribution samples,” in 6th International Conference on Learning Representations, ICLR 2018 , 2018
2018
-
[33]
Building robust classifiers through generation of confident out of distribution examples,
K. Sricharan and A. Srivastava, “Building robust classifiers through generation of confident out of distribution examples,” arXiv, 2018
2018
-
[34]
Out-of-distribution detection in classifiers via genera- tion,
S. Vernekar, A. Gaurav, V . Abdelzad, T. Denouden, R. Salay, and K. Czarnecki, “Out-of-distribution detection in classifiers via genera- tion,” arXiv preprint arXiv:1910.04241 , 2019
1910 arXiv
-
[35]
idecode: In-distribution equivariance for conformal out-of-distribution detection,
R. Kaur, S. Jha, A. Roy, S. Park, E. Dobriban, O. Sokolsky, and I. Lee, “idecode: In-distribution equivariance for conformal out-of-distribution detection,” in Proceedings of the AAAI Conference on Artificial Intelli- gence, vol. 36, no. 7, 2022, pp. 7104–7114
2022
-
[36]
Single layer predictive normalized maximum likelihood for out-of-distribution detection,
K. Bibas, M. Feder, and T. Hassner, “Single layer predictive normalized maximum likelihood for out-of-distribution detection,” NeurIPS, 2021
2021
-
[37]
Hierarchical novelty detection for visual object recognition,
K. Lee, K. Lee, K. Min, Y . Zhang, J. Shin, and H. Lee, “Hierarchical novelty detection for visual object recognition,” in CVPR, 2018. 14
2018
-
[38]
Why normalizing flows fail to detect out-of-distribution data,
P. Kirichenko, P. Izmailov, and A. G. Wilson, “Why normalizing flows fail to detect out-of-distribution data,” NeurIPS, 2020
2020
-
[39]
Input complexity and out-of-distribution detection with likelihood-based generative models,
J. Serr `a, D. ´Alvarez, V . G ´omez, O. Slizovskaia, J. F. N ´u˜nez, and J. Luque, “Input complexity and out-of-distribution detection with likelihood-based generative models,” in ICLR, 2019
2019
-
[40]
Hyperparameter-free out-of-distribution detection using cosine similarity,
E. Techapanurak, M. Suganuma, and T. Okatani, “Hyperparameter-free out-of-distribution detection using cosine similarity,” in ACCV, 2020
2020
-
[41]
Rethinking reconstruction autoencoder-based out-of- distribution detection,
Y . Zhou, “Rethinking reconstruction autoencoder-based out-of- distribution detection,” in CVPR, 2022, pp. 7379–7387
2022
-
[42]
Out-of-distribution detection with seman- tic mismatch under masking,
Y . Yang, R. Gao, and Q. Xu, “Out-of-distribution detection with seman- tic mismatch under masking,” in European Conference on Computer Vision. Springer, 2022, pp. 373–390
2022
-
[43]
Poem: Out-of-distribution detection with posterior sampling,
Y . Ming, Y . Fan, and Y . Li, “Poem: Out-of-distribution detection with posterior sampling,” in International Conference on Machine Learning . PMLR, 2022, pp. 15 650–15 665
2022
-
[44]
Conjnorm: Tractable density estimation for out-of-distribution detection,
B. Peng, Y . Luo, Y . Zhang, Y . Li, and Z. Fang, “Conjnorm: Tractable density estimation for out-of-distribution detection,” in The Twelfth International Conference on Learning Representations , 2024
2024
-
[45]
Deep residual learning for image recognition,
K. He, X. Zhang, S. Ren, and J. Sun, “Deep residual learning for image recognition,” in CVPR, 2016, pp. 770–778
2016
-
[46]
Graph convo- lutional neural network for human action recognition: A comprehensive survey,
T. Ahmad, L. Jin, X. Zhang, S. Lai, G. Tang, and L. Lin, “Graph convo- lutional neural network for human action recognition: A comprehensive survey,” IEEE Transactions on Artificial Intelligence , vol. 2, no. 2, pp. 128–145, 2021
2021
-
[47]
Prototype-based in- terpretable graph neural networks,
A. Ragno, B. La Rosa, and R. Capobianco, “Prototype-based in- terpretable graph neural networks,” IEEE Transactions on Artificial Intelligence, 2022
2022
-
[48]
Multivariate time series representation learning via hierarchical correlation pooling boosted graph neural network,
Y . Wang, M. Wu, X. Li, L. Xie, and Z. Chen, “Multivariate time series representation learning via hierarchical correlation pooling boosted graph neural network,” IEEE Transactions on Artificial Intelligence , 2023
2023
-
[49]
Sparse vicious attacks on graph neural networks,
G. Trappolini, V . Maiorca, S. Severino, E. Rodola, F. Silvestri, and G. Tolomei, “Sparse vicious attacks on graph neural networks,” IEEE Transactions on Artificial Intelligence , 2023
2023
-
[50]
A simple yet effective framelet-based graph neural network for directed graphs,
C. Zou, A. Han, L. Lin, M. Li, and J. Gao, “A simple yet effective framelet-based graph neural network for directed graphs,” IEEE Trans- actions on Artificial Intelligence , 2023
2023
-
[51]
Recognizing predictive substructures with subgraph information bottleneck,
J. Yu, T. Xu, Y . Rong, Y . Bian, J. Huang, and R. He, “Recognizing predictive substructures with subgraph information bottleneck,” IEEE transactions on pattern analysis and machine intelligence, vol. 46, no. 3, pp. 1650–1663, 2021
2021
-
[52]
Spectral clustering with graph neural networks for graph pooling,
F. M. Bianchi, D. Grattarola, and C. Alippi, “Spectral clustering with graph neural networks for graph pooling,” in International conference on machine learning . PMLR, 2020, pp. 874–883
2020
-
[53]
Graph cuts in vision and graphics: Theories and applications,
Y . Boykov and O. Veksler, “Graph cuts in vision and graphics: Theories and applications,” in Handbook of mathematical models in computer vision. Springer, 2006, pp. 79–96
2006
-
[54]
Inductive representation learning on large graphs,
W. Hamilton, Z. Ying, and J. Leskovec, “Inductive representation learning on large graphs,” Advances in neural information processing systems, vol. 30, 2017
2017
-
[56]
Deepcut: Unsupervised segmentation using graph neural networks clustering,
A. Aflalo, S. Bagon, T. Kashti, and Y . Eldar, “Deepcut: Unsupervised segmentation using graph neural networks clustering,” in Proceedings of the IEEE/CVF International Conference on Computer Vision , 2023, pp. 32–41
2023
-
[57]
Atten- tion multihop graph and multiscale convolutional fusion network for hyperspectral image classification,
H. Zhou, F. Luo, H. Zhuang, Z. Weng, X. Gong, and Z. Lin, “Atten- tion multihop graph and multiscale convolutional fusion network for hyperspectral image classification,” IEEE Transactions on Geoscience and Remote Sensing , vol. 61, pp. 1–14, 2023
2023
-
[58]
Supervised hierarchical clustering using graph neural networks for speaker diarization,
P. Singh, A. Kaul, and S. Ganapathy, “Supervised hierarchical clustering using graph neural networks for speaker diarization,” in ICASSP, 2023
2023
-
[59]
Learning hierarchical graph neural networks for image clustering,
Y . Xing, T. He, T. Xiao, Y . Wang, Y . Xiong, W. Xia, D. Wipf, Z. Zhang, and S. Soatto, “Learning hierarchical graph neural networks for image clustering,” in Proceedings of the IEEE/CVF International Conference on Computer Vision , 2021, pp. 3467–3477
2021
-
[60]
Improving knowledge-aware recommendation with multi-level interac- tive contrastive learning,
D. Zou, W. Wei, Z. Wang, X.-L. Mao, F. Zhu, R. Fang, and D. Chen, “Improving knowledge-aware recommendation with multi-level interac- tive contrastive learning,” in CIKM, 2022
2022
-
[61]
Graph attention networks,
P. Veli ˇckovi´c, G. Cucurull, A. Casanova, A. Romero, P. Li `o, and Y . Bengio, “Graph attention networks,” in ICLR, 2018
2018
-
[62]
Normalized cut-based saliency detection by adaptive multi-level region merging,
K. Fu, C. Gong, I. Y .-H. Gu, and J. Yang, “Normalized cut-based saliency detection by adaptive multi-level region merging,” IEEE TIP , vol. 24, no. 12, pp. 5671–5683, 2015
2015
-
[63]
Graph convo- lutional network for multi-label vhr remote sensing scene recognition,
N. Khan, U. Chaudhuri, B. Banerjee, and S. Chaudhuri, “Graph convo- lutional network for multi-label vhr remote sensing scene recognition,” Neurocomputing, vol. 357, pp. 36–46, 2019
2019
-
[64]
Rosenblatt et al
F. Rosenblatt et al. , Principles of neurodynamics: Perceptrons and the theory of brain mechanisms . Spartan books Washington, DC, 1962
1962
-
[65]
Describing textures in the wild,
M. Cimpoi, S. Maji, I. Kokkinos, S. Mohamed, and A. Vedaldi, “Describing textures in the wild,” in CVPR, 2014, pp. 3606–3613
2014
-
[66]
Reading digits in natural images with unsupervised feature learning,
N. Yuval, “Reading digits in natural images with unsupervised feature learning,” in Proceedings of the NIPS Workshop , 2011
2011
-
[67]
Lsun: Construction of a large-scale image dataset using deep learning with humans in the loop,
F. Yu, A. Seff, Y . Zhang, S. Song, T. Funkhouser, and J. Xiao, “Lsun: Construction of a large-scale image dataset using deep learning with humans in the loop,” arXiv preprint arXiv:1506.03365 , 2015
2015 arXiv
-
[68]
Places: A 10 million image database for scene recognition,
B. Zhou, A. Lapedriza, A. Khosla, A. Oliva, and A. Torralba, “Places: A 10 million image database for scene recognition,” IEEE TPAMI, vol. 40, no. 6, 2018
2018
-
[69]
Deep anomaly detection with outlier exposure,
D. Hendrycks, M. Mazeika, and T. Dietterich, “Deep anomaly detection with outlier exposure,” in ICLR, 2018
2018
-
[70]
Feed two birds with one scone: Exploiting wild data for both out-of-distribution generalization and detection,
H. Bai, G. Canal, X. Du, J. Kwon, R. D. Nowak, and Y . Li, “Feed two birds with one scone: Exploiting wild data for both out-of-distribution generalization and detection,” in International Conference on Machine Learning. PMLR, 2023, pp. 1454–1471
2023
-
[71]
Is out-of-distribution detection learnable?
Z. Fang, Y . Li, J. Lu, J. Dong, B. Han, and F. Liu, “Is out-of-distribution detection learnable?” Advances in Neural Information Processing Sys- tems, vol. 35, pp. 37 199–37 213, 2022
2022
-
[72]
On the learnability of out-of- distribution detection,
Z. Fang, Y . Li, F. Liu, B. Han, and J. Lu, “On the learnability of out-of- distribution detection,” Journal of Machine Learning Research , vol. 25, 2024
2024
-
[73]
The graph neural network model,
F. Scarselli, M. Gori, A. C. Tsoi, M. Hagenbuchner, and G. Monfar- dini, “The graph neural network model,” IEEE transactions on neural networks, vol. 20, no. 1, pp. 61–80, 2008
2008
Reviewed August 11, 2026 · model on record in the stance chip above.
Discussion (0). Continue with ORCID to comment.