REVIEW 3 major objections 8 minor 45 references
A region-wide, multi-year set of crop field boundary labels for Africa
T0 review · 3 major / 8 minor · reviewed 2026-08-11 · deepseek-v4-flash
Pith's one-line read This paper provides a public, multi-year sample of crop field boundaries for Africa and measures its quality with weighted scores and Bayesian risk.
desk verdict A genuinely useful public dataset: the first multi-year, region-wide field-boundary label set for sub-Saharan Africa, with honest quality metrics; the main caveat is that quality is measured against internal expert labels, not independent ground truth. read the letter →
The pith
A machine-rendered reading of the paper's core claim, the machinery that carries it, and where it could break.
The reading
What carries the argument
The mechanism that carries the argument is a two-part quality-assessment pipeline built into the labelling workflow. The first part is a weighted quality score, $Qscore = 0.55\cdot Area + 0.225\cdot N + 0.1\cdot Edge + 0.125\cdot Categorical$, which compares each labeller's polygons against expert reference labels; the second is a Bayesian risk metric that converts multi-labeller disagreement into a per-pixel consensus probability and a risk value between 0 and 0.5. These two instruments let the dataset be released with per-label confidence information, and they supply the evidence for the paper's claims about label quality and the geographic pattern of uncertain labels.
What would settle it
Select a random subset of the labelled sites and compare every polygon against independent sub-2 m satellite imagery or GPS field surveys; if edge agreement and field-count agreement remain low even for the highest-scoring labels, then the Qscore measures expert consistency rather than true boundary accuracy.
Extended reading notes
Core claim
The central claim is that a continent-wide, multi-year sample of crop field boundaries can be produced from publicly available satellite mosaics at 4.8 m resolution, and that doing so yields a dataset both large and characterizable enough to support machine learning and agricultural analysis. To establish this, the paper combines a custom labelling platform with multiple quality checks: expert-drawn reference labels (Class 1a), single-labeller assignments (Class 2), and multi-labeller sites (Class 4) whose disagreement is turned into a Bayesian pixel-level risk score. The reported quality metrics, a 0.75 area agreement but 0.33 field-count and 0.05 edge agreement, are presented as the expected consequence of smallholder field sizes at this resolution, and the paper argues this still leaves the dataset valuable for training field mapping models and for documenting regional differences in field size and density.
Load-bearing premise
The quality scores and risk estimates treat expert labels made from the same 4.8 m satellite images as reference truth, so if those experts systematically miss the same small or unclear fields as the regular labellers, the reported quality overstates accuracy.
Editorial extensions
If this is right
- Models trained on these labels could map field boundaries across sub-Saharan Africa where no equivalent training data exists.
- Users can filter the dataset by Qscore or risk threshold to obtain higher-confidence subsets for validation or fine-tuning.
- The 2,191 multi-labeller sites provide a ready-made benchmark for measuring label uncertainty in future field delineation studies.
- The country- and grid-scale field-size statistics update existing estimates of field size for Africa and highlight places where further very-high-resolution mapping is most needed.
Reading between the lines
- If the expert reference labels were drawn from the same 4.8 m imagery, the reported quality scores should be read as consistency with expert interpretation rather than accuracy against the ground; a very-high-resolution validation would likely lower the edge and count metrics further.
- The rising field sizes detected in Tanzania and Chad are consistent with earlier reports of medium-scale farm growth, but the seven-year window and sampling design cannot separate land consolidation from image-interpretation effects; testing would require repeated labels at fixed sites.
- The dataset could be paired with other public field-boundary resources to test whether models trained on 4.8 m labels transfer to finer-resolution imagery, and whether the published quality scores predict which labels transfer best.
Editorial analysis
A structured set of objections, weighed in public.
Referee Report
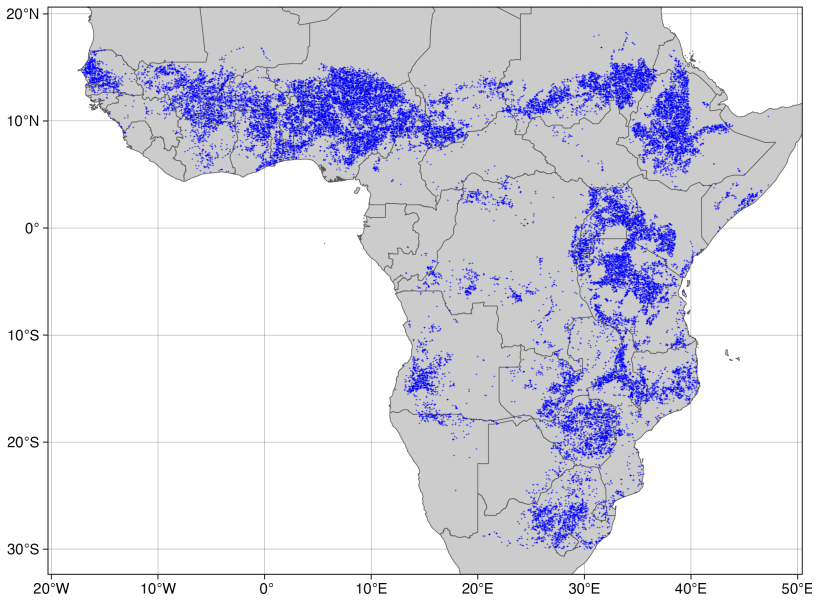
Summary. The paper describes the creation and public release of a large set of crop field boundary labels for Africa, derived from 33,746 NICFI Planet images acquired between 2017 and 2023. The authors sampled ~500 m cells from cropland areas, assigned them to years, downloaded and normalized Planet mosaics, and had labelling teams digitize field boundaries using a custom platform. They collected 42,403 assignments, including expert quality-control labels (Class 1), single-labeller labels (Class 2), and multi-labeller labels (Class 4). Quality is reported through a weighted Qscore (area, field count, edge, categorical agreement), expert review scores, and a Bayesian risk metric. The paper also presents regional statistics on field sizes and counts. The imagery, labels, and metadata are available from the AWS Registry of Open Data and Zenodo.
Significance. The dataset is a significant community resource: it is publicly accessible, spans a broad geographic and temporal range, and provides per-label quality metadata that can be used for filtering or weighting during model training. The release of code and data repositories is a concrete strength. The authors are also to be commended for reporting the low field-count (0.33) and edge (0.05) metrics rather than only a favourable summary score. However, the quality scores are computed against an internal reference (Class 1a labels) produced from the same imagery, so they measure inter-annotator agreement rather than absolute mapping accuracy. The paper's value as a training resource is plausible but depends on users treating the quality scores as relative indicators.
major comments (3)
- [Section 2.4.2, Eq. (1), Table 2] The definitions of the Qscore components are not sufficiently precise for this dataset to be used as claimed. Area is described in words, but N, Edge, and Categorical are only characterized qualitatively (e.g., 'a measure of how close the boundaries of the labeller’s polygons were to those of the Class 1 label'). Since the quality scores are a central deliverable, the exact algorithms—including any tolerance or buffering used for Edge, how fields are matched for N, and how Categorical agreement is computed—should be specified in an appendix, or at least the relevant section of Estes et al. (2022) should be reproduced in enough detail that the metrics are unambiguous.
- [Sections 2.4.2, 2.4.4, and 4.2] All reported quality scores and the Bayesian risk are calculated relative to Class 1a labels, which were created by expert interpretation of the same 4.8 m Planet mosaics. The scores therefore quantify agreement with an internal reference, not accuracy against independent ground truth. Given the low N (0.33) and Edge (0.05) values, the manuscript should either provide a small external validation subset (e.g., a comparison against sub-2 m imagery or field surveys) or restrict the claims in Section 4.1 accordingly. Without such anchoring, statements that these labels 'can be used to train and assess... field boundary mapping models' overstate what the reported metrics establish.
- [Section 2.4.3 versus Section 3.2] The number of expert-reviewed assignments is inconsistent: Section 2.4.3 states that two supervisors independently reviewed 4348 assignments, while Section 3.2 reports Rscore as the proportion of passing assignments among 2999 reviewed assignments. The paper should clarify the relationship between these numbers (e.g., whether some assignments were excluded or whether the 4348 includes both supervisors' ratings). Because Rscore is presented as one of the main quality metrics, this discrepancy undermines the reproducibility of the summary statistics.
minor comments (8)
- [Abstract] The sentence 'The imagery and vectorized labels along with quality information is available' should read 'are available'.
- [Section 2.1] 'consituted' should be 'constituted'.
- [Section 2.3] The phrase 'Class 3 locations where therefore re-allocated' should be 'were therefore re-allocated'.
- [Section 3.3] In the list of countries with the lowest field counts, 'Namibia' is repeated; one occurrence should be removed.
- [Figure 5 caption] The caption is confusing: panels A and B are maps, while C and D are histograms, but the text reads as if A and C form the map/histogram pair. Please revise for clarity.
- [Equation 2] The symbol D is used both for the data (the set of labels) and for the modal label value, making the conditioning notation unclear. I recommend distinguishing the modal class from the full set of labels.
- [Sections 2.2 and 4.2] The resampling resolution is described as 'approximately 3 m' in Section 2.2 and as '<3 m' in Section 4.2; please use one consistent value.
- [Abstract and Section 4.2] The sentence 'previous work shows that such labels can train effective field mapping models' is general and uncited; if it refers to the authors' earlier work, please cite it explicitly at that point.
Circularity Check
No significant circularity: reported quality scores are transparently defined relative to in-project Class 1a reference labels, and the dataset release does not reduce to a fitted prediction or load-bearing self-citation.
full rationale
This is a dataset paper rather than a derivation of a predictive result. The quality metrics in Eq. 1 are explicitly agreement measures against Class 1a labels produced by expert analysts on the same Planet mosaics; the paper does not present these as absolute accuracies against independent ground truth, and Section 4.2 discloses that the 4.88 m resolution is too coarse to effectively distinguish the smallest fields and that the data are biased toward larger size classes. The Bayesian risk in Eqs. 2-3 uses Qscore-derived weights, so it is a consensus and uncertainty measure conditional on the same reference standard, not a validation against external reference data; this is a reference-standard limitation, not a circular derivation. No parameter is fitted and renamed as a prediction, and the central deliverable (public image chips, vector labels, and quality information) is independent of the self-citations to the authors' prior labelling platform and mapping work, which are contextual rather than load-bearing. The low Edge (0.05) and N (0.33) values are reported as results, which further indicates the metrics are not inflated to support a desired conclusion.
Assumptions & free parameters
free parameters (6)
- Qscore component weights =
0.55 Area, 0.225 N, 0.1 Edge, 0.125 Categorical
- Risk threshold for 'risky' pixels =
0.34
- Minimum cropland cover for sample inclusion =
50%
- Country and grid-cell sample size cutoffs =
30 sites per country; 10 sites per 1-degree cell
- Rasterization resolution for risk computation =
224x224 pixels per site
- Expert review passing threshold =
Ratings 2-4 pass; 0-1 fail
assumptions (4)
- domain assumption The UMD cropland layer (Potapov et al. 2022) accurately identifies cropland extent for sampling.
- domain assumption Planet NICFI 4.8 m mosaics are sharp enough for humans to recognize a large proportion of smallholder fields.
- domain assumption Agreement with Class 1a expert labels is a valid proxy for label correctness.
- domain assumption Random assignment of sites to years provides a representative temporal sample for trend analysis.
Cite this review
Pith. "Pith review of A region-wide, multi-year set of crop field boundary labels for Africa." pith.science (2026). https://pith.science/paper/QCSAXVBW
@misc{pith2026241218483,
  author       = {Pith},
  title        = {Pith review of: A region-wide, multi-year set of crop field boundary labels for Africa},
  year         = {2026},
  howpublished = {\url{https://pith.science/paper/QCSAXVBW}},
  note         = {Machine review of arXiv:2412.18483}
}
read the original abstract
African agriculture is undergoing rapid transformation. Annual maps of crop fields are key to understanding the nature of this transformation, but such maps are currently lacking and must be developed using advanced machine learning models trained on high resolution remote sensing imagery. To enable the development of such models, we delineated field boundaries in 33,746 Planet images captured between 2017 and 2023 across the continent using a custom labeling platform with built-in procedures for assessing and mitigating label error. We collected 42,403 labels, including 7,204 labels arising from tasks dedicated to assessing label quality (Class 1 labels), 32,167 from sites mapped once by a single labeller (Class 2) and 3,032 labels from sites where 3 or more labellers were tasked to map the same location (Class 4). Class 1 labels were used to calculate labeller-specific quality scores, while Class 1 and 4 sites mapped by at least 3 labellers were used to further evaluate label uncertainty using a Bayesian risk metric. Quality metrics showed that label quality was moderately high (0.75) for measures of total field extent, but low regarding the number of individual fields delineated (0.33), and the position of field edges (0.05). These values are expected when delineating small-scale fields in 3-5 m resolution imagery, which can be too coarse to reliably distinguish smaller fields, particularly in dense croplands, and therefore requires substantial labeller judgement. Nevertheless, previous work shows that such labels can train effective field mapping models. Furthermore, this large, probabilistic sample on its own provides valuable insight into regional agricultural characteristics, highlighting variations in the median field size and density. The imagery and vectorized labels along with quality information is available for download from two public repositories.
Figures


Figures from the paper (5 more)


Reference graph
Works this paper leans on
-
[1]
Brückner, M. 2012. Economic growth, size of the agricultural sector, and urbanization in africa https://doi.org/10.1016/j.jue.2011.08.004. Journal of Urban Economics 71:26--36
-
[2]
Bullock, E. L., S. P. Healey, Z. Yang, P. Oduor, N. Gorelick, S. Omondi, E. Ouko, and W. B. Cohen. 2021. Three Decades of Land Cover Change in East Africa https://doi.org/10.3390/land10020150. Land 10:150
-
[3]
Burke, M., A. Driscoll, D. B. Lobell, and S. Ermon. 2021. Using satellite imagery to understand and promote sustainable development https://doi.org/10.1126/science.abe8628. Science 371
-
[4]
Davis, K. F., H. I. Koo, J. Dell'Angelo, P. D'Odorico, L. Estes, L. J. Kehoe, M. Kharratzadeh, T. Kuemmerle, D. Machava, A. de J. R. Pais, N. Ribeiro, M. C. Rulli, and M. Tatlhego. 2020. Tropical forest loss enhanced by large-scale land acquisitions https://doi.org/10.1038/s41561-020-0592-3. Nature Geoscience:1--7
-
[5]
Davis, K. F., M. F. Müller, M. C. Rulli, M. Tatlhego, S. Ali, J. A. Baggio, J. Dell'Angelo, S. Jung, L. Kehoe, M. T. Niles, and S. Eckert. 2023. Transnational agricultural land acquisitions threaten biodiversity in the Global South https://doi.org/10.1088/1748-9326/acb2de. Environmental Research Letters 18:024014
-
[6]
Diakogiannis, F. I., F. Waldner, P. Caccetta, and C. Wu. 2020. ResUNet-a: a deep learning framework for semantic segmentation of remotely sensed data https://doi.org/10.1016/j.isprsjprs.2020.01.013. arXiv:1904.00592 [ cs ]
arXiv 2020
-
[7]
Elmes, A., H. Alemohammad, R. Avery, K. Caylor, J. R. Eastman, L. Fishgold, M. A. Friedl, M. Jain, D. Kohli, J. C. Laso Bayas, D. Lunga, J. L. McCarty, R. G. Pontius, A. B. Reinmann, J. Rogan, L. Song, H. Stoynova, S. Ye, Z.-F. Yi, and L. Estes. 2020. Accounting for training data error in machine learning applied to Earth Observations https://doi.org/10.3...
-
[8]
Estes, L. D., B. A. Bradley, H. Beukes, D. G. Hole, M. Lau, M. G. Oppenheimer, R. Schulze, M. A. Tadross, and W. R. Turner. 2013. Comparing mechanistic and empirical model projections of crop suitability and productivity: Implications for ecological forecasting https://doi.org/10.1111/Geb.12034. Global Ecology and Biogeography 22:1007--1018
Show all 45 references
-
[9]
Estes, L. D., D. McRitchie, J. Choi, S. Debats, T. Evans, W. Guthe, D. Luo, G. Ragazzo, R. Zempleni, and K. K. Caylor. 2016. A platform for crowdsourcing the creation of representative, accurate landcover maps https://doi.org/10.1016/j.envsoft.2016.01.011. Environmental Modell...
2016 doi
-
[10]
Estes, L. D., S. Ye, L. Song, B. Luo, J. R. Eastman, Z. Meng, Q. Zhang, D. McRitchie, S. R. Debats, J. Muhando, A. H. Amukoa, B. W. Kaloo, J. Makuru, B. K. Mbatia, I. M. Muasa, J. Mucha, A. M. Mugami, J. M. Mugami, F. W. Muinde, F. M. Mwawaza, J. Ochieng, C. J. Oduol, P. Oduor...
2022
-
[11]
E., D.-H
Fagan, M. E., D.-H. Kim, W. Settle, L. Ferry, J. Drew, H. Carlson, J. Slaughter, J. Schaferbien, A. Tyukavina, N. L. Harris, E. Goldman, and E. M. Ordway. 2022. The expansion of tree plantations across tropical biomes https://doi.org/10.1038/s41893-022-00904-w. Nature Sustaina...
2022 doi
-
[12]
Foody, G. M. 2024. Ground Truth in Classification Accuracy Assessment: Myth and Reality https://doi.org/10.3390/geomatics4010005. Geomatics 4:81--90
2024 doi
-
[13]
Fourie, A. 2009. Better crop estimates in south africa http://www.esri.com/news/arcuser/0109/crop_estimates.html. ArcUser Online
2009
-
[14]
Fritz, S., L. See, I. McCallum, L. You, A. Bun, E. Moltchanova, M. Duerauer, F. Albrecht, C. Schill, C. Perger, P. Havlik, A. Mosnier, P. Thornton, U. Wood-Sichra, M. Herrero, I. Becker-Reshef, C. Justice, M. Hansen, P. Gong, S. Abdel Aziz, A. Cipriani, R. Cumani, G. Cecchi, G...
2015
-
[15]
Zheng, and J
Gong, P., X. Zheng, and J. Chen. 1995. Boundary uncertainties in digitized maps: An experiment on digitization errors https://doi.org/10.1080/10824009509480472. Geographic Information Sciences 1:65--72
1995 doi
-
[16]
Hancher, M
Gorelick, N., M. Hancher, M. Dixon, S. Ilyushchenko, D. Thau, and R. Moore. 2017. Google earth engine: Planetary-scale geospatial analysis for everyone https://doi.org/10.1016/j.rse.2017.06.031. Remote Sensing of Environment 202:18--27
2017 doi
-
[17]
Hall, J. V., F. Argueta, and L. Giglio. 2024. GloCAB cropland field boundary dataset https://doi.org/10.1016/j.dib.2024.110739. Data in Brief 55:110739
2024
-
[18]
Henderson, J. V., A. Storeygard, and U. Deichmann. 2017. Has climate change driven urbanization in africa? https://doi.org/10.1016/j.jdeveco.2016.09.001 Journal of Development Economics 124:60--82
2017 doi
-
[19]
Hollander, M., and D. A. Wolfe. 1973. Nonparametric statistical methods. John Wiley & Sons, New York
1973
-
[21]
Jayne, T. s., J. Chamberlin, L. Traub, N. Sitko, M. Muyanga, F. K. Yeboah, W. Anseeuw, A. Chapoto, A. Wineman, C. Nkonde, and R. Kachule. 2016. Africa's changing farm size distribution patterns: the rise of medium-scale farms https://doi.org/10.1111/agec.12308. Agricultural Ec...
2016 doi
-
[22]
Chaudhari, A
Kerner, H., S. Chaudhari, A. Ghosh, C. Robinson, A. Ahmad, E. Choi, N. Jacobs, C. Holmes, M. Mohr, R. Dodhia, J. M. L. Ferres, and J. Marcus. 2024. Fields of the world: A machine learning benchmark dataset for global agricultural field boundary segmentation https://doi.org/10....
-
[23]
Abedi, H
Khallaghi, S., R. Abedi, H. A. Ali, H. Alemohammad, M. D. Asipunu, I. Alatise, N. Ha, B. Luo, C. Mai, L. Song, A. Wussah, S. Xiong, Y.-T. Yao, Q. Zhang, and L. D. Estes. 2024. Generalization enhancement strategies to enable cross-year cropland mapping with convolutional neural...
-
[24]
Kimambo, N. E., J. L'Roe, L. Naughton-Treves, and V. C. Radeloff. 2020. https://doi.org/10.1016/j.forpol.2020.102144 The role of smallholder woodlots in global restoration pledges lessons from tanzania . Forest Policy and Economics 115:102144
2020
-
[25]
Komsta, L. 2019. Mblm: Median-based linear models https://CRAN.R-project.org/package=mblm. R package version 0.12.1
2019
-
[26]
Lesiv, M., J. C. Laso Bayas, L. See, M. Duerauer, D. Dahlia, N. Durando, R. Hazarika, P. Kumar Sahariah, M. Vakolyuk, V. Blyshchyk, A. Bilous, A. Perez-Hoyos, S. Gengler, R. Prestele, S. Bilous, I. ul H. Akhtar, K. Singha, S. B. Choudhury, T. Chetri, Ž. Malek, K. Bungnamei, A....
2019
-
[27]
Lesiv, M., L. See, J. Laso Bayas, T. Sturn, D. Schepaschenko, M. Karner, I. Moorthy, I. McCallum, and S. Fritz. 2018. Characterizing the spatial and temporal availability of very high resolution satellite imagery in Google Earth and Microsoft Bing maps as a source of reference...
2018 doi
-
[28]
Zhang, Q
Lu, R., Y. Zhang, Q. Huang, P. Zeng, Z. Shi, and S. Ye. 2024. A refined edge-aware convolutional neural networks for agricultural parcel delineation https://doi.org/10.1016/j.jag.2024.104084. International Journal of Applied Earth Observation and Geoinformation 133:104084
2024
-
[29]
McRoberts, R. E., S. V. Stehman, G. C. Liknes, E. Næsset, C. Sannier, and B. F. Walters. 2018. The effects of imperfect reference data on remote sensing-assisted estimators of land cover class proportions https://doi.org/10.1016/j.isprsjprs.2018.06.002. ISPRS Journal of Photog...
2018 doi
-
[30]
Nakalembe, C., and H. Kerner. 2023. Considerations for AI-EO for agriculture in Sub-Saharan Africa https://doi.org/10.1088/1748-9326/acc476. Environmental Research Letters 18:041002
2023 doi
-
[31]
NICFI. 2024. https://www.planet.com/nicfi/ Norway ' s international climate and forest initiative . https://www.planet.com/nicfi/
2024
-
[32]
Turubanova, M
Potapov, P., S. Turubanova, M. C. Hansen, A. Tyukavina, V. Zalles, A. Khan, X.-P. Song, A. Pickens, Q. Shen, and J. Cortez. 2022. Global maps of cropland extent and change show accelerated cropland expansion in the twenty-first century https://doi.org/10.1038/s43016-021-00429-...
2022 doi
-
[33]
Fischer, and T
Ronneberger, O., P. Fischer, and T. Brox. 2015. U-Net: Convolutional Networks for Biomedical Image Segmentation https://doi.org/10.1007/978-3-319-24574-4_28. Pages 234--241 in N. Navab, J. Hornegger, W. M. Wells, and A. F. Frangi, editors. Springer International Publishing, Cham
2015 doi
-
[34]
Rufin, P., S. Wang, S. N. Lisboa, J. Hemmerling, M. G. Tulbure, and P. Meyfroidt. 2024. Taking it further: Leveraging pseudo-labels for field delineation across label-scarce smallholder regions https://doi.org/10.1016/j.jag.2024.104149. International Journal of Applied Earth O...
2024
-
[35]
Searchinger, T. D., L. Estes, P. K. Thornton, T. Beringer, A. Notenbaert, D. Rubenstein, R. Heimlich, R. Licker, and M. Herrero. 2015. High carbon and biodiversity costs from converting africa's wet savannahs to cropland https://doi.org/10.1038/nclimate2584. Nature Climate Cha...
2015 doi
-
[36]
Sen, P. K. 1968. Estimates of the regression coefficient based on kendall's tau https://doi.org/10.1080/01621459.1968.10480934. Journal of the American Statistical Association 63:1379--1389
1968
-
[37]
Siegel, A. F. 1982. Robust regression using repeated medians https://doi.org/10.1093/biomet/69.1.242. Biometrika 69:242--244
1982 doi
-
[38]
J., and T
Sitko, N. J., and T. S. Jayne. 2014. https://doi.org/10.1016/j.foodpol.2014.05.006 Structural transformation or elite land capture? The growth of `` emergent '' farmers in zambia . Food Policy 48:194--202
2014 doi
-
[39]
Chamberlin
Sitko, N., and J. Chamberlin. 2015. The anatomy of medium-scale farm growth in zambia: What are the implications for the future of smallholder agriculture? https://doi.org/10.3390/land4030869 Land 4:869--887
2015 doi
-
[40]
Song, L., A. B. Estes, and L. D. Estes. 2023. A super-ensemble approach to map land cover types with high resolution over data-sparse African savanna landscapes https://doi.org/10.1016/j.jag.2022.103152. International Journal of Applied Earth Observation and Geoinformation 116:103152
2023
-
[41]
Theil, H. 1950. A rank-invariant method of linear and polynomial regression analysis, part 3. Page 13971412
1950
-
[42]
Waldner, F., and F. I. Diakogiannis. 2020. Deep learning on edge: Extracting field boundaries from satellite images with a convolutional neural network https://doi.org/10.1016/j.rse.2020.111741. Remote Sensing of Environment 245:111741
2020
-
[43]
Waldner, and D
Wang, S., F. Waldner, and D. B. Lobell. 2022. Unlocking large-scale crop field delineation in smallholder farming systems with transfer learning and weak supervision https://doi.org/10.3390/rs14225738. Remote Sensing 14:5738
2022 doi
-
[44]
Wussah, A. O., M. D. Asipinu, and L. D. Estes. 2022. Final report - phase 2: Creating next generation field boundary and crop type maps rigorous multi-scale groundtruth provides sustainable extension services for smallholders https://cropanalytics.net/wp-content/uploads/2022/1...
2022
-
[45]
Xiong, J., P. S. Thenkabail, J. C. Tilton, M. K. Gumma, P. Teluguntla, A. Oliphant, R. G. Congalton, K. Yadav, and N. Gorelick. 2017. Nominal 30-m Cropland Extent Map of Continental Africa by Integrating Pixel-Based and Object-Based Algorithms Using Sentinel-2 and Landsat-8 Da...
2017 doi
-
[46]
Huang, K
Yaras, C., B. Huang, K. Bradbury, and J. M. Malof. 2021. Randomized histogram matching: A simple augmentation for unsupervised domain adaptation in overhead imagery https://doi.org/10.48550/arXiv.2104.14032. arXiv:2104.14032. CSLReferences * Appendix appendix toc section Appen...
Reviewed August 11, 2026 · model on record in the stance chip above.
Discussion (0). Continue with ORCID to comment.