REVIEW 3 major objections 7 minor 32 references
Flux channeling induced nano-confinement and enhancement of microwaves imaged by Rabi oscillation mapping
T0 review · 3 major / 7 minor · reviewed 2026-08-10 · deepseek-v4-flash
Pith's one-line read Flux channeling through a permalloy nanowire concentrates 2.85 GHz microwaves into sub-300 nm hotspots with up to 2.35x amplitude enhancement, as mapped quantitatively by NV Rabi oscillations.
desk verdict A credible nanoscale microwave-field imaging result with an honest core measurement, but the headline 16x enhancement is a fitted extrapolation and the magnetic mechanism needs a sharper control to be secure. read the letter →
The pith
A machine-rendered reading of the paper's core claim, the machinery that carries it, and where it could break.
The reading
What carries the argument
The two load-bearing pieces are the permalloy nanowire as a flux channel and the NV Rabi-oscillation measurement. Flux channeling is the concentration of magnetic flux in a material whose relative permeability exceeds one, which amplifies an applied AC field; here the 20-nm, 350-nm-wide permalloy wire is chosen, with a predicted ferromagnetic resonance above 7 GHz, so that 2.85 GHz lies below resonance where the real permeability is large. The NV center acts as a quantitative field probe because its Rabi frequency $\Omega_R = \gamma_{\mathrm{NV}} B_{\mathrm{MW}}$ is proportional to the microwave amplitude perpendicular to the NV axis, so mapping Rabi frequency across the sample directly maps the local RF field. Micromagnetic simulations supply the interpretation: the simulated AC stray field of the wire, added in-phase or out-of-phase with the incident field, reproduces the measured spatial pattern and the observed height-decay constants of roughly 3 to 6 $\mu$m$^{-1}$.
What would settle it
Replace the permalloy nanowire with an identically shaped non-magnetic metal and map the Rabi frequency across the same region: disappearance of the sub-300 nm enhancement and suppression pattern would confirm flux channeling, while persistence would implicate eddy currents or scattering.
Extended reading notes
Core claim
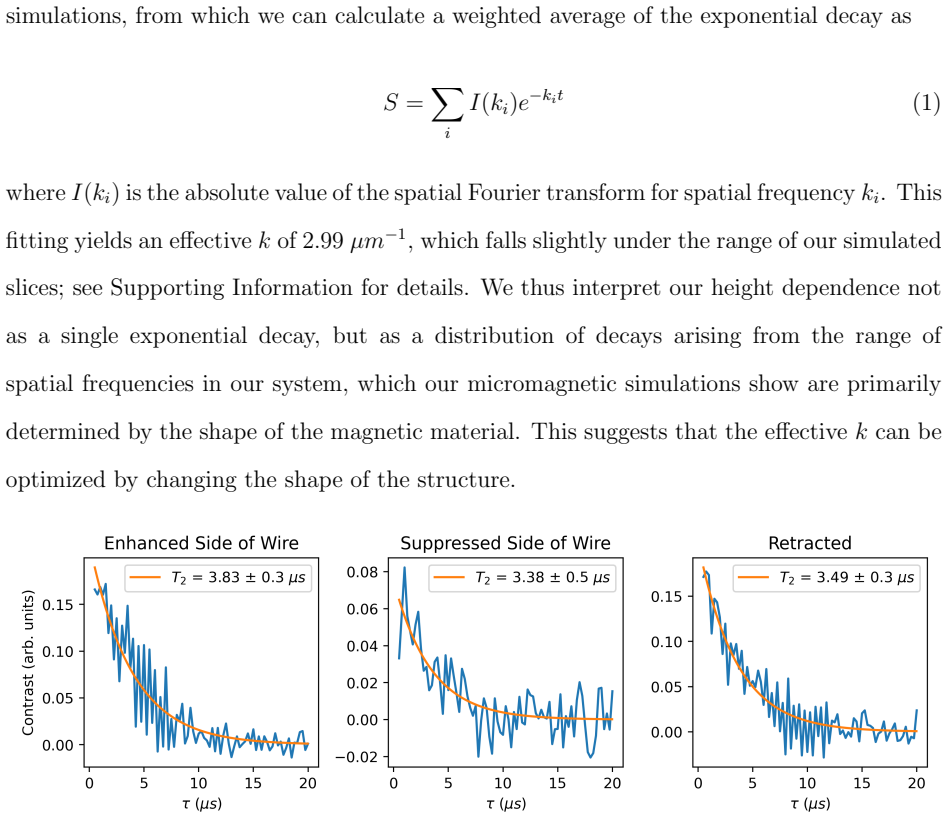
On the paper's own terms, the discovery is that a patterned soft-ferromagnetic nanowire modulates a GHz-range microwave field in a strongly localized way, and that this modulated field can be read out quantitatively with an NV center. Rabi maps show enhanced Rabi frequency along one edge of the nanowire and suppression along the other, with the enhancement reaching 2.35x at 84 nm separation and extrapolating to about 4x (about 16x in power) at the surface. Micromagnetic simulations reproduce the enhancement and suppression pattern as constructive and destructive interference between the incident microwave field and the nanowire's AC stray field, which is generated by the wire's magnetization response. The authors further show that the modulation is independent of magnetic texture away from a domain-wall pinning site, is stable over a 20 dBm microwave-power range, and does not degrade the NV's T2 coherence time.
Load-bearing premise
The central claim depends on permalloy behaving as a high-permeability magnetic medium at 2.85 GHz, a property inferred from a predicted ferromagnetic resonance above 7 GHz rather than measured directly, so eddy currents or plain microwave scattering could in principle produce the same pattern.
Editorial extensions
If this is right
- A single lithographed permalloy nanowire can deliver a 2.35x field boost (a 6x reduction in needed drive power) to a nearby qubit, with the hotspot localized to a few hundred nanometers laterally and vertically.
- Extrapolating the height dependence to the nanowire surface, the same unoptimized geometry would give about 4x amplitude enhancement, or about 16x in power.
- The enhancement factor is unchanged across a 20 dBm microwave-power range, so the channeling effect is linear and does not need power-dependent recalibration.
- Hahn spin-echo measurements show the NV coherence time is unchanged within one standard deviation over both the enhanced and suppressed regions, so the flux channel does not add spin noise.
- Material and geometry optimization, such as using lower-loss ferrites or shaping the wire to bring FMR closer to the drive frequency, should increase the enhancement and localization further.
Reading between the lines
- A control experiment on an identically shaped non-magnetic metal nanowire would separate eddy-current or scattering effects from true magnetic flux channeling, and the paper does not report one.
- Because the simulations link the effective decay constant $k$ to the spatial-frequency spectrum of the wire's shape, the vertical extent of the hotspot could be engineered to match the depth of a buried qubit.
- The same NV Rabi-mapping technique could be applied to image the near-field of other on-chip GHz components, such as antennas, resonators, and transformers, distinguishing local magnetic-response effects from geometric antenna effects.
- If the real part of the permeability just below FMR is the controlling factor, moving the wire's FMR closer to the drive frequency via lamination or shape anisotropy could push enhancements beyond the extrapolated 4x, at the cost of increased losses near resonance.
Signed reviews
Editorial analysis
A structured set of objections, weighed in public.
Referee Report
Summary. The manuscript reports scanning NV magnetometry measurements of Rabi oscillations near a 20-nm-thick permalloy nanowire with a notch, showing that the microwave field amplitude, inferred from the local Rabi frequency, is enhanced on one edge of the wire and suppressed on the other, with the modulation persisting for tip-sample separations of up to a few hundred nanometers. Height-dependent maxima are fitted to an exponential Ae^{-kd} with k=7.49±1.49 µm^-1 and A=4.07±0.56 MHz; a power-dependence measurement at 84 nm shows a 2.35x amplitude enhancement over the retracted tip. Hahn-echo measurements find no measurable T2 degradation. Micromagnetic LLG simulations reproduce the qualitative edge-localized in-phase/out-of-phase pattern and similar but somewhat smaller decay constants. The authors interpret the effect as flux channeling enabled by Re(μ)>1 below FMR and propose the geometry for nanoscale qubit addressing and microwave engineering.
Significance. Strengths of the work are the direct quantitative imaging with a scanning NV probe, the systematic height- and power-dependent measurements, the explicit caveat that the fitted decay constant is an effective wavenumber, and the admission that the simulations are only qualitative. If the magnetic mechanism were established, the paper would provide a clean demonstration of a passive strategy for localizing GHz magnetic fields to sub-300 nm scales without degrading T2, which is relevant to on-chip qubit control and microwave engineering. The measured 2.35x amplitude enhancement at 84 nm, the stability over a 20 dBm power range, and the T2 comparison are credible and well presented. The headline 16x power enhancement and the flux-channeling attribution, however, require additional support before the central claim can be accepted as stated.
major comments (3)
- [Abstract and Fig. 3(b)] The abstract's 'up to ~16x power enhancement' is not a directly measured quantity. The measured 2.35x Rabi-frequency amplitude enhancement at 84 nm corresponds to about 5.5x in power, and the 16x power figure is obtained by extrapolating the Ae^{-kd} fit (A=4.07±0.56 MHz, k=7.49±1.49 µm^-1) to d=0. The authors should state in the abstract and main text that the 16x value is an extrapolated projection, not a measured value, and should report the measured 84-nm value whenever the headline claim is made.
- [Figs. 2-4 and the 'Flux channeling' mechanism in the Introduction] The central mechanistic attribution of the observed modulation to magnetic flux channeling is not fully secured. The only evidence for Re(μ)>1 at 2.85 GHz is a predicted FMR frequency above 7 GHz from prior work (ref. 18); the experiment does not include a nonmagnetic metallic control, and the LLG simulations model magnetization dynamics but not eddy currents. Because permalloy is a conductor, conductive near-field scattering is, in principle, an alternative source of the edge contrast. A nonmagnetic control wire with the same dimensions and excitation geometry, or a corresponding simulation including the conductive response, would resolve this. If the 20 nm thickness makes eddy currents negligible, that argument should be made explicit with a skin-depth estimate.
- [Fig. 4(c) and the height-dependence analysis] The quantitative agreement between the simulated and measured decay constants is overstated. The experiment gives k=7.49±1.49 µm^-1, while the simulated slice fits range from 3.2 to 5.8 µm^-1 and the weighted average from Eq. (1) is 2.99 µm^-1. The upper end of the simulated range is only at the lower edge of the experimental 1-sigma window, and the weighted average lies outside it. Either provide a mechanism for the discrepancy (e.g., non-uniform antenna excitation, dead-layer offsets, or eddy-current contribution) or explicitly restrict the claim to qualitative agreement.
minor comments (7)
- [Abstract] The phrase '~100 mm wavelength microwaves' is technically the free-space wavelength at 2.85 GHz (~105 mm), but the juxtaposition with 'sub-300 nm-scale regions' may confuse readers; please clarify that the field modulation is what is localized, not the microwave source or wavelength.
- [Introduction] The word 'Moreoever' should be corrected to 'Moreover'.
- [Fig. 3(c)] The text says the Rabi frequency shows a linear dependence on the root power, but the figure axis and the exact quantity plotted (e.g., Rabi frequency versus square root of applied power in mW) should be stated explicitly.
- [Main text after Fig. 3(a)] The statement 'we found a 2.35-fold enhancement of the external microwave field amplitude' should specify the reference condition, including the NV-sample separation of the retracted-tip measurement, since the enhancement ratio is defined relative to that reference.
- [Fig. 3(b)] The exponential fit is shown, but the number of independent heights, the fit residuals, and the stated NV-sample separation baseline should be reported so the reader can judge the validity of the extrapolation to d=0.
- [Eq. (1)] Equation (1) defines a weighted average using spatial frequencies k_i, but the text does not explain how I(k_i) is obtained from the simulated stray-field maps; a brief explanation or a clearer pointer to the Supporting Information is needed.
- [Power-dependence section] The text associates a 2.35x amplitude enhancement with a '6-fold reduction' in power; since 2.35^2 is approximately 5.5, the quoted reduction factor should state ~5.5x or acknowledge the rounding.
Circularity Check
No significant circularity: the central Rabi-imaging measurement is self-contained, and the cited FMR and simulation support is not by-construction equivalent to the experimental data.
full rationale
The paper's empirical core is not derived from its own model. Rabi maps and line scans are measured directly with a scanning NV magnetometer, and the headline 2.35x enhancement is obtained by comparing the engaged tip with the retracted tip at identical applied powers, with a linear Rabi-frequency versus sqrt(power) relation shown in Fig. 3(c). That is an internal experimental baseline, not a fitted output. The exponential fit in Fig. 3(b) is explicitly labeled as a fit: 'Using an Ae−kd fit... k is merely an effective wavenumber - we are not resonantly exciting a specific mode nor do we expect this fit to be exact.' Its intercept is used only to extrapolate to smaller separations, not as evidence for the flux-channeling mechanism. The micromagnetic simulations are a post-hoc model of the same nanowire; the paper states only a qualitative match ('excellent qualitative match with our scans... despite some variations in the exact values') and does not use simulation outputs to construct the measured Rabi frequencies. The self-cited FMR estimate from ref. 18 is supporting context for why permalloy is expected to channel flux at 2.85 GHz, but the measured field modulation is an independent observation, and no equation in the paper defines the measured enhancement in terms of an assumed parameter. The authors also explicitly acknowledge the main competing loss (eddy currents) and note that they could not measure localized T1 times; these are stated limitations, not hidden circular derivations. No uniqueness theorem is imported from prior work, and no fitted parameter is renamed as a prediction. Therefore there is no circular step; concerns about mechanism attribution or extrapolation strength are correctness or support issues, not circularity.
Assumptions & free parameters
free parameters (2)
- A (Rabi frequency at sample surface) =
4.07 ± 0.56 MHz
- k (decay constant) =
7.49 ± 1.49 um^-1
assumptions (3)
- domain assumption NV Rabi frequency is proportional to the local microwave field amplitude (Omega_R = gamma_NV B_MW).
- domain assumption Permalloy relative permeability is above unity at 2.85 GHz because the FMR frequency is above 7 GHz.
- domain assumption A uniform excitation field is an adequate approximation of the antenna for qualitative simulation comparison.
Cite this review
Pith. "Pith review of Flux channeling induced nano-confinement and enhancement of microwaves imaged by Rabi oscillation mapping." pith.science (2026). https://pith.science/paper/QUDXC3BL
@misc{pith2026250109183,
  author       = {Pith},
  title        = {Pith review of: Flux channeling induced nano-confinement and enhancement of microwaves imaged by Rabi oscillation mapping},
  year         = {2026},
  howpublished = {\url{https://pith.science/paper/QUDXC3BL}},
  note         = {Machine review of arXiv:2501.09183}
}
abstract
With rapid advances in qubit technologies, techniques for localizing, modulating, and measuring RF fields and their impact on qubit performance are of the utmost importance. Here, we demonstrate that flux-channeling from a permalloy nanowire can be used to achieve localized spatial modulation of an RF field and that the modulated field can be mapped with high resolution using the Rabi oscillations of an NV center. Rabi maps reveal ~100 mm wavelength microwaves concentrated in sub-300 nm-scale regions with up to ~16$\times$ power enhancement. This modulation is robust over a 20 dBm power range and has no adverse impact on NV $T_2$ coherence time. Micromagnetic simulations confirm that the modulated field results from the nanowire's stray field through its constructive/destructive interference with the incident RF field. Our findings provide a new pathway for controlling qubits, amplifying RF signals, and mapping local fields in various on-chip RF technologies.
Figures


Figures from the paper (2 more)

Reference graph
Works this paper leans on
-
[1]
Andrich, P.; de las Casas, C. F.; Liu, X.; Bretscher, H. L.; Berman, J. R.; Heremans, F. J.; Nealey, P. F.; Awschalom, D. D. Long-range spin wave mediated control of defect qubits in nanodiamonds. npj Quantum Inf. 2017, 3, 28
work page 2017
-
[2]
J.; Wang, H.; Wu, M.; Wang, H.; Fullerton, E
Wang, X.; Xiao, Y.; Liu, C.; Lee-Wong, E.; McLaughlin, N. J.; Wang, H.; Wu, M.; Wang, H.; Fullerton, E. E.; Du, C. R. Electrical control of coherent spin rotation of a single-spin qubit. npj Quantum Inf. 2020 6:1 2020, 6, 1--6
work page 2020
-
[3]
Candido, D. R.; Fuchs, G. D.; Johnston-Halperin, E.; Flatté, M. E. Predicted strong coupling of solid-state spins via a single magnon mode. Mater. Quantum Technol. 2020, 1, 011001
work page 2020
-
[4]
Fukami, M.; Candido, D. R.; Awschalom, D. D.; Flatté, M. E. Opportunities for long-range magnon-mediated entanglement of spin qubits via on- and off-resonant coupling. PRX Quantum 2021, 2
work page 2021
-
[5]
Simon, B. G.; Kurdi, S.; Carmiggelt, J. J.; Borst, M.; Katan, A. J.; Van Der Sar, T. Filtering and Imaging of Frequency - Degenerate Spin Waves Using Nanopositioning of a Single - Spin Sensor . Nano Lett. 2022,
work page 2022
-
[6]
L.; Hoffman, S.; Maletinsky, P.; Yacoby, A.; Loss, D
Trifunovic, L.; Pedrocchi, F. L.; Hoffman, S.; Maletinsky, P.; Yacoby, A.; Loss, D. High-efficiency resonant amplification of weak magnetic fields for single spin magnetometry at room temperature. Nat. Nanotechnol. 2015, 10, 541--546
work page 2015
-
[7]
Wolf, M. S.; Badea, R.; Berezovsky, J. Fast nanoscale addressability of nitrogen-vacancy spins via coupling to a dynamic ferromagnetic vortex. Nat. Commun. 2016 7:1 2016, 7, 1--7
work page 2016
-
[8]
Stochastic Dynamics of a Ferromagnetic Vortex Revealed by Single - Spin Magnetometry
Badea, R.; Haber, E.; Berezovsky, J. Stochastic Dynamics of a Ferromagnetic Vortex Revealed by Single - Spin Magnetometry . Phys. Rev. Appl. 2018, 10, 064031
work page 2018
Show all 32 references
-
[9]
S.; Berezovsky, J
Badea, R.; Wolf, M. S.; Berezovsky, J. Coherent rotation of a single spin via adiabatic half passage in the presence of a ferromagnetic vortex. Quantum Sci. Technol. 2023, 8, 025008
2023
-
[10]
Toward T2 - Limited DC Diamond Quantum Magnetometry via Flux Concentration and Modulation
Xie, Y.; Xie, C.; Zhu, Y.; Jing, K.; Tong, Y.; Xi, Q.; Guan, H.; Duan, C.-K.; Wang, Y.; Rong, X. Toward T2 - Limited DC Diamond Quantum Magnetometry via Flux Concentration and Modulation . IEEE Sens. J. 2023, 23, 19211--19217, Conference Name: IEEE Sensors Journal
2023
-
[11]
Fescenko, I.; Jarmola, A.; Savukov, I.; Kehayias, P.; Smits, J.; Damron, J.; Ristoff, N.; Mosavian, N.; Acosta, V. M. Diamond magnetometer enhanced by ferrite flux concentrators. Phys. Rev. Res. 2020, 2, 023394, Publisher: American Physical Society
2020
-
[12]
J.; Jung, M.; Cheon, C
Yun, E. J.; Jung, M.; Cheon, C. I.; Nam, H. G. Microfabrication and Characteristics of Low - Power High - Performance Magnetic Thin - Film Transformers . IEEE Trans. Magn. 2004, 40, 65--70
2004
-
[13]
M.; Wang, S
El-Ghazaly, A.; White, R. M.; Wang, S. X. Gigahertz-band integrated magnetic inductors. IEEE Trans. Microw. Theory Tech. 2017, 65, 4893--4900
2017
-
[14]
S.; Van Haesendonck, C.; Moshchalkov, V
Kerner, C.; Magnus, W.; Golubović, D. S.; Van Haesendonck, C.; Moshchalkov, V. V. Micron-sized planar transformer for electromagnetic flux guidance and confinement. Appl. Phys. Lett. 2004, 85, 6013--6015
2004
-
[15]
Probing condensed matter physics with magnetometry based on nitrogen-vacancy centres in diamond
Casola, F.; van der Sar, T.; Yacoby, A. Probing condensed matter physics with magnetometry based on nitrogen-vacancy centres in diamond. Nat. Rev. Mater. 2018, 3, 17088, Publisher: Nature Publishing Group
2018
-
[16]
A.; Lillie, S
Broadway, D. A.; Lillie, S. E.; Scholten, S. C.; Rohner, D.; Dontschuk, N.; Maletinsky, P.; Tetienne, J. P.; Hollenberg, L. C. Improved current density and magnetization reconstruction through vector magnetic field measurements. Phys. Rev. Appl. 2020, 14, 024076
2020
-
[17]
Nanoscale microwave imaging with a single electron spin in diamond
Appel, P.; Ganzhorn, M.; Neu, E.; Maletinsky, P. Nanoscale microwave imaging with a single electron spin in diamond. New J. Phys. 2015, 17, 112001
2015
-
[18]
Off-resonant detection of domain wall oscillations using deterministically placed nanodiamonds
Rable, J.; Dwivedi, J.; Samarth, N. Off-resonant detection of domain wall oscillations using deterministically placed nanodiamonds. npj Spintronics 2023, 1, 1--7
2023
-
[19]
Tetienne, J.-P. et al. The nature of domain walls in ultrathin ferromagnets revealed by scanning nanomagnetometry. Nat. Commun. 2015, 6, 6733
2015
-
[20]
S.; Bhallamudi, V
Wolfe, C. S.; Bhallamudi, V. P.; Wang, H. L.; Du, C. H.; Manuilov, S.; Teeling-Smith, R. M.; Berger, A. J.; Adur, R.; Yang, F. Y.; Hammel, P. C. Off-resonant manipulation of spins in diamond via precessing magnetization of a proximal ferromagnet. Phys. Rev. B 2014, 89, 26--29,...
2014 arXiv
-
[21]
Nanometre-scale probing of spin waves using single-electron spins
van der Sar, T.; Casola, F.; Walsworth, R.; Yacoby, A. Nanometre-scale probing of spin waves using single-electron spins. Nat. Commun. 2015, 6, 7886, Publisher: Nature Publishing Group
2015
-
[22]
Du, C.; Sar, T. v. d.; Zhou, T. X.; Upadhyaya, P.; Casola, F.; Zhang, H.; Onbasli, M. C.; Ross, C. A.; Walsworth, R. L.; Tserkovnyak, Y.; Yacoby, A. Control and local measurement of the spin chemical potential in a magnetic insulator. Science 2017, 357, 195--198
2017
-
[23]
Q.; McLaughlin, N.; Yamamoto, T.; Li, S.; Nozaki, T.; Yuasa, S.; Du, C
Yan, G. Q.; McLaughlin, N.; Yamamoto, T.; Li, S.; Nozaki, T.; Yuasa, S.; Du, C. R.; Wang, H. Coherent Driving of a Single Nitrogen Vacancy Center by a Resonant Magnetic Tunnel Junction . Nano Lett. 2024, 24, 14273--14278, Publisher: American Chemical Society
2024
-
[24]
Hahn, E. L. Spin Echoes . Phys. Rev. 1950, 80, 580
1950
-
[25]
Hanson, R.; Gywat, O.; Awschalom, D. D. Room-temperature manipulation and decoherence of a single spin in diamond. Phys. Rev. B 2006, 74, 161203
2006
-
[26]
Nature 1948, 161, 554--554, Publisher: Nature Publishing Group
‘ Supermalloy ' : a New Magnetic Alloy . Nature 1948, 161, 554--554, Publisher: Nature Publishing Group
1948
-
[27]
McLyman, C. W. T.; Wagner, A. P. Designing high frequency AC inductors using ferrite and molypermalloy powder cores ( MPP ). 1985 IEEE Power Electronics Specialists Conference ( ESA SP -230). 1985; pp 171--175, ISSN: 0379-6566
1985
-
[28]
Local Ferromagnetic Resonance Measurements of Mesoscopically Patterned Ferromagnets Using Deterministically Placed Nanodiamonds
Rable, J.; Piazza, B.; Dwivedi, J.; Samarth, N. Local Ferromagnetic Resonance Measurements of Mesoscopically Patterned Ferromagnets Using Deterministically Placed Nanodiamonds . Phys. Rev. Appl. 2022, 18, 064004, Publisher: American Physical Society
2022
-
[29]
M.; Wang, S
El-Ghazaly, A.; White, R. M.; Wang, S. X. Increasing ferromagnetic resonance frequency using lamination and shape. J. Appl. Phys. 2015, 117, 17E502
2015
-
[30]
R.; Stanwix, P
Maze, J. R.; Stanwix, P. L.; Hodges, J. S.; Hong, S.; Taylor, J. M.; Cappellaro, P.; Jiang, L.; Dutt, M. V.; Togan, E.; Zibrov, A. S.; Yacoby, A.; Walsworth, R. L.; Lukin, M. D. Nanoscale magnetic sensing with an individual electronic spin in diamond. Nature 2008 455:7213 2008...
2008
-
[31]
T.; He, Z.; Liu, L
Hu, Z.; Wang, Q.; Chou, C.-T.; Hou, J. T.; He, Z.; Liu, L. Nonlinear wave-spin interactions in nitrogen-vacancy centers. Phys. Rev. Applied 2024, 21, 044057
2024
-
[32]
"" ؼ^ Ѕn < z? 8l BDDD @g2V ݕ5k H
Karlson, S. J.; Kehayias, P.; Schloss, J. M.; Maccabe, A. C.; Phillips, D. F.; Wang, G.; Cappellaro, P.; Braje, D. A. Quantum Frequency Mixing using an NV Diamond Microscope . 2024; http://arxiv.org/abs/2407.07025 mcitethebibliography achemso-demo.tex00006640000000000000000000...
2024 arXiv
Reviewed August 10, 2026 · model on record in the stance chip above.
Discussion (0). Continue with ORCID to comment.