REVIEW 5 major objections 5 minor 24 references
On the Relation between Optical Aperture and Automotive Object Detection
T0 review · 5 major / 5 minor · reviewed 2026-08-10 · deepseek-v4-flash
Pith's one-line read The paper argues that aperture shape and f-number from f/1.8 to f/3.4 make no statistically significant difference to YOLOv8 detection precision on simulated automotive signs and lights.
desk verdict A solid, rebuildable simulation study with a practical null result, but the 'no difference' claim outruns the statistics and the lack of real-camera validation. read the letter →
The pith
A machine-rendered reading of the paper's core claim, the machinery that carries it, and where it could break.
The reading
What carries the argument
The load-bearing object is the PSF-emulation pipeline. For each color channel and each of 19 distance bins from 10 to 100 meters, ray tracing produces a spatially varying PSF kernel over a 51x51 block grid; the pipeline masks a synthetic pinhole image by its per-pixel depth map, convolves each depth slice with the corresponding kernel, reconstructs the full image, then adds zero-mean white Gaussian noise whose standard deviation is interpolated from a measured camera-noise-versus-gain curve. This machinery converts 41,000 synthetic images into 16 replicas—four apertures times four gain levels—isolating aperture effects from noise effects.
What would settle it
Capture the same scene with four cameras identical except for circular, plus, vertical-slit, and horizontal-slit apertures at the matching f-numbers and gains, then run the same YOLOv8 evaluation; if real-image mAP differences exceed the paper's 5-fold error bars, the simulated null result would be a simulation artifact rather than a physical property.
Extended reading notes
Core claim
On its own terms, the paper establishes that for YOLOv8-based detection of European-format traffic signs, speed signs, and traffic lights, neither aperture shape nor moderate aperture size changes mean average precision (mAP). Two-sample t-tests for unequal variances on 5-fold cross-validation show no aperture pair reaching $p<0.05$ for tiny and small bounding boxes, and the paper's stated conclusion extends the null result across f/1.8 to f/3.4. A plus-shaped aperture with higher modulation transfer function (MTF) than the circular reference does not translate into higher mAP, so optical sharpness and learned detection performance decouple in this regime. Added noise from gain compensation is tolerated up to 40 dB; at 48 dB every aperture loses precision significantly.
Load-bearing premise
The argument stands on the assumption that ray-traced PSF kernels plus the fitted additive-noise model reproduce what a real automotive camera behind a windshield actually does, and the paper includes no real-image validation of that equivalence.
Editorial extensions
If this is right
- A camera designer can move from f/1.8 to f/3.4 circular optics, or to plus or slit shapes, without expecting a statistically meaningful change in detection mAP for these object classes.
- The superior MTF of a non-circular aperture is not itself a reason to adopt it; detector precision does not follow optical sharpness in the tested range.
- Detection precision is effectively flat from 0 to 40 dB of camera gain, and drops only when gain reaches 48 dB.
- The depth-aware PSF filtering pipeline can make synthetic training images optically realistic enough to run comparative aperture studies without building multiple physical camera rigs.
Reading between the lines
- Beyond the paper's claims, if the simulation-to-real gap is small, the cost argument is real: higher-f-number lenses with smaller diameters could cut optics cost, but the paper's own spot-size scaling warns that beyond f/3.4 smaller pixels become diffraction-limited, so the savings may not extend to high-resolution sensors.
- Beyond the paper's claims, the null result is conditional on the 10-to-100-meter range and these three object classes; far-field tiny objects, low-contrast scenes, or detectors with different inductive biases could expose aperture effects the current test cannot resolve.
- A direct real-image validation—mounting cameras with each aperture behind a windshield on the same routes and comparing real mAP against the simulated replicas—would settle whether the null effect is real or an artifact of the PSF and noise model.
- A natural next experiment is to vary f-number continuously beyond f/3.4 and to include defocus from windshield curvature, since the simulation includes lateral color and windshield refraction but restricts depth to discrete bins.
Signed reviews
Editorial analysis
A structured set of objections, weighed in public.
Referee Report
Summary. The paper studies how aperture size and shape of an automotive camera affect deep-learning object detection (traffic signs, speed signs, traffic lights). Synthetic 'pinhole' images are convolved with Zemax ray-traced PSF kernels at 19 depth ranges, gain-dependent AWGN is added using a measured camera noise curve, and YOLOv8n detectors are trained and evaluated per aperture and gain level. Four apertures are compared (circular f/1.8, plus f/2.4, horizontal and vertical slit f/3.4) at four gain levels (0, 30, 40, 48 dB) with 5-fold cross-validation. The authors conclude that there is no statistically significant difference in detection precision among aperture shapes and across f/1.8 to f/3.4, and they suggest a possible cost saving from smaller diameter optics.
Significance. The paper addresses a question of practical relevance to automotive camera design: whether moderate increases in f-number or non-circular aperture shapes degrade downstream object detection. The pipeline is a methodological contribution: it converts abstract optical simulations into a large, annotated, depth-aware synthetic dataset with realistic PSF effects, and the comparative setup across 80 trained networks is a substantial computational effort. The main claim, if rigorously supported, could inform cost-driven lens specifications. However, the statistical evidence for the null result is currently weak, and the simulation lacks real-image validation, so the strength of the claim exceeds what the presented analysis can support.
major comments (5)
- [Section III-A, Eq. (9) and Eq. (11)] The alternative hypothesis in Eq. (9), H_a: \bar\mu_1,i \neq \bar\mu_2,i \neq \bar\mu_3,i \neq \bar\mu_4,i, is not the logical negation of the null hypothesis in Eq. (8), which states all four means are equal. The correct alternative is 'at least one pair of means differs.' Moreover, the pairwise Welch's t-test in Eq. (12) tests only one pair of apertures, so the hypotheses as written do not correspond to the tests actually performed. The same issue applies to the gain hypotheses in Eqs. (10)-(11). This is a formal error that should be corrected because the entire statistical analysis is founded on the statement of these hypotheses.
- [Section III-A, Tables III-VII] The inference 'no statistically significant difference' is based on failure to reject in Welch's t-tests with n=5 fold means. These five means are not independent samples: each fold's training set shares 80% of its images with every other fold, and all folds use images from the same synthetic source. Treating them as independent samples in an unpaired t-test inflates the effective degrees of freedom and can distort p-values. A paired analysis across folds, or a mixed-effects model with fold as a random effect, is more appropriate. More critically, a non-significant p-value does not establish equivalence; with only five folds and the large fold-to-fold variance visible for tiny and small bounding boxes in Figures 15-16, the tests are underpowered for the small mAP differences that matter. The authors should report effect sizes and confidence intervals, and should consider a formal equivalence test (e.g., two one-sided tests, TOST) with a pre-specified margin. As written, the central conclusion in Section IV that 'no significant difference' exists is not supported by the statistics.
- [Section II-B and II-C, Simulation Validation] The load-bearing premise of the paper is that the simulated PSF kernels and the AWGN model faithfully represent real camera behavior. The PSF kernels come from Zemax for a specific 16mm lens and a specific windshield model, and the noise is fit to dark-frame measurements of one camera (DFK37BUX252). No comparison is made to real images captured with these apertures, nor to images from another camera model. The noise model is also additive white Gaussian noise only, ignoring shot noise and spatial non-uniformities that are present in real automotive cameras. Therefore, the null result could be a property of the simulator rather than a property of physical imaging systems. I recommend either adding a real-image validation experiment (even a limited one, e.g., with one aperture pair and a static scene) or substantially tempering the conclusions to explicitly state that the findings hold only for the simulated model and list the conditions under which they might transfer.
- [Section III, Eq. (5)] The metric mAP is defined in Eq. (5) as the mean over classes of |TP_c| / (|TP_c| + |FP_c|), which is average precision at a single confidence score threshold, not mean average precision (the area under the precision-recall curve). This is inconsistent with the statement that cocoeval.py was used to compute the reported values, as cocoeval computes AP as an integral over recall levels. If the paper reports COCO mAP, Eq. (5) should be replaced by the standard definition; if Eq. (5) is what was actually computed, then the results are not comparable to COCO mAP and the authors should rename the metric. The metric definition is central because every result in the paper is expressed in these units.
- [Section III-A, Hypothesis Testing Procedure] The paper states that 384 pairwise tests are required for the aperture comparisons and 'a similar amount' for the gain comparisons, but then reports only selected examples (Tables III-VII) and draws the general conclusion that 'the null hypothesis cannot be rejected for any of the cases.' This makes the global claim unverifiable from the text. Additionally, no correction for multiple comparisons is applied despite the large number of tests. I recommend reporting the full set of test results (e.g., in a supplementary table) and applying or justifying a multiple-comparison correction, or limiting the conclusions to the reported bbox classes and gain levels.
minor comments (5)
- [Tables VI and VII] The captions of Tables VI and VII say 'APERTURE SIGNIFICANCE' but the columns compare gain levels for a fixed aperture; they should read 'GAIN SIGNIFICANCE'.
- [Section III-A, 'selected test examples'] The phrase 'For brevity, we will only present selected test examples' is acceptable, but the paper should indicate which of the 384 tests are shown and whether the omitted tests are consistent with the reported ones.
- [Eq. (5) and text] The notation |classes| is used but classes are not defined in a set; consider using |C| with C as the set of classes.
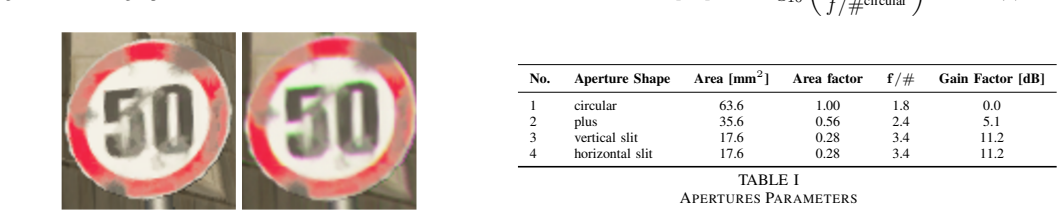
- [Section II-C, Table I] The gain factor in dB is computed for an ideal aperture-area ratio, but the authors do not discuss that real lens transmittance and vignetting may make the effective f-number different; this could be a caveat in interpreting the aperture comparison.
- [Section II-E, Fig. 14] The class distribution histogram would benefit from labels on the axes and a legend describing the class groups, as the current text references ranges of class indices that are hard to read from the figure.
Circularity Check
No significant circularity: the null aperture-effect result is measured from simulated images, not derived from the aperture parameters by construction.
full rationale
The paper's central claim is an empirical null result obtained from YOLOv8 mAP measurements on images filtered with Zemax ray-traced PSFs and camera-measured additive noise. The aperture parameters in Table I and Equations (3)-(4) are used only to set the f-number and gain/noise levels for the simulated conditions; they do not enter the mAP computation or the statistical comparison. Equation (5) is a measured precision metric, and the Welch t-tests in Section III-A compare observed fold-wise mAP values. The PSFs come from Zemax ray tracing, the noise standard deviations come from measured frames of the DFK37BUX252 camera, and the detection outcomes are obtained by training and testing YOLOv8, so no prediction is fitted to the data it is claimed to predict. There are no load-bearing self-citations or imported uniqueness theorems; prior-work references serve as background. Concerns about underpowered or non-independent t-tests and lack of real-camera validation are validity and generality risks, not circular derivation.
Assumptions & free parameters
free parameters (2)
- Noise STD exponential fit coefficients (red, green, blue) =
y = 10^(0.060427 x - 1.9287); 10^(0.061272 x - 2.0334); 10^(0.059352 x - 1.8878)
- Distance-to-bbox power-law fit coefficients =
traffic light: 1422.985 x^-0.99525; speed sign: 923.0477 x^-0.98768; traffic sign: 2895.0974 x^-0.99486
assumptions (4)
- domain assumption Zemax ray-tracing PSF simulations at 19 discrete distances faithfully represent the optical behavior of the automotive camera with windshield.
- domain assumption Per-pixel depth maps from the Cognata synthetic scenes are accurate and sufficient for depth-sliced PSF filtering.
- domain assumption The sensor noise after gain compensation is adequately modeled as zero-mean additive white Gaussian noise with STD from the measured exponential fit.
- domain assumption Rejecting the null hypothesis of equal mAP across apertures based on Welch's t-test on K=5 fold means is a valid equivalence test.
Cite this review
Pith. "Pith review of On the Relation between Optical Aperture and Automotive Object Detection." pith.science (2026). https://pith.science/paper/SQ6XTLBM
@misc{pith2026250109456,
  author       = {Pith},
  title        = {Pith review of: On the Relation between Optical Aperture and Automotive Object Detection},
  year         = {2026},
  howpublished = {\url{https://pith.science/paper/SQ6XTLBM}},
  note         = {Machine review of arXiv:2501.09456}
}
read the original abstract
We explore the impact of aperture size and shape on automotive camera systems for deep-learning-based tasks like traffic sign recognition and light state detection. A method is proposed to simulate optical effects using the point spread function (PSF), enhancing realism and reducing the domain gap between synthetic and real-world images. Computer-generated scenes are refined with this technique to model optical distortions and improve simulation accuracy.
Figures


Figures from the paper (14 more)




Reference graph
Works this paper leans on
-
[1]
A. El Gamal and H. Eltoukhy, “CMOS Image Sensors,” IEEE Circuits & Devices, Magazine May/June 2005, pp. 6–20
work page 2005
-
[2]
O. Yadid-Pecht and R. Etienne-Cummings (Eds.), CMOS Imagers: From Phototransduction to Image Processing , Kluwer Academic Publishers, 2004
work page 2004
-
[3]
Why do animal eyes have pupils of different shapes?
M. S. Banks, W. W. Sprague, J. Schmoll, J. A. Q. Parnell and G. D. Love, “Why do animal eyes have pupils of different shapes?” Science Advance, Aug 7, 2015;1(7):e1500391. doi: [online:] https://www.science.org/doi/ 10.1126/sciadv.1500391. PMID: 26601232; PMCID: PMC4643806
-
[4]
You Only Look Once: Unified, Real-Time Object Detection
J. Redmon, S. Divvala, R. Girshick, A. Farhadi, “You Only Look Once: Unified, Real-Time Object Detection” [online:] https://arxiv.org/abs/ 1506.02640
-
[5]
[online:] https://docs.ultralytics.com/models/yolov8/
-
[6]
[online:] http://bdd-data.berkeley.edu/
-
[7]
[online:] https://www.cvlibs.net/datasets/kitti/
-
[8]
[online:] https://www.cognata.com/traffic-sign-datasets/
Show all 24 references
-
[9]
[online:] https://www.cognata.com/traffic-lights/
-
[10]
Microsoft COCO: Common Objects in Context,
T.-Y . Lin, M. Maire, S. Belongie, L. Bourdev, R. Girshic, J. Hays, P. Perona, D. Ramanan, C. L. Zitnick and P. Dollár, “Microsoft COCO: Common Objects in Context,” [online] https://arxiv.org/pdf/1405.0312
-
[11]
theimagingsource.com/en-us/product/industrial/37u/dfk37bux252/ IEEE TRANSACTIONS ON INTELLIGENT VEHICLES, VOL
DFK 37BUX252 Technical Reference Manual , [online:] https://www. theimagingsource.com/en-us/product/industrial/37u/dfk37bux252/ IEEE TRANSACTIONS ON INTELLIGENT VEHICLES, VOL. XX, NO. YY , MONTH 2025 10
2025
-
[12]
Supplementary Information Differentiable Compound Optics and Processing Pipeline Optimization for End-to-end Camera Design,
E. Tseng, A. Mosleh, F. Mannan, K. St-Arnaud, A. Sharma, And Y . Peng, A. Braun, D. Nowrouzezahrai, J.-F. Lalonde And F. Heide, “Supplementary Information Differentiable Compound Optics and Processing Pipeline Optimization for End-to-end Camera Design,” ACM Transactions on Gra...
2021
-
[13]
Hardware-in-the-Loop End-to-End Optimization of Camera Image Processing Pipelines,
A. Mosleh, A. Sharma, E. Onzon, F. Mannan, N. Robidoux and F. Heide, “Hardware-in-the-Loop End-to-End Optimization of Camera Image Processing Pipelines,” 2020 IEEE/CVF Conference on Computer Vision and Pattern Recognition (CVPR) , Seattle, W A, USA, 2020, pp. 7526-7535, [onlin...
2020
-
[14]
The Differentiable Lens: Compound Lens Search over Glass Surfaces and Materials for Object Detection,
G. Côté, F. Mannan, S. Thibault, J.-F. Lalonde and F. Heide, “The Differentiable Lens: Compound Lens Search over Glass Surfaces and Materials for Object Detection,” Proc. of the IEEE/CVF Conference on Computer Vision and Pattern Recognition (CVPR) , June 18th-22nd, 2023
2023
-
[15]
PSF modeling with deep learning for the Argus Optical Array,
J. Carney, H. Corbett, W. Marshall, N. Law, S. Fitton, R. Gonzalez, L. Machia, T. Proctor, and A. Vasquez, “PSF modeling with deep learning for the Argus Optical Array,” Proc. SPIE 13101, Software and Cyberinfrastructure for Astronomy VIII , 131010O (26 July 2024); [online:] h...
2024 doi
-
[16]
Deep Optics for Monocular Depth Estima- tion and 3D Object Detection,
J. Chang and G. Wetzstein, “Deep Optics for Monocular Depth Estima- tion and 3D Object Detection,” [online:] https://arxiv.org/abs/1904.08601
1904 arXiv
-
[17]
Fast point spread function modeling with deep learning,
J. Herbel, T. Kacprzak,a A. Amara A. Refregiera and A. Lucchib, “Fast point spread function modeling with deep learning,” Journal of Cosmology and Astroparticle Physics An IOP and SISSA journal, V ol. 54, July 2018, [online:] https://doi.org/10.1088/1475-7516/2018/07/054
2018 doi
-
[18]
Sensitivity analysis of AI-based algorithms for autonomous driving on optical wavefront aberrations induced by the windshield,
D. W. Wolf, M. Ulrich and N. Kapoor, “Sensitivity analysis of AI-based algorithms for autonomous driving on optical wavefront aberrations induced by the windshield,” 2023 IEEE/CVF International Conference on Computer Vision Workshops (ICCVW), Paris, France, 2023, pp. 4102-4111...
2023 arXiv
-
[19]
Refaeilzadeh, L
P. Refaeilzadeh, L. Tang, H. Liu, (2009). Cross-Validation. In: L. LIU , M.T. Özsu, (eds) Encyclopedia of Database Systems. Springer, Boston, MA. https://doi.org/10.1007/978-0-387-39940-9_565
2009 doi
-
[20]
J. W. Goodman, Introduction to Fourier Optics, 3rd ed., Roberts & Company Publishers, 2005
2005
-
[21]
NIST Handbook 148: DATAPLOT Reference Manual, V olume I: Commands,
N. A. Heckert and James J. Filliben “NIST Handbook 148: DATAPLOT Reference Manual, V olume I: Commands,” National Institute of Standards and Technology Handbook Series , June 2003. [online:] https: //www.itl.nist.gov/div898/software/dataplot/refman2/ch2/weightsd.pdf
2003
-
[22]
R. J. Larsen and M. L. Marx, An Introduction to Mathematical Statistics and Its Applications, Pearson-Prentice Hall Upper Saddle River, New Jersey, 07458, 4th Ed. 2006
2006
-
[23]
Why Welch’s test is Type I error robust,
B. Derrick and P. White, “Why Welch’s test is Type I error robust,” The Quantitative Methods for Psychology , vol. 12, no. 1, pp. 30–38, 2016 [online:] http://www.tqmp.org/RegularArticles/vol12-1/p030/p030.pdf
2016
-
[24]
Szeliski, Computer Vision Algorithms and Applications, Springer- Verlag London, 2011
R. Szeliski, Computer Vision Algorithms and Applications, Springer- Verlag London, 2011. Ofer Bar-Shalom received the B.Sc. degree in me- chanical engineering and the M.Sc. and Ph.D. degrees in electrical engineering from Tel-Aviv University, Tel Aviv, Israel, in 1997, 2001, a...
2011
Reviewed August 10, 2026 · model on record in the stance chip above.
Discussion (0). Continue with ORCID to comment.