REVIEW 1 major objections 5 minor 4 cited by
A MARVEL-ous study of how well galaxy shapes reflect Dark Matter halo shapes in Cold Dark Matter Simulations
T0 review · 1 major / 5 minor · reviewed 2026-08-10 · deepseek-v4-flash
Pith's one-line read In diskless dwarf galaxies, the stellar distribution mirrors the dark matter halo's 3D shape, making stellar shapes a practical proxy for halo shapes and a route to testing dark matter models.
desk verdict A solid, careful simulation study showing nondisky dwarf stellar shapes track DM halo shapes across 1e6-1e10 Msun; side claims on mergers and feedback are softer than the abstract implies. read the letter →
The pith
A machine-rendered reading of the paper's core claim, the machinery that carries it, and where it could break.
The reading
What carries the argument
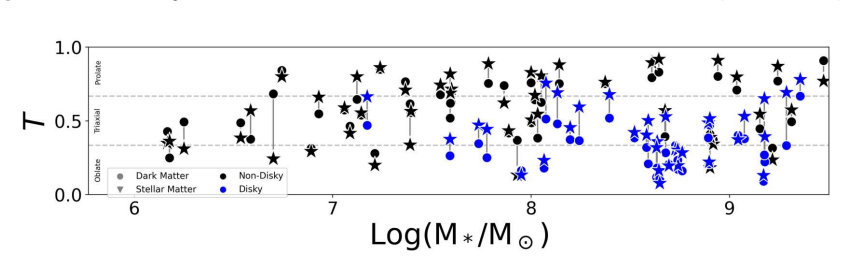
The load-bearing object is the shape tensor $S_{ij} = (1/M)\sum_k m_k r_{k,i} r_{k,j}$ — the moment-of-inertia tensor of particle positions — evaluated in iteratively fitted ellipsoidal shells whose eigenvalues give the principal axes $A \geq B \geq C$ and hence the axis ratios $Q = B/A$ and $S = C/A$. After smoothing the axis-ratio profiles $Q(r)$ and $S(r)$ with 3rd- to 5th-order polynomials, the shapes are read off at twice the effective radius ($2 R_{\rm eff}$), the radius where self-interacting-dark-matter sphericalization would be detectable. Adaptive radial binning with a floor of 5000 star particles sets the resolution limits, and the triaxiality parameter $T = (1-Q^2)/(1-S^2)$ places each galaxy between oblate ($T < 1/3$), triaxial ($1/3 < T < 2/3$), and prolate ($T > 2/3$). The disk classification — thin ($S_* < 0.4$) and circular ($Q_* > 0.65$) — separates the cleanly dark-matter-tracing population from the disk-dominated one.
What would settle it
Recompute the shapes of the same simulated galaxies with a different measurement pipeline — for instance the standard (non-reduced) inertia tensor, a different radial binning scheme, or much stricter per-bin particle thresholds — and repeat the Kolmogorov–Smirnov tests: if the $Q$ distributions of nondisky stars and dark matter are no longer statistically indistinguishable (p=0.49) and the per-galaxy $S_{\rm DM}/S_*$ ratios drift away from unity, the claimed correspondence is a product of the fitting procedure rather than the physics. An observational check would be deep imaging of a few dozen field dwarfs below $10^{7.5}\,M_\odot$ whose deprojected stellar shapes come out systematically rounder or more oblate than the prolate, triaxial halo shapes the simulations predict.
Extended reading notes
Core claim
The paper claims that stellar shape follows dark matter halo shape across its 80 simulated dwarf galaxies. The correspondence is strongest where baryons are dynamically subdominant: in nondisky galaxies, which dominate below stellar mass about $10^{7.5}\,M_\odot$, a two-sample Kolmogorov–Smirnov test finds the stellar and dark-matter distributions of the intermediate-to-major axis ratio $Q$ statistically indistinguishable (p=0.49) and the minor-to-major ratio $S$ only modestly different (p=0.015), with per-galaxy $S_{\rm DM}/S_*$ ratios near unity. Stellar triaxiality tracks halo triaxiality with slope $0.99\pm0.08$ ($R^2=0.77$) in nondisky galaxies, while disky galaxies deviate from the one-to-one relation because the disk makes stars flatter ($S_{\rm DM}/S_*$ averages $2.92\pm0.60$). The authors further argue that disk formation above about $10^{7.5}\,M_\odot$ starts to round and flatten the dark matter itself, that stellar and dark-matter axes are strongly aligned (most clearly for the minor axis in disky systems), that swapping between two supernova feedback implementations leaves both shapes unchanged, and that recent mergers with ratios above about 4 move the axis ratios by no more than about 0.05. The paper concludes that stellar shape measurements are a reliable tool for inferring dark matter halo shapes in dwarf galaxies.
Load-bearing premise
The whole stellar–DM comparison rests on the assumption that the iterative shape-tensor fitting, with its chosen radial bins, particle-count floors, and polynomial smoothing, recovers the true 3D shapes of stars and dark matter equally well at twice the effective radius; if the measurement pipeline biases the two components differently, the apparent shape correspondence could be partly artificial.
Editorial extensions
If this is right
- Observed stellar shapes in nondisky dwarf galaxies below about $10^{7.5}\,M_\odot$ can be read directly as dark matter halo shapes, giving observers a handle on halo shape without kinematics or lensing.
- Measuring stellar triaxiality in a sample of diskless dwarfs can discriminate between the prolate halos that cold dark matter produces and the rounder halos that self-interacting dark matter predicts.
- The stellar disk is the main thing that breaks the stellar–DM correspondence: above $10^{7.5}\,M_\odot$ the disk makes stars much flatter than the halo, so dark-matter inference should be restricted to diskless galaxies.
- Shape measurements appear insensitive to the supernova feedback implementation, so dwarf-galaxy shapes do not encode subgrid baryonic physics and results from different simulation suites can be combined.
- Recent mergers with ratios above 4 change both stellar and dark-matter axis ratios by less than about 0.05, so merger activity does not need to be accounted for when interpreting dwarf galaxy shapes.
Reading between the lines
- If stellar shape is a faithful halo-shape tracer, then the sphericalization that self-interacting dark matter produces in inner halos should appear as a measurable roundness trend in the stellar axis-ratio profiles $Q(r)$ and $S(r)$ of low-mass diskless dwarfs toward the center — a test the paper gestures at but does not run.
- The $10^{7.5}\,M_\odot$ disk-formation threshold suggests a practical survey design rule: shape-based dark-matter probes should be restricted to diskless dwarfs below this mass, while shape distributions of higher-mass dwarfs should be treated as baryon-contaminated.
- The proxy claim could be stress-tested by forward-modeling the observational pipeline — projecting the simulated galaxies to 2D, measuring ellipticities as a survey would, and applying standard deprojection techniques — to verify that the stellar–DM shape correlation survives the inference process before trusting it on real data.
- If the proxy holds, the population distribution of dwarf galaxy shapes becomes a dark-matter-model diagnostic: the fractions of prolate, triaxial, and oblate field dwarfs are set by structure formation in CDM and would be shifted by dark-matter self-interactions, so shape surveys could constrain the self-interaction cross section.
Signed reviews
Editorial analysis
A structured set of objections, weighed in public.
Referee Report
Summary. The paper measures intrinsic 3D shapes of the stellar and dark-matter components in 80 simulated dwarf galaxies from the Marvel, DC Justice League, and Massive Dwarfs zoom-in suites, spanning stellar masses of about 1e6 to 1e10 Msun. Shapes are derived from iterative inertia-tensor fits in radial shells, evaluated at twice the effective radius (2 Reff), and summarized by axis ratios Q=B/A and S=C/A and by triaxiality. The central claim is that, for galaxies without a stellar disk, the stellar distribution closely tracks the dark-matter halo shape, so stellar shapes can serve as a proxy for DM shapes in low-mass dwarfs; the paper also reports that disks produce measurable stellar-DM shape differences, that triaxiality tracks between the two components, that axes are generally aligned, that two supernova feedback implementations give similar shapes, and that recent mergers with ratios greater than about 4 do not strongly perturb the measured shapes. The results are validated against observed dwarf shapes from Kado-Fong et al. (2020).
Significance. If the central claim is correct, the paper provides a practical route to infer DM halo shapes from stellar photometry in dwarf galaxies, which would be valuable for discriminating CDM from SIDM and for understanding baryonic effects on halo structure. The study has notable strengths: it uses multiple simulation suites with different resolutions and feedback models, it reports per-galaxy comparisons as well as ensemble KS tests, it includes an observational validation, and it states that the analysis code and figure data will be publicly available. The main caveat, discussed below, is whether the shape measurement at 2 Reff for the lowest-mass nondisky galaxies is well defined in regions that may have near-constant DM density; if that concern is not resolved, the inferred stellar-DM shape agreement could be partly an artifact of the measurement pipeline.
major comments (1)
- [Section 2.3 / Section 3.2] The load-bearing claim that stellar shapes trace DM shapes in nondisky dwarfs depends on shape measurements at 2 Reff, but the paper does not measure the local DM density slope or core radius at 2 Reff for the low-mass sample. Section 2.3 asserts that 2 Reff is 'a higher radius than a typical DM core' and cites Read et al. (2016) and Fitts et al. (2017, 2019), yet no density profile or core radius measurement is presented. For the lowest-mass galaxies (M* ~ 1e6 Msun, where Section 3.3 reports 2 Reff values as small as 0.6 kpc), feedback-generated cores on the order of 0.5-1 kpc would place 2 Reff inside a near-constant-density region. In such a region the iterative ellipsoid fit is ill-conditioned, and the recovered axis ratios for both stars and DM may be dominated by Poisson noise and smoothing rather than by physical shape, biasing the two components toward spurious agreement. Figure 16, which shows shapes becoming rounder toward the center, is consistent with this concern. The authors should report d log rho_DM/d log r at 2 Reff (or equivalently, core radii) for the nondisky sample and demonstrate that the KS result (p=0.49 for Q) and the near-unity SDM/S* ratios at low masses are not driven by galaxies with flat central density slopes, for example by repeating the analysis after excluding systems with slope near zero at 2 Reff.
minor comments (5)
- [Section 3.5 / Abstract] The conclusion that mergers with ratios greater than about 4 do not perturb galaxy shapes is based on two merger events with ratios 4.4 and 5.6, as the text acknowledges. The abstract and conclusions state this as a general result ('a dwarf galaxy's shape is largely unperturbed by recent mergers (with merger ratios >4)'); this should be rephrased to indicate the small number of events and the limited range of merger ratios probed.
- [Section 4.2 / Abstract] The claim that shape measurements are 'robust to different implementations of baryonic feedback' rests on a comparison of eight galaxies in one simulation volume. The authors note the small sample in Section 4.2, but the abstract and summary conclusion do not carry this caveat; the wording should be softened to reflect the limited statistical power.
- [Appendix D] In the final paragraph of Appendix D, the text says 'Q = B/A and S = B/A values closer to one'; the second expression should be S = C/A.
- [Section 3.2 / Figure 4] The slopes quoted for QDM/Q* and SDM/S* versus stellar mass do not include a discussion of whether the individual galaxy ratios are consistent with unity within the estimated measurement uncertainties. Adding representative error bars or a statement about typical per-galaxy uncertainties would make the low-mass 'near-unity' claim easier to evaluate.
- [Section 3.4] The statement that '82% of our sample is aligned according to our expectations from shapes' uses shape categories that are derived from the same axis-ratio measurements used to define the expected alignment patterns, so this is a consistency check rather than an independent confirmation; the wording should make that explicit.
Circularity Check
No significant circularity: stellar and DM axis ratios are independently measured from the simulations and compared, with no fitted target, self-citation chain, or definitional equivalence.
full rationale
Score 0. The paper's central claim is an empirical comparison of two independently measured shape distributions in the same simulated galaxies, not a derived quantity that reduces to its inputs. Section 2.3 defines the reduced inertia tensor (Eq. 2) and applies the same iterative ellipsoid-fitting algorithm to DM and stellar particles; axis ratios Q and S are then read off at 2Reff for each component separately. Section 3.2 compares these measurements with KS tests (p=0.49 for Q, p=0.015 for S in nondisky galaxies) and per-galaxy ratios QDM/Q* and SDM/S*. None of these ratios is a fitted parameter, and no stellar value is constructed from DM values or vice versa. The disky/nondisky split uses stellar shape thresholds (S*<0.4, Q*>0.65) with robustness margins and kinematic checks, and the DM shapes are not used in the classification, so the comparison is not circular by selection. Self-citations to Munshi et al. (2019, 2021), Bellovary et al. (2019), Keller et al. (2014), and Tremmel et al. (2017) describe the simulation codes and subgrid models, i.e., the inputs, and do not carry the conclusion; the observational validation against Kado-Fong et al. (2020) is an external benchmark. The Fischer and Valenzuela (2023) caveat about ill-defined shapes in constant-density cores is explicitly acknowledged in Section 2.3, but it is a measurement-validity concern, not a circular one: even if 2Reff lay inside a core for the lowest-mass galaxies, the resulting noise-dominated agreement would be a common-cause artifact rather than an equation-level equivalence. No uniqueness theorem, ansatz-smuggling citation, or redefinition of a known result is present. The paper is self-contained: all central comparisons are direct measurements from the simulations with stated convergence and resolution criteria.
Assumptions & free parameters
free parameters (7)
- Disk classification thresholds =
S* < 0.4 and Q* > 0.65 at 2 Reff
- Minimum star particle count =
5000
- Radial binning constants (modified Zemp) =
1000, 10, 20, 3
- Polynomial smoothing order =
3 to 5
- Measurement radius =
2 Reff
- Alignment threshold =
10 degrees
- Spherical threshold for degeneracy categories =
S > 0.8
assumptions (7)
- domain assumption CDM N-body plus SPH simulations with the adopted subgrid physics reproduce the real stellar and DM structure of dwarf galaxies.
- domain assumption The iterative reduced inertia tensor yields unbiased intrinsic 3D axis ratios.
- domain assumption AHF identifications and the R200c definition give the correct halo and subhalo boundaries.
- domain assumption Sersic profile fits to face-on V-band surface brightness profiles provide reliable effective radii.
- domain assumption The Kado-Fong et al. deprojected observational shapes are a valid comparison benchmark.
- domain assumption Blastwave and superbubble SN feedback models bracket plausible baryonic feedback in dwarfs.
- domain assumption A 600 Myr window (last three outputs) is sufficient for merger-perturbed galaxies to return to equilibrium at stellar radii.
Cite this review
Pith. "Pith review of A MARVEL-ous study of how well galaxy shapes reflect Dark Matter halo shapes in Cold Dark Matter Simulations." pith.science (2026). https://pith.science/paper/T57VVGZA
@misc{pith2026250116317,
  author       = {Pith},
  title        = {Pith review of: A MARVEL-ous study of how well galaxy shapes reflect Dark Matter halo shapes in Cold Dark Matter Simulations},
  year         = {2026},
  howpublished = {\url{https://pith.science/paper/T57VVGZA}},
  note         = {Machine review of arXiv:2501.16317}
}
abstract
We present a 3D shape analysis of both dark matter (DM) and stellar matter (SM) in simulated dwarf galaxies to determine whether stellar shape traces DM shape. Using 80 central and satellite galaxies from three simulation suites (Marvelous Massive Dwarfs, Marvelous Dwarfs, and DC Justice League) spanning stellar masses of $10^6$--$10^{10}$ $M_\odot$, we measure 3D shapes through the moment of inertia tensor at two times the effective radius to derive axis ratios ($C/A$, $B/A$) and triaxiality. We find that stellar shape does indeed follow DM halo shape for our dwarf galaxies. However, the presence of a stellar disk in more massive dwarfs ($M_* \gtrsim 10^{7.5}$ $M_\odot$) pulls the distribution of stellar $C/A$ ratios to lower values, while in lower mass galaxies the gravitational potential remains predominantly shaped by DM. Similarly, stellar triaxiality generally tracks dark matter halo triaxiality, with this relationship being particularly strong for non-disky galaxies though weaker in disky systems. This correlation is reinforced by strong alignment between SM and DM axes, particularly in disk galaxies. Further, we find no detectable difference in either SM or DM shape comparing two different SNe feedback implementations, demonstrating that shape measurements may be robust to different implementations of baryonic feedback in dwarf galaxies. We also observe that a dwarf galaxy's shape is largely unperturbed by recent mergers (with merger ratios $>4$). This comprehensive study demonstrates that stellar shape measurements can serve as a reliable tool for inferring DM shapes in dwarf galaxies.
Figures


Figures from the paper (12 more)



Forward citations
Cited by 4 Pith papers
-
MARVELously Dark: the density profile evolution of dwarf halos in velocity-dependent SIDM
In a new SIDM simulation of isolated dwarf halos, nine low-mass halos are core-collapsed, and inner density slope—rather than central density—best tracks collapse onset and matches analytic collapse-time predictions.
-
Pickles on FIRE: The 3D Shape Evolution of Simulated Milky Way-Mass Galaxies
In 13 FIRE-2 Milky Way-mass simulations, all progenitors pass through transient elongated phases, while their present-day stellar populations are symmetric disks or spheroids, implying many observed high-redshift elon...
-
Delayed and Displaced: The Impact of Binary Interactions on Core-collapse SN Feedback
Binary interactions delay about 25% of core-collapse supernovae past the standard 44 million year cutoff and displace about 13% by more than 100 parsecs from their birth clusters in simulated dwarf galaxies.
-
The Formation of Dwarf Galaxy Disks
In 39 simulated isolated dwarfs, extended galaxies grow via merger-built stellar disks that form from high-angular-momentum gas-rich satellites.
Reference graph
Works this paper leans on
-
[1]
V., Leitner, S
Agertz, O., Kravtsov, A. V., Leitner, S. N., & Gnedin, N. Y. 2013,ApJ, 770, 25
2013
-
[2]
I., et al
Agertz, O., Pontzen, A., Read, J. I., et al. 2020,MNRAS ,491, 1656
2020
-
[3]
A., Primack, J
Allgood, B., Flores, R. A., Primack, J. R., et al. 2006,MNRAS ,367, 1781
2006
-
[4]
M., Christensen, C
Applebaum, E., Brooks, A. M., Christensen, C. R., et al. 2021,ApJ,906, 96
2021
-
[5]
2024,ApJ,970, 40
Azartash-Namin, B., Engelhardt, A., Munshi, F., et al. 2024,ApJ,970, 40
2024
-
[6]
P., Bendek, E., Monacelli, B., et al
Bailey, V. P., Bendek, E., Monacelli, B., et al. 2023,Proc. SPIE,12680, 126800T
2023
-
[7]
2005,ApJ,627, 647
Bailin, J., & Steinmetz, M. 2005,ApJ,627, 647
2005
-
[8]
M., Cleary, C
Bellovary, J. M., Cleary, C. E., Munshi, F., et al. 2019,MNRAS ,482, 2913
2019
Show all 91 references
-
[9]
1995,ApJL,447, L25
Burkert, A. 1995,ApJL,447, L25
1995
-
[10]
V., Dutton, A
Butsky, I., Macciò, A. V., Dutton, A. A., et al. 2016,MNRAS ,462, 663
2016
-
[11]
1993,MNRAS ,265, 1013
Caon, N., Capaccioli, M., & D’Onofrio, M. 1993,MNRAS ,265, 1013
1993
-
[12]
E., Tissera, P
Cataldi, P., Pedrosa, S. E., Tissera, P. B., & Artale, M. C. 2021,MNRAS , 501, 5679
2021
-
[13]
K., Kereš, D., Oñorbe, J., et al
Chan, T. K., Kereš, D., Oñorbe, J., et al. 2015,MNRAS ,454, 2981
2015
-
[14]
2012,MNRAS ,425, 3058 Christensen,C.R.,Governato,F.,Quinn,T.,etal.2014,MNRAS ,440,2843
Christensen, C., Quinn, T., Governato, F., et al. 2012,MNRAS ,425, 3058 Christensen,C.R.,Governato,F.,Quinn,T.,etal.2014,MNRAS ,440,2843
2012
-
[15]
Chua, K. T. E., Pillepich, A., Vogelsberger, M., & Hernquist, L. 2019, MNRAS ,484, 476
2019
-
[16]
Chua, K. T. E., Vogelsberger, M., Pillepich, A., & Hernquist, L. 2022, MNRAS ,515, 2681 Colín,P.,Avila-Reese,V.,Valenzuela,O.,&Firmani,C.2002,ApJ,581,777
2022
-
[17]
Collins, M. L. M., & Read, J. I. 2022,NatAs,6, 647 Davé, R., Spergel, D. N., Steinhardt, P. J., & Wandelt, B. D. 2001,ApJ, 547, 574
2022
-
[18]
P., Moore, B., Quinn, T., et al
Debattista, V. P., Moore, B., Quinn, T., et al. 2008,ApJ,681, 1076 delosReyes,M.A.C.,Asali,Y.,Wechsler,R.,etal.2024,arXiv:2409.03959 Di Cintio, A., Brook, C. B., Macciò, A. V., et al. 2014,MNRAS ,437, 415
2008 arXiv
-
[19]
A., Peter, A
Dooley, G. A., Peter, A. H. G., Vogelsberger, M., Zavala, J., & Frebel, A. 2016,MNRAS ,461, 710
2016
-
[20]
A., Buck, T., Macciò, A
Dutton, A. A., Buck, T., Macciò, A. V., et al. 2020,MNRAS ,499, 2648
2020
-
[21]
S., & Valenzuela, L
Fischer, M. S., & Valenzuela, L. M. 2023,A&A ,670, A120
2023
-
[22]
2019,MNRAS ,490, 962
Fitts, A., Boylan-Kolchin, M., Bozek, B., et al. 2019,MNRAS ,490, 962
2019
-
[23]
Fitts, A.,Boylan-Kolchin,M., Elbert,O.D.,etal.2017,MNRAS ,471, 3547
2017
-
[24]
1991,ApJ,383, 112
Franx, M., Illingworth, G., & de Zeeuw, T. 1991,ApJ,383, 112
1991
-
[25]
B., Governato, F., Pontzen, A., et al
Fry, A. B., Governato, F., Pontzen, A., et al. 2015,MNRAS ,452, 1468
2015
-
[26]
2010,Natur,463, 203
Governato, F., Brook, C., Mayer, L., et al. 2010,Natur,463, 203
2010
-
[27]
2012,MNRAS ,422, 1231
Governato, F., Zolotov, A., Pontzen, A., et al. 2012,MNRAS ,422, 1231
2012
-
[28]
2006,PhRvD,74, 123522
Gustafsson, M., Fairbairn, M., & Sommer-Larsen, J. 2006,PhRvD,74, 123522
2006
-
[29]
2012,ApJ,746, 125
Haardt, F., & Madau, P. 2012,ApJ,746, 125
2012
-
[30]
F., Wetzel, A., Kereš, D., et al
Hopkins, P. F., Wetzel, A., Kereš, D., et al. 2018,MNRAS ,480, 800 Ivezić, Ž., Kahn, S. M., Tyson, J. A., et al. 2019,ApJ,873, 111
2018
-
[31]
A., Kaviraj, S., Yi, S
Jackson, R. A., Kaviraj, S., Yi, S. K., et al. 2024,MNRAS ,528, 1655
2024
-
[32]
E., Huang, S., et al
Kado-Fong, E., Greene, J. E., Huang, S., et al. 2020,ApJ,900, 163
2020
-
[33]
Katz, N., & Gunn, J. E. 1991,ApJ,377, 365
1991
-
[34]
Keller, B. W. 2022,ApJ,939, 4 Keller,B.W.,Kruijssen,J.M.D.,&Chevance,M.2022,MNRAS ,514,5355
2022
-
[35]
W., Wadsley, J., Benincasa, S
Keller, B. W., Wadsley, J., Benincasa, S. M., & Couchman, H. M. P. 2014, MNRAS ,442, 3013 Keller,B.W.,Wadsley,J.,&Couchman,H.M.P.2015,MNRAS ,453,3499 Keller,B.W.,Wadsley,J.,&Couchman,H.M.P.2016,MNRAS ,463,1431
2014
-
[36]
R., & Knebe, A
Knollmann, S. R., & Knebe, A. 2009,ApJS,182, 608 Lazar,A.,Bullock,J.S.,Boylan-Kolchin,M.,etal.2020,MNRAS ,497,2393
2009
-
[37]
2020,PDU,30, 100719
Leauthaud, A., Singh, S., Luo, Y., et al. 2020,PDU,30, 100719
2020
-
[38]
Leung, G. Y. C., Leaman, R., Battaglia, G., et al. 2021,MNRAS ,500, 410
2021
-
[39]
D., Schaye, J., Schaller, M., & Bower, R
Ludlow, A. D., Schaye, J., Schaller, M., & Bower, R. 2020,MNRAS , 493, 2926
2020
-
[40]
R., Cuillandre, J.-C., Cantiello, M., et al
Marleau, F. R., Cuillandre, J.-C., Cantiello, M., et al. 2025,A&A ,697, A12
2025
-
[41]
Mateo, M. L. 1998,ARA&A ,36, 435
1998
-
[42]
2006, MNRAS ,369, 1021
Mayer, L., Mastropietro, C., Wadsley, J., Stadel, J., & Moore, B. 2006, MNRAS ,369, 1021
2006
-
[43]
F., & Ostriker, J
McKee, C. F., & Ostriker, J. P. 1977,ApJ,218, 148
1977
-
[44]
2015,ComAC ,2, 1
Menon, H., Wesolowski, L., Zheng, G., et al. 2015,ComAC ,2, 1
2015
-
[45]
2004,MNRAS , 354, 522
Moore, B., Kazantzidis, S., Diemand, J., & Stadel, J. 2004,MNRAS , 354, 522
2004
-
[46]
M., Applebaum, E., et al
Munshi, F., Brooks, A. M., Applebaum, E., et al. 2021,ApJ,923, 35
2021
-
[47]
M., Christensen, C., et al
Munshi, F., Brooks, A. M., Christensen, C., et al. 2019,ApJ,874, 40
2019
-
[48]
B., & Shchekinov, Y
Nath, B. B., & Shchekinov, Y. 2013,ApJL,777, L12
2013
-
[49]
F., Frenk, C
Navarro, J. F., Frenk, C. S., & White, S. D. M. 1996,ApJ,462, 563
1996
-
[50]
F., Ludlow, A., Springel, V., et al
Navarro, J. F., Ludlow, A., Springel, V., et al. 2010,MNRAS ,402, 21
2010
-
[51]
2018,MNRAS ,480, L106
Ogiya, G. 2018,MNRAS ,480, L106
2018
-
[52]
Orkney, M. D. A., Taylor, E., Read, J. I., et al. 2023,MNRAS ,525, 3516 Peter,A.H.G.,Rocha,M.,Bullock, J.S.,&Kaplinghat,M.2013,MNRAS , 430, 105 Peñarrubia, J., Pontzen, A., Walker, M. G., & Koposov, S. E. 2012,ApJL, 759, L42 PlanckCollaboration,Ade,P.A.R.,Aghanim,N.,etal.2016,...
2023
-
[53]
2012,MNRAS ,421, 3464
Pontzen, A., & Governato, F. 2012,MNRAS ,421, 3464
2012
-
[54]
P., Cadiou, C., et al
Pontzen, A., Rey, M. P., Cadiou, C., et al. 2021,MNRAS ,501, 1755
2021
-
[55]
Pontzen, A., Roškar, R., Stinson, G., & Woods, R., 2013 pynbody: N-Body/ SPH Analysis for Python, Astrophysics Source Code Library, ascl: 1305.002
2013
-
[56]
2018,ApJS,237, 23
Pontzen, A., & Tremmel, M. 2018,ApJS,237, 23
2018
-
[57]
F., Jenkins, A., et al
Power, C., Navarro, J. F., Jenkins, A., et al. 2003,MNRAS ,338, 14
2003
-
[58]
I., & Gilmore, G
Read, J. I., & Gilmore, G. 2005,MNRAS ,356, 107
2005
-
[59]
I., Iorio, G., Agertz, O., & Fraternali, F
Read, J. I., Iorio, G., Agertz, O., & Fraternali, F. 2016,MNRAS ,462, 3628
2016
-
[60]
P., Pontzen, A., Agertz, O., et al
Rey, M. P., Pontzen, A., Agertz, O., et al. 2019,ApJL,886, L3
2019
-
[61]
L., Brooks, A
Riggs, C. L., Brooks, A. M., Munshi, F., et al. 2024,ApJ,977, 20
2024
-
[62]
H., Bullock, J
Robles, V. H., Bullock, J. S., Elbert, O. D., et al. 2017,MNRAS ,472, 2945
2017
-
[63]
C., Torrey, P., Vogelsberger, M., & O’Neil, S
Rose, J. C., Torrey, P., Vogelsberger, M., & O’Neil, S. 2023,MNRAS , 519, 5623
2023
-
[64]
N., Karachentsev, I
Roychowdhury, S., Chengalur, J. N., Karachentsev, I. D., & Kaisina, E. I. 2013,MNRAS: Letters,436, L104
2013
-
[65]
J., Mutlu-Pakdil, B., Jones, M
Sand, D. J., Mutlu-Pakdil, B., Jones, M. G., et al. 2024,ApJ,977, 5
2024
-
[66]
B., White, S
Scannapieco, C., Tissera, P. B., White, S. D. M., & Springel, V. 2008, MNRAS ,389, 1137
2008
-
[67]
2010,MNRAS ,407, 1581 Simpson,C.M.,Grand,R.J.J.,Gómez,F.A.,etal.2018,MNRAS ,478,548
Shen, S., Wadsley, J., & Stinson, G. 2010,MNRAS ,407, 1581 Simpson,C.M.,Grand,R.J.J.,Gómez,F.A.,etal.2018,MNRAS ,478,548
2010
-
[68]
N., Bean, R., Doré, O., et al
Spergel, D. N., Bean, R., Doré, O., et al. 2007,ApJS,170, 377
2007
-
[69]
N., & Steinhardt, P
Spergel, D. N., & Steinhardt, P. J. 2000,PhRvL,84, 3760
2000
-
[70]
2006,MNRAS ,373, 1074 Sánchez-Janssen, R., Méndez-Abreu, J., & Aguerri, J
Stinson, G., Seth, A., Katz, N., et al. 2006,MNRAS ,373, 1074 Sánchez-Janssen, R., Méndez-Abreu, J., & Aguerri, J. A. L. 2010,MNRAS: Letters,406, L65
2006
-
[71]
2014, MNRAS ,441, 470
Tenneti, A., Mandelbaum, R., Di Matteo, T., Feng, Y., & Khandai, N. 2014, MNRAS ,441, 470
2014
-
[72]
2016,MNRAS ,458, 4477
Tomassetti, M., Dekel, A., Mandelker, N., et al. 2016,MNRAS ,458, 4477
2016
-
[73]
Tremmel, M., Governato, F., Volonteri, M., & Quinn, T. R. 2015,MNRAS , 451, 1868
2015
-
[74]
2017,MNRAS ,470, 1121
Tremmel, M., Karcher, M., Governato, F., et al. 2017,MNRAS ,470, 1121
2017
-
[75]
A., Long, H., Hirata, C
Troxel, M. A., Long, H., Hirata, C. M., et al. 2021,MNRAS ,501, 2044
2021
-
[76]
2018,PhR,730, 1
Tulin, S., & Yu, H.-B. 2018,PhR,730, 1
2018
-
[77]
M., Remus, R.-S., Dolag, K., & Seidel, B
Valenzuela, L. M., Remus, R.-S., Dolag, K., & Seidel, B. A. 2024,A&A , 690, A206 van der Wel, A., Chang, Y.-Y., Bell, E. F., et al. 2014,ApJL,792, L6
2024
-
[78]
2015,MNRAS ,453, 721
Velliscig, M., Cacciato, M., Schaye, J., et al. 2015,MNRAS ,453, 721
2015
-
[79]
A., Sales, L
Vera-Ciro, C. A., Sales, L. V., Helmi, A., & Navarro, J. F. 2014,MNRAS , 439, 2863
2014
-
[80]
2014,MNRAS , 444, 3684 17 The Astrophysical Journal, 986:138(18pp), 2025 June 20 Keith et al
Vogelsberger, M., Zavala, J., Simpson, C., & Jenkins, A. 2014,MNRAS , 444, 3684 17 The Astrophysical Journal, 986:138(18pp), 2025 June 20 Keith et al
2014
-
[81]
W., Keller, B
Wadsley, J. W., Keller, B. W., & Quinn, T. R. 2017,MNRAS ,471, 2357
2017
-
[82]
W., Stadel, J., & Quinn, T
Wadsley, J. W., Stadel, J., & Quinn, T. 2004,NewA ,9, 137
2004
-
[83]
G., Mateo, M., & Olszewski, E
Walker, M. G., Mateo, M., & Olszewski, E. W. 2009,AJ,137, 3100
2009
-
[84]
2019,MNRAS ,485, 2083
Wang, L., Xu, D., Gao, L., et al. 2019,MNRAS ,485, 2083
2019
-
[85]
H., Abel, T., Turk, M
Wise, J. H., Abel, T., Turk, M. J., Norman, M. L., & Smith, B. D. 2012, MNRAS ,427, 311
2012
-
[86]
L., & Randall, L
Xu, W. L., & Randall, L. 2020,ApJ,900, 69
2020
-
[87]
Yadav, N., Mukherjee, D., Sharma, P., & Nath, B. B. 2017,MNRAS , 465, 1720
2017
-
[88]
Zavala, J., Okamoto, T., & Frenk, C. S. 2008,MNRAS ,387, 364
2008
-
[89]
Y., Gnedin, N
Zemp, M., Gnedin, O. Y., Gnedin, N. Y., & Kravtsov, A. V. 2011,ApJS, 197, 30
2011
-
[90]
R., Faber, S
Zhang, H., Primack, J. R., Faber, S. M., et al. 2019,MNRAS ,484, 5170
2019
-
[91]
M., Willman, B., et al
Zolotov, A., Brooks, A. M., Willman, B., et al. 2012,ApJ,761, 71 18 The Astrophysical Journal, 986:138(18pp), 2025 June 20 Keith et al
2012
Reviewed August 10, 2026 · model on record in the stance chip above.
Discussion (0). Continue with ORCID to comment.