REVIEW 4 major objections 6 minor 13 references
The number of immune defense and counter-defense systems sustained in the arms race between procaryotes and viruses
T0 review · 4 major / 6 minor · reviewed 2026-08-09 · deepseek-v4-flash
Pith's one-line read Prokaryotes and their viruses each sustain only about ten defense and counter-defense layers at a time, because the metabolic and autoimmune costs of each additional layer eventually outweigh its protective benefit.
desk verdict A clean proof-of-principle for a finite defense/counter-defense ceiling, with a neat adaptive-dynamics formula; the order-of-10 headline is real but parameter-sensitive and hinges on unmeasured Cα > Cβ. read the letter →
The pith
A machine-rendered reading of the paper's core claim, the machinery that carries it, and where it could break.
The reading
What carries the argument
The machinery is a Lotka-Volterra population model in which cell strains are labeled by the number of defense layers $i$ and virus strains by the number of counter-defense layers $j$. The growth rates $\beta_i$ and $\chi_j$ decline with layer number under additive or multiplicative metabolic costs, while the attack rate $\alpha_{ij} = \alpha_0(1 - C_\alpha)^{(i-j)\theta(i-j)}$ multiplies by the per-layer protection factor $(1 - C_\alpha)$. An adaptive-dynamics invasion analysis compares a resident strain with $i$ layers to a rare mutant with $i+1$ layers; the boundary where the mutant fails to invade gives Eq. (16). The specific-defense variant replaces the universal attack-rate reduction with combinatorially counted matches between a virus's counter-defense repertoire and a cell's defense repertoire, reducing the benefit of each additional layer.
What would settle it
Measure the growth-rate cost per added defense system ($C_\beta$) and the per-layer reduction in infection success ($C_\alpha$) in isogenic bacterial strains, or count defense repertoires in natural isolates: if a well-mixed population persistently sustains more than about fourteen layers, or if measured costs put $C_\beta$ above $C_\alpha$ while many layers are still maintained, the analytic ceiling in Eq. (16) would be falsified.
Extended reading notes
Core claim
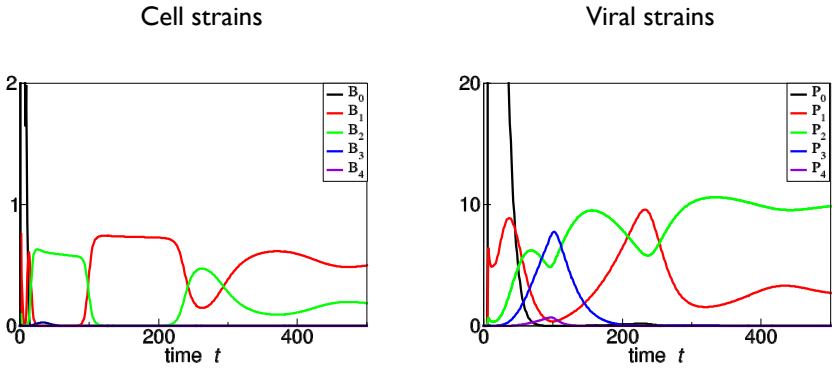
The central claim is that the maximum sustainable number of defense layers is set by the condition that a cell with $i+1$ layers cannot invade a resident population with $i$ layers, yielding $I_{\max} = \ln(\delta C_\alpha/(\alpha_0\chi_0\beta_0 K(C_\alpha - C_\beta))) / \ln[(1 - C_\beta)(1 - C_\chi)]$. For the parameter values adopted, this number rounds to about six under the baseline and ranges from roughly three to fourteen as metabolic costs vary, so the paper states that the sustainable number is "of the order of 10". A second claim is that this non-specific model is an upper bound: when each counter-defense matches only one specific defense, fewer layers survive, because an added layer protects against fewer viral strains while costing the same. The same ecological ceiling appears whether costs are additive or multiplicative and whether simulations include mutational origin of strains or start with all strains present.
Load-bearing premise
The order-of-ten ceiling depends on the assumed per-layer cost coefficients $C_\beta = C_\chi = 0.1$ and $C_\alpha = 0.3$; these values are chosen, not measured, and the formula requires $C_\alpha > C_\beta$, so if real costs differ substantially or the inequality fails, the predicted ceiling shifts or disappears.
Editorial extensions
If this is right
- A typical prokaryote or phage should carry only on the order of ten distinct defense or counter-defense systems at any time, matching the empirical estimates of five to six systems per cell.
- Lowering the metabolic cost of maintaining layers ($C_\beta$, $C_\chi$) or raising the per-layer protection ($C_\alpha$) increases the ceiling, while higher costs shrink it, with the dependence logarithmic.
- Specific matching between a defense and its counter-defense reduces sustainable layers below the non-specific upper bound, because each added layer protects against fewer viral strains.
- The same invasion-condition logic predicts a finite arsenal size in any antagonistic coevolution setting with per-layer costs, including predator-prey and pathogen-host interactions.
Reading between the lines
- The model suggests a quantitative route to testing the cost hypothesis: direct measurements of growth-rate penalties for individual defense systems in otherwise isogenic strains would pin down $C_\beta$, and comparative genomics across environments could check whether observed defense counts track the predicted logarithmic dependence on costs.
- If the ceiling is real, it predicts that newly discovered defense systems will not accumulate in single genomes but spread across the pangenome, with any single strain carrying a bounded subset; the paper's pooled-repertoire assumption via horizontal gene transfer makes this a testable corollary.
- Extending the model to spatially structured populations, as the authors note they plan to do, could raise the effective number of coexisting systems because segregated populations may fix different subsets, so the order-of-ten bound applies per local population rather than per global species.
- The same cost-benefit invasion logic could be applied quantitatively to eukaryotic immune-pathogen conflicts or to antibiotic production and resistance, where per-layer metabolic costs are also measurable, offering a concrete way to test the universality claim the authors raise qualitatively.
Editorial analysis
A structured set of objections, weighed in public.
Referee Report
Summary. The paper proposes a Lotka-Volterra model for the coevolution of prokaryotes and phages in which cells carry layers of immune defense and viruses carry layers of counter-defense. Growth costs are modeled additively or multiplicatively, and the attack rate is reduced by a factor (1-C_alpha) per unmatched defense layer. Using an adaptive-dynamics invasion condition, the authors derive an analytic estimate, Eq. (16), for the maximal sustainable number of defense layers, I_max, under multiplicative costs. They simulate both ecological and evolutionary versions of the model and report that the simulated maximal layer counts match the analytic estimate for the parameter sets considered, with values ranging from 3 to 14 and a headline claim that the number of sustainable layers is of order 10. They also present a model with specific, one-to-one defense-counter-defense matching and argue, via a combinatorial calculation in Section 5.2, that specificity reduces the sustainable number of layers relative to the non-specific case.
Significance. If the result holds, the paper offers a simple, transparent cost-benefit explanation for why prokaryotes and phages carry only a handful of defense and counter-defense systems, and it provides an explicit formula that could be tested or refined with empirical parameter estimates. The analytic derivation is clearly presented, and the agreement between Eq. (16) and the simulations of the same model is a useful internal consistency check. The exploration of additive versus multiplicative costs and of non-specific versus specific mechanisms is a strength, as is the authors' explicit acknowledgment in the Discussion that the well-mixed assumption is a limitation. However, the headline order-of-10 number rests on unmeasured cost parameters and on the inequality C_alpha > C_beta, and the simulation-consistent estimate is not an independent empirical validation. The combinatorial argument in Section 5.2 also contains a technical error in the attack-rate calculation. These issues do not destroy the core theoretical idea but require correction and more careful framing before the quantitative claims can be accepted.
major comments (4)
- [Section 4, Eq. (16)] The derivation of I_max requires C_alpha > C_beta, but this condition is not empirically established or varied in the simulations. If C_alpha = C_beta, the denominator C_alpha - C_beta vanishes and the invasion condition (13) is satisfied for every i, so the model predicts no finite maximum from this criterion. If C_alpha < C_beta, the argument of the logarithm in Eq. (16) is negative and I_max is undefined. All parameter sets in Table 1 and the robustness scans keep C_alpha > C_beta, so the claim that the order-of-10 result holds for a 'broad range of assumptions' is not supported. Please either provide empirical or literature-based constraints on C_alpha and C_beta, or explicitly restrict the claims to the regime C_alpha > C_beta and discuss the behavior outside that regime.
- [Section 5.2] The combinatorial calculation uses (1 - 2C_alpha) for the attack rate when a virus lacks two matching counter-defenses, but Section 5.1 defines the attack rate multiplicatively as alpha_0 (1 - C_alpha)^k when k defenses are unmatched. With the correct multiplicative form, A_resident = (alpha P/6)[1 + 4(1-C_alpha) + (1-C_alpha)^2] and A_mutant = (alpha P/6)[3(1-C_alpha) + 3(1-C_alpha)^2], giving A_resident - A_mutant = alpha P C_alpha (3 - 2 C_alpha)/6, not alpha P C_alpha/2. The qualitative conclusion that the specific model gives a smaller reduction than the non-specific model survives for C_alpha < 1, but the quantitative factor and the claim that the non-specific reduction is 'twice larger' are incorrect and should be revised.
- [Table 2 and Section 3] The sensitivity of I_max to the cost parameters is larger than the 'order of 10' framing suggests. Changing C_beta and C_chi from 0.1 to 0.05 changes I_max from 5.7 to 13.9, and changing them to 0.15 changes I_max to 2.8. A value of 2.8 layers is not naturally described as 'of the order of 10'. Since the abstract and Discussion present the order-of-10 result as the central finding, the paper should either constrain the parameter range with empirical arguments or soften the claim to indicate that the predicted number is sensitive to costs and lies somewhere between a few and about a dozen for the tested range.
- [Section 4 and Discussion] The agreement between Eq. (16) and the simulation results is an internal consistency check, because the simulations are generated from the same model equations and the same parameter values that enter the analytic estimate. This is valuable as a check on the derivation, but it is not independent validation of the predicted layer count. The manuscript cites the observed 5-6 defense systems per cell only qualitatively; a more direct quantitative comparison with empirical distributions of defense and counter-defense counts would strengthen the claim that the model captures biologically realistic limits.
minor comments (6)
- [Significance statement] The phrase 'using for definity an example' appears to be a typo for 'using for definiteness an example'; please correct it.
- [Title and Abstract] The title uses 'procaryotes' while the abstract and main text use 'prokaryotes'; please standardize the spelling.
- [Section 5.2] The notation 'A_resident - A_mutant = -alpha C_alpha P/2' is internally inconsistent: since A_mutant is smaller than A_resident, the difference is positive, not negative. The sign convention should be clarified.
- [Table 2] The text says the estimate 'rounds up' to the observed values; since I_max is fractional, clarify that the observed maximum is the ceiling of I_max, and note that this convention is used throughout.
- [Discussion] The sentence 'In the first part of our study that mimics innate immunity' may mislead, as the non-specific model is a mathematical abstraction rather than a model of innate immunity specifically; consider rewording.
- [Supplementary figures] Supplementary Figures 5 and 6 captions contain the typo 'As a results'; please correct to 'As a result'.
Circularity Check
No significant circularity: Eq. (16) is derived from the model equations, simulations are internal consistency checks, and the sole overlapping-author citation is external empirical support.
full rationale
The paper's derivation chain is self-contained. The analytic estimate (Eq. 16) is obtained by an adaptive-dynamics argument: a resident cell-virus pair at steady state (Eqs. 11-12) is invaded by a rare mutant with one extra defense layer, and requiring the mutant's growth rate to be negative gives inequality (13), which after substitution of the multiplicative cost forms yields (15)-(16). This is a mathematical consequence of the model in Section 2, not an independent input. The simulations in Section 2.5 integrate the same Lotka-Volterra equations, so the agreement in Table 2 is an internal consistency check of the approximation, not a fitted prediction; none of the parameters in Eq. (16) are tuned to the simulated layer counts. The only citation with overlapping authorship, [Kirillov et al., 2022], is used to support the statement that a successful defense reduces infection by a factor, which is external experimental evidence and does not by itself force the mathematical form (6); the form remains an explicit modeling assumption. The hand-chosen cost coefficients in Table 1 and the requirement C_alpha > C_beta for Eq. (16) to be real are robustness and sensitivity concerns, not circularity: they do not make the claimed limit identical to its inputs by definition. The Discussion's explicit acknowledgment of the well-mixed assumption is a limitation, not evidence of circularity. No step in the derivation reduces to its own conclusion, so the appropriate finding is no significant circularity.
Assumptions & free parameters
free parameters (4)
- Cβ, cellular per-layer metabolic/autoimmune cost =
0.1 (varied to 0.05 and 0.15)
- Cχ, viral per-layer counter-defense cost =
0.1 (varied to 0.05 and 0.15)
- Cα, attack-rate reduction per defense layer =
0.3 (varied to 0.5 in Supplementary Fig. 4)
- Baseline demographic ratio δ/(α0χ0β0K) =
0.2 (from Table 1: δ=1, α0=0.1, χ0=5, β0=10, K=1)
assumptions (6)
- domain assumption Well-mixed Lotka-Volterra population dynamics with no spatial structure or migration (Eq. 1)
- domain assumption Non-specific attack rate depends only on the difference (i-j), with each counter-defense perfectly canceling one defense layer (Eq. 6)
- domain assumption Metabolic costs are identical for every defense and counter-defense layer and follow additive or multiplicative forms (Eqs. 2-5)
- standard math Adaptive-dynamics invasion criterion: a rare mutant's growth rate at resident steady state determines the evolutionary maximum (Section 4)
- ad hoc to paper The inequality Cα>Cβ holds, so the right-hand side of Eq. (15) is positive
- domain assumption In the specific model, all strains with the same number of layers have equal population densities (Section 5.2)
Cite this review
Pith. "Pith review of The number of immune defense and counter-defense systems sustained in the arms race between procaryotes and viruses." pith.science (2026). https://pith.science/paper/3S3GCZPT
@misc{pith2026250201021,
  author       = {Pith},
  title        = {Pith review of: The number of immune defense and counter-defense systems sustained in the arms race between procaryotes and viruses},
  year         = {2026},
  howpublished = {\url{https://pith.science/paper/3S3GCZPT}},
  note         = {Machine review of arXiv:2502.01021}
}
read the original abstract
Prokaryotes have evolved various mechanisms to counter viruses, which in their turn developed numerous strategies to avoid defenses of the hosts. Dozens of such defense and counter-defense mechanisms have recently been discovered, yet the number of such systems held by a given virus or its host is limited. Here, we present numerical and theoretical arguments for the existence of the maximal number of ecologically and evolutionary sustainable defense and counter-defense systems maintained by both sides at any time of the never-ending evolutionary arms race. We find that the number of such systems is of the order of 10 for a broad range of assumptions about the costs and benefits of defense and counter-defense mechanisms and their specificity. This optimum in the number of defense and counter-defense systems appears as a result of a compromise between the metabolic and autoimmune costs of adding a new layer of defense and the benefits it conveys.
Figures


Figures from the paper (1 more)
Reference graph
Works this paper leans on
-
[1]
Agapov, A., Baker, K. S., Bedekar, P., Bhatia, R. P., Blower, T. R., Brockhurst, M. A., Brown, C., Chong, C. E., Fothergill, J. L., Graham, S., et al. (2024). Multi-layered genome defences in bacteria. Current Opinion in Microbiology , 78:102436
work page 2024
-
[2]
Arias, C. F., Acosta, F. J., Bertocchini, F., Herrero, M. A., and Fern \'a ndez-Arias, C. (2022). The coordination of anti-phage immunity mechanisms in bacterial cells. Nature communications , 13(1):7412
work page 2022
-
[3]
Castledine, M., Sierocinski, P., Inglis, M., Kay, S., Hayward, A., Buckling, A., and Padfield, D. (2022). Greater phage genotypic diversity constrains arms-race coevolution. Frontiers in Cellular and Infection Microbiology , 12:834406
work page 2022
-
[4]
Dieckmann, U. and Law, R. (1996). The dynamical theory of coevolution: a derivation from stochastic ecological processes. Journal of mathematical biology , 34:579--612
work page 1996
-
[5]
S., Mitarai, N., and Sneppen, K
Eriksen, R. S., Mitarai, N., and Sneppen, K. (2020). Sustainability of spatially distributed bacteria-phage systems. Scientific reports , 10(1):3154
work page 2020
-
[6]
Hampton, H. G., Watson, B. N., and Fineran, P. C. (2020). The arms race between bacteria and their phage foes. Nature , 577(7790):327--336
work page 2020
-
[7]
Kimchi, O., Meir, Y., and Wingreen, N. S. (2024a). Bacterial defense and phage counter-defense lead to coexistence in a modeled ecosystem. bioRxiv , pages 2024--07
work page 2024
-
[8]
Kimchi, O., Meir, Y., and Wingreen, N. S. (2024b). Lytic and temperate phage naturally coexist in a dynamic population model. The ISME Journal , 18(1)
work page 2024
Show all 13 references
-
[9]
Kirillov, A., Morozova, N., Kozlova, S., Polinovskaya, V., Smirnov, S., Khodorkovskii, M., Zeng, L., Ispolatov, Y., and Severinov, K. (2022). Cells with stochastically increased methyltransferase to restriction endonuclease ratio provide an entry for bacteriophage into protect...
2022
-
[10]
Millman, A., Melamed, S., Leavitt, A., Doron, S., Bernheim, A., H \"o r, J., Garb, J., Bechon, N., Brandis, A., Lopatina, A., et al. (2022). An expanded arsenal of immune systems that protect bacteria from phages. Cell host & microbe , 30(11):1556--1569
2022
-
[11]
Safari, F., Sharifi, M., Farajnia, S., Akbari, B., Karimi Baba Ahmadi, M., Negahdaripour, M., and Ghasemi, Y. (2020). The interaction of phages and bacteria: the co-evolutionary arms race. Critical reviews in biotechnology , 40(2):119--137
2020
-
[12]
Wang, Y., Fan, H., and Tong, Y. (2023). Unveil the secret of the bacteria and phage arms race. International Journal of Molecular Sciences , 24(5):4363
2023
-
[13]
K., van den Hurk, A., Aparicio-Maldonado, C., Kushwaha, S
Wu, Y., Garushyants, S. K., van den Hurk, A., Aparicio-Maldonado, C., Kushwaha, S. K., King, C. M., Ou, Y., Todeschini, T. C., Clokie, M. R., Millard, A. D., et al. (2024). Bacterial defense systems exhibit synergistic anti-phage activity. Cell Host & Microbe , 32(4):557--572
2024
Reviewed August 9, 2026 · model on record in the stance chip above.
Discussion (0). Continue with ORCID to comment.