REVIEW 2 major objections 5 minor 2 cited by
The relationship between galaxy size and halo properties: Insights from the IllustrisTNG simulations and differential clustering
T0 review · 2 major / 5 minor · reviewed 2026-08-09 · deepseek-v4-flash
Pith's one-line read In the TNG simulations, the size-based differential clustering of galaxies is produced mainly by satellite galaxies rather than by correlations between galaxy size and halo spin or concentration.
desk verdict Direct measurement of size-based differential clustering in TNG300, mostly a satellite effect; the interpretation is plausible but rests on the least-resolved satellites. read the letter →
The pith
A machine-rendered reading of the paper's core claim, the machinery that carries it, and where it could break.
The reading
What carries the argument
The load-bearing objects are the ratio $r_{\rm gal}/R_{\rm vir}$, the projected two-point correlation function $w_p(r_p)$ computed for large and small galaxy samples, and the decomposition of that clustering into central and satellite contributions. To avoid baryonic contamination of halo properties, the analysis uses halo catalogs from dark-matter-only runs with matched initial conditions, linked to the full-physics galaxies by a bijective matching procedure. The decisive step is recomputing $w_p$ after removing satellite galaxies: the size-based clustering ratio returns near unity, which isolates satellites as the mechanism carrying the signal.
What would settle it
Repeat the large-versus-small clustering ratio at $z=0$ for central galaxies only in a higher-resolution cosmological simulation of the same volume, or with satellite sizes recomputed at higher particle resolution: if the signal remains significantly below unity, or if the satellite sizes change enough to alter the ratio, the claim that satellites drive the signal would be overturned.
Extended reading notes
Core claim
The paper's central claim is that in the IllustrisTNG300 simulation, the scale-dependent differential clustering of small versus large galaxies at fixed stellar mass is produced almost entirely by satellite galaxies, and is not a direct consequence of correlations between galaxy size and secondary halo properties such as spin or concentration. At $z=0$, TNG reproduces the observed pattern, with large galaxies less clustered than small ones and a stronger signal on small scales, but nearly all of the signal vanishes when the sample is restricted to central galaxies. The correlations the paper does measure, a positive $r_{\rm gal}/R_{\rm vir}$-concentration trend above $c \sim 16$ and a correlation with halo formation time, are confined to central galaxies and cannot account for the clustering pattern. The authors interpret this as support for a simple picture in which a satellite's size is set at the time its halo reached peak mass, so satellites appear small because their halos formed and stopped growing in a denser, earlier universe.
Load-bearing premise
The argument depends on the assumption that low-mass satellite galaxies in TNG300 are modeled faithfully enough, in size, abundance, and clustering, that the measured satellite contribution is trustworthy rather than a numerical artifact of limited resolution.
Editorial extensions
If this is right
- If the satellite-driven interpretation holds, the observed size-dependent clustering does not require a direct physical link between galaxy radius and halo spin or concentration, so the apparent disagreement between observations and simulation-based size-halo correlations is resolved.
- The same mechanism predicts that size-based differential clustering should weaken with cosmic time and reverse in sign by $z \sim 3$, as the central galaxy population becomes relatively more clustered.
- Future measurements of size-dependent clustering from wide-area imaging surveys can test whether the signal indeed comes from the satellite population, since satellites should also show distinctive color and environmental signatures.
- Empirical models that assign galaxy sizes using only the halo's peak-mass radius, as in the earlier satellite model, can reproduce the TNG differential clustering without invoking secondary halo properties.
Reading between the lines
- If the signal is truly satellite-dominated, size-selected clustering becomes a practical probe of satellite quenching and environmental stripping, not of halo spin, in surveys where color and size are measured together.
- Because the conclusion leans on low-mass satellites in TNG300, which may be under-resolved, a natural next test is to repeat the central-only decomposition in a higher-resolution simulation or with subhalo-rich dark-matter-only models; if better-resolved satellites shift either their sizes or their abundance, the size of the satellite contribution could change.
- The weak reversal seen for central galaxies at high redshift suggests that size and halo mass are not entirely independent, and this residual correlation could become measurable in larger volumes.
- One could test the mechanism directly by predicting, from the same size assignment rule, the satellite size distribution and its dependence on host-centric distance, and comparing it with future wide-field imaging.
Editorial analysis
A structured set of objections, weighed in public.
Referee Report
Summary. The paper investigates correlations between the ratio of galaxy size to host halo virial radius (r_gal/R_vir) and halo spin, concentration, and formation time using the IllustrisTNG suite (TNG50, TNG100, TNG300) together with matched dark-matter-only simulations from which halo properties are measured. It reports essentially no correlation with spin at z=0, a positive correlation with NFW concentration only for c_NFW >~16, and a positive correlation with formation time. The paper then measures the projected two-point correlation function of large versus small galaxies in stellar mass bins in TNG300 and compares directly with SDSS measurements from Behroozi et al. (2022). The simulation qualitatively reproduces the observed scale-dependent differential clustering, but the signal nearly disappears when only central galaxies are considered, leading the authors to conclude that the differential clustering is driven primarily by satellite galaxies rather than by correlations between galaxy size and secondary halo properties.
Significance. If the satellite-driven interpretation is correct, the paper resolves the tension raised by Behroozi et al. (2022): size-dependent clustering need not imply a direct physical link between galaxy size and halo spin or concentration, and the Hearin et al. (2019) picture is supported. The paper provides the first direct measurement of size-based differential clustering in a cosmological hydrodynamic simulation, and it makes falsifiable high-redshift predictions for forthcoming surveys. Notable strengths are the use of halo properties from matched dark-matter-only runs to avoid baryonic contamination of halo parameters, direct comparison with observational clustering measurements, and the use of jackknife error estimates. The results are emergent measurements from an existing simulation suite and are not obtained by fitting model parameters to the target clustering signal, so circularity is not a concern.
major comments (2)
- [Sec. 4.3; Fig. 8] The central claim that 'nearly all' of the size-based differential clustering arises from satellites is not robust to the resolution limitations that the paper itself acknowledges. The lowest stellar mass bin (9.75 < log M*/M_sun < 10.25) includes satellites whose stellar masses correspond to roughly 100 stellar particles, and Sec. 4.3 states that such systems may have too few particles or too low spatial resolution to accurately simulate tidal and ram pressure stripping. The central-only clustering in Fig. 8 is a null measurement with large jackknife errors, so the wording that the signal has 'almost entirely disappeared' is stronger than the data support. The authors should demonstrate resolution robustness, for example by recomputing the all-galaxy and central-only clustering in TNG100 (which has higher mass resolution, albeit smaller volume) or by removing the lowest mass bin and showing that the satellite-driven conclusion is unchanged.
- [Sec. 3.2; Fig. 3] The critical concentration threshold c ~ 16 is identified post hoc from the same data and is not supported by any statistical test. The paper does not report confidence intervals on the r_gal/R_vir versus c_NFW relation in the high-concentration regime, nor does it test whether the change in slope at c ~ 16 is significant rather than a binning artifact. The subsequent interpretation in Sec. 4.1 that the upturn is driven by stripped or splashback halos with non-monotonic mass accretion histories is plausible but not quantitatively demonstrated. The authors should add a quantitative significance analysis, e.g., Spearman correlation coefficients in concentration bins with bootstrap errors, and state clearly whether the threshold is a fitted parameter or a descriptive summary of the data.
minor comments (5)
- [Sec. 2.4, Eq. (2)] The summation over line-of-sight separations in the estimator for w_p(r) does not explicitly include the bin width Delta pi; as written, the projected correlation function is missing the usual multiplicative factor and the units are not transparent.
- [Sec. 3.2, first paragraph] The phrase 'at lower correlations log c_NFW <~ 1.2' should read 'at lower concentrations'.
- [Sec. 4.2] There is a typo in the list of B22 models: 'dicfferent' should be 'different'.
- [Sec. 5, conclusions] The summary statement that 'central galaxies with larger radii tend to be hosted by halos of larger mass and higher concentration' is not fully consistent with Fig. 10, where at z=0-1 the concentration difference between large and small centrals appears only in the highest stellar mass bin.
- [Abstract and Sec. 2.2] The abstract says 'galaxy formation history and environment ... plays an important role'; the verb should agree with the plural compound subject ('play'). Also, the spelling 'bijective' with a special character should be rendered as 'bijective' for accessibility.
Circularity Check
No significant circularity: the correlations and clustering measurements are emergent outputs of IllustrisTNG, compared against external SDSS/B22 data without fitting the target signal.
full rationale
The paper's derivation chain is self-contained in the sense required here: it does not fit any parameter to the differential clustering signal it claims to predict. Galaxy sizes, halo properties, and clustering are all measured from the IllustrisTNG simulation outputs, with halo properties taken from matched dark-matter-only rockstar runs (Gabrielpillai et al. 2021). The size-halo correlations in Sec. 3.2 are direct measurements of r_gal/R_vir against spin, concentration, and formation time; none of these quantities is defined in terms of the others. The differential clustering in Sec. 3.3 is computed with the standard projected correlation function estimator, splitting galaxies by whether their size is above or below the median in each stellar mass bin; this is a measurement, not a constructed prediction. The central claim that satellites drive the signal is based on the central-only version of the same statistic (Fig. 8), which is a subsample decomposition rather than an identity forced by construction. The comparison with Behroozi et al. (2022) uses external SDSS observations and external empirical models, and no TNG parameter is calibrated to reproduce those clustering measurements. The paper's own caveat that TNG300 satellites may be under-resolved (Sec. 4.3) is a robustness/correctness concern, not a circularity: it affects whether the emergent satellite attribution is physically reliable, but it does not make any equation or claim equivalent to its inputs by definition. Self-citations (e.g., Gabrielpillai et al. 2021 for the bijective matching catalogs, Pillepich et al. 2019 for stellar-mass rescaling) supply tools and corrections, not the target result, and the cited matching work is a separate catalog product. No circular step can be exhibited with a specific equation-to-equation reduction, so the appropriate finding is no significant circularity with score 0.
Assumptions & free parameters
free parameters (2)
- TNG300 stellar mass rescaling factors =
1.4 at z=0; 1.3 at z=1; 1.1 at z=2; 1.0 at z=3
- Critical concentration threshold c~16 =
~16 (log10 c ~1.2)
assumptions (6)
- domain assumption The IllustrisTNG subgrid baryonic model predicts realistic galaxy sizes and stellar masses at z=0-3.
- domain assumption Dark-matter-only halo properties describe the same halos as in the full-physics runs after bijective matching.
- domain assumption NFW profile fits provide reliable halo concentrations, including for stripped or splashback halos.
- domain assumption Bryan and Norman (1998) mass and radius definitions and Peebles (1969) spin parameter are the appropriate halo conventions.
- ad hoc to paper Redshift-dependent stellar mass rescaling factors from Pillepich et al. (2019) correct resolution trends in TNG300.
- standard math Jackknife resampling over 27 subboxes gives unbiased uncertainty estimates for wp.
Cite this review
Pith. "Pith review of The relationship between galaxy size and halo properties: Insights from the IllustrisTNG simulations and differential clustering." pith.science (2026). https://pith.science/paper/4C2ILBMA
@misc{pith2026250203679,
  author       = {Pith},
  title        = {Pith review of: The relationship between galaxy size and halo properties: Insights from the IllustrisTNG simulations and differential clustering},
  year         = {2026},
  howpublished = {\url{https://pith.science/paper/4C2ILBMA}},
  note         = {Machine review of arXiv:2502.03679}
}
abstract
The physical origin of the radial sizes of galaxies and how galaxy sizes are correlated with the properties of their host dark matter halos is an open question in galaxy formation. In observations, the large-scale clustering of galaxies selected by stellar mass is significantly different for large and small galaxies, and Behroozi et al. (2022) showed that these results are in tension with some of the correlations between galaxy size and halo properties in the literature. We analyze the IllustrisTNG suite of large volume cosmological hydrodynamic simulations along with dark matter only simulations with matched initial conditions. We investigate correlations between the ratio of galaxy size to halo virial radius ($r_{\rm gal}/R_{\rm vir}$) and halo spin, concentration, and formation time at redshift 0-3. We find a significant correlation between $r_{\rm gal}/R_{\rm vir}$ and concentration, but only above a critical value $c \simeq 16$, and we also find a correlation between $r_{\rm gal}/R_{\rm vir}$ and halo formation time. We suggest that galaxy formation history and environment, in addition to halo properties at a given output time, play an important role in shaping galaxy size. In addition, we directly measure size-based differential clustering in the TNG300 simulation and compare directly with the observational results. We find significant scale-dependent size-based differential clustering in TNG, in qualitative agreement with observations. However, correlations between $r_{\rm gal}/R_{\rm vir}$ and secondary halo properties are not the drivers of the differential clustering in the simulations; instead, we find that most of this signal in TNG arises from satellite galaxies.
Figures
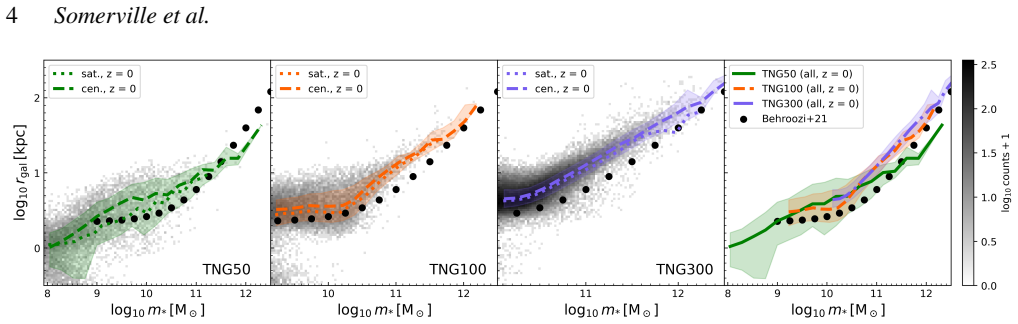


Figures from the paper (8 more)


Forward citations
Cited by 2 Pith papers
-
Introducing the Phoebos simulation: galaxy properties at the dawn of galaxy formation
A new large cosmological simulation with weak stellar feedback reproduces the stellar masses, sizes, star formation rates, and halo relations of galaxies at z roughly 8 to 12 seen by JWST.
-
Modeling the Mass Distribution and Gravitational Potential of Nearby Disk Galaxies: Implications for the ISM Dynamical Equilibrium
For 17 nearby disk galaxies, the gas scale height rises from under 100 parsecs in the inner disks to over 500 parsecs at large radii, with gas and dark matter gravity often dominating the vertical pressure budget beyo...
Reference graph
Works this paper leans on
-
[1]
Agertz O., Kravtsov A. V., 2016, @doi [ ] 10.3847/0004-637X/824/2/79 , http://adsabs.harvard.edu/abs/2016ApJ...824...79A 824, 79
-
[2]
Ahumada R., et al., 2020, @doi [ ] 10.3847/1538-4365/ab929e , https://ui.adsabs.harvard.edu/abs/2020ApJS..249....3A 249, 3
-
[3]
Barden M., et al., 2005, @doi [ ] 10.1086/497679 , http://adsabs.harvard.edu/cgi-bin/nph-bib_query?bibcode=2005ApJ...635..959B&db_key=AST 635, 959
doi:10.1086/497679 2005
-
[4]
Behroozi P. S., Conroy C., Wechsler R. H., 2010, @doi [ ] 10.1088/0004-637X/717/1/379 , http://adsabs.harvard.edu/abs/2010ApJ...717..379B 717, 379
-
[5]
Behroozi P. S., Wechsler R. H., Wu H.-Y., Busha M. T., Klypin A. A., Primack J. R., 2013a, , 763, 18
-
[6]
Behroozi P. S., Wechsler R. H., Conroy C., 2013b, @doi [ ] 10.1088/0004-637X/770/1/57 , http://adsabs.harvard.edu/abs/2013ApJ...770...57B 770, 57
-
[7]
Behroozi P., Hearin A., Moster B. P., 2022, @doi [ ] 10.1093/mnras/stab3193 , https://ui.adsabs.harvard.edu/abs/2022MNRAS.509.2800B 509, 2800
-
[9]
Blumenthal G. R., Faber S. M., Primack J. R., Rees M. J., 1985, @doi [ ] 10.1038/313072a0 , https://ui.adsabs.harvard.edu/abs/1985Natur.313...72B 313, 72
Show all 74 references
-
[10]
Blumenthal G., Faber S., Flores R., Primack J., 1986, , 301, 27
1986
-
[11]
Bose S., Eisenstein D. J., Hernquist L., Pillepich A., Nelson D., Marinacci F., Springel V., Vogelsberger M., 2019, @doi [ ] 10.1093/mnras/stz2546 , https://ui.adsabs.harvard.edu/abs/2019MNRAS.490.5693B 490, 5693
2019 doi
-
[12]
Brinchmann J., Charlot S., White S. D. M., Tremonti C., Kauffmann G., Heckman T., Brinkmann J., 2004, @doi [ ] 10.1111/j.1365-2966.2004.07881.x , https://ui.adsabs.harvard.edu/abs/2004MNRAS.351.1151B 351, 1151
2004
-
[13]
L., Norman M
Bryan G. L., Norman M. L., 1998, @doi [ ] 10.1086/305262 , http://adsabs.harvard.edu/abs/1998ApJ...495...80B 495, 80
1998 doi
-
[14]
Chabrier G., 2003, @doi [ ] 10.1086/374879 , https://ui.adsabs.harvard.edu/abs/2003ApJ...586L.133C 586, L133
2003 doi
-
[15]
S., Ostriker J
Choi E., Somerville R. S., Ostriker J. P., Naab T., Hirschmann M., 2018, @doi [ ] 10.3847/1538-4357/aae076 , https://ui.adsabs.harvard.edu/abs/2018ApJ...866...91C 866, 91
2018 doi
-
[16]
E., Zennaro M., 2021, @doi [ ] 10.1093/mnras/stab1170 , https://ui.adsabs.harvard.edu/abs/2021MNRAS.504.5205C 504, 5205
Contreras S., Angulo R. E., Zennaro M., 2021, @doi [ ] 10.1093/mnras/stab1170 , https://ui.adsabs.harvard.edu/abs/2021MNRAS.504.5205C 504, 5205
2021 doi
-
[17]
J., Jonsson P., Primack J
Covington M., Dekel A., Cox T. J., Jonsson P., Primack J. R., 2008, , 384, 94
2008
-
[18]
D., Primack J
Covington M. D., Primack J. R., Porter L. A., Croton D. J., Somerville R. S., Dekel A., 2011, @doi [ ] 10.1111/j.1365-2966.2011.18926.x , http://adsabs.harvard.edu/abs/2011MNRAS.tmp.1029C p. 1029
2011
-
[19]
J., Spergel D
Dalcanton J. J., Spergel D. N., Summers F. J., 1997, @doi [ ] 10.1086/304182 , https://ui.adsabs.harvard.edu/abs/1997ApJ...482..659D 482, 659
1997 doi
-
[20]
Desmond H., Mao Y.-Y., Wechsler R., Crain R., Schaye J., 2017, @doi [ ] 10.1093/mnrasl/slx093 , 471, L11
2017 doi
-
[21]
A., et al., 2011, @doi [ ] 10.1111/j.1365-2966.2010.17555.x , http://adsabs.harvard.edu/abs/2011MNRAS.410.1660D 410, 1660
Dutton A. A., et al., 2011, @doi [ ] 10.1111/j.1365-2966.2010.17555.x , http://adsabs.harvard.edu/abs/2011MNRAS.410.1660D 410, 1660
2011
-
[22]
F., Kere s D., Chan T
El-Badry K., Wetzel A., Geha M., Hopkins P. F., Kere s D., Chan T. K., Faucher-Gigu \`e re C.-A., 2016, @doi [ ] 10.3847/0004-637X/820/2/131 , https://ui.adsabs.harvard.edu/abs/2016ApJ...820..131E 820, 131
2016 doi
-
[23]
C., et al., 2004, , http://adsabs.harvard.edu/cgi-bin/nph-bib_query?bibcode=2004ApJ...600L.107F&db_key=AST 600, L107
Ferguson H. C., et al., 2004, , http://adsabs.harvard.edu/cgi-bin/nph-bib_query?bibcode=2004ApJ...600L.107F&db_key=AST 600, L107
2004
-
[24]
Furlong M., et al., 2017, @doi [ ] 10.1093/mnras/stw2740 , https://ui.adsabs.harvard.edu/abs/2017MNRAS.465..722F 465, 722
2017 doi
-
[25]
S., Genel S., Rodriguez-Gomez V., Pandya V., Yung L
Gabrielpillai A., Somerville R. S., Genel S., Rodriguez-Gomez V., Pandya V., Yung L. Y. A., Hernquist L., 2021, arXiv e-prints, https://ui.adsabs.harvard.edu/abs/2021arXiv211103077G p. arXiv:2111.03077
2021 arXiv
-
[26]
M., Hernquist L., Vogelsberger M., Snyder G
Genel S., Fall S. M., Hernquist L., Vogelsberger M., Snyder G. F., Rodriguez-Gomez V., Sijacki D., Springel V., 2015, @doi [ ] 10.1088/2041-8205/804/2/L40 , 804, L40
2015 doi
-
[27]
Genel S., et al., 2018, @doi [ ] 10.1093/mnras/stx3078 , https://ui.adsabs.harvard.edu/abs/2018MNRAS.474.3976G 474, 3976
2018 doi
-
[28]
N., 2020, @doi [ ] 10.1093/mnras/staa623 , https://ui.adsabs.harvard.edu/abs/2020MNRAS.493.5506H 493, 5506
Hadzhiyska B., Bose S., Eisenstein D., Hernquist L., Spergel D. N., 2020, @doi [ ] 10.1093/mnras/staa623 , https://ui.adsabs.harvard.edu/abs/2020MNRAS.493.5506H 493, 5506
2020 doi
-
[29]
S., Gabrielpillai A., Bose S., Eisenstein D., Hernquist L., 2021, @doi [ ] 10.1093/mnras/stab2564 , https://ui.adsabs.harvard.edu/abs/2021MNRAS.508..698H 508, 698
Hadzhiyska B., Liu S., Somerville R. S., Gabrielpillai A., Bose S., Eisenstein D., Hernquist L., 2021, @doi [ ] 10.1093/mnras/stab2564 , https://ui.adsabs.harvard.edu/abs/2021MNRAS.508..698H 508, 698
2021 doi
-
[30]
Hearin A., Behroozi P., Kravtsov A., Moster B., 2019, @doi [ ] 10.1093/mnras/stz2251 , https://ui.adsabs.harvard.edu/abs/2019MNRAS.489.1805H 489, 1805
2019 doi
-
[31]
Hernquist L., 1990, @doi [ ] 10.1086/168845 , https://ui.adsabs.harvard.edu/abs/1990ApJ...356..359H 356, 359
1990 doi
-
[32]
F., Cox T
Hopkins P. F., Cox T. J., Younger J. D., Hernquist L., 2009, @doi [ ] 10.1088/0004-637X/691/2/1168 , http://adsabs.harvard.edu/abs/2009ApJ...691.1168H 691, 1168
2009 doi
-
[33]
Huang K.-H., et al., 2017, @doi [ ] 10.3847/1538-4357/aa62a6 , https://ui.adsabs.harvard.edu/abs/2017ApJ...838....6H 838, 6
2017 doi
-
[34]
K., Cranmer M., Melchior P., Ho S., Somerville R
Jespersen C. K., Cranmer M., Melchior P., Ho S., Somerville R. S., Gabrielpillai A., 2022, @doi [ ] 10.3847/1538-4357/ac9b18 , https://ui.adsabs.harvard.edu/abs/2022ApJ...941....7J 941, 7
2022 doi
-
[35]
Jiang F., et al., 2019, @doi [ ] 10.1093/mnras/stz1952 , https://ui.adsabs.harvard.edu/abs/2019MNRAS.488.4801J 488, 4801
2019 doi
-
[36]
S., 2023, @doi [ ] 10.1093/mnras/stad178 , https://ui.adsabs.harvard.edu/abs/2023MNRAS.520.1630K 520, 1630
Karmakar T., Genel S., Somerville R. S., 2023, @doi [ ] 10.1093/mnras/stad178 , https://ui.adsabs.harvard.edu/abs/2023MNRAS.520.1630K 520, 1630
2023 doi
-
[37]
V., 2013, @doi [ ] 10.1088/2041-8205/764/2/L31 , http://adsabs.harvard.edu/abs/2013ApJ...764L..31K 764, L31
Kravtsov A. V., 2013, @doi [ ] 10.1088/2041-8205/764/2/L31 , http://adsabs.harvard.edu/abs/2013ApJ...764L..31K 764, L31
2013 doi
-
[38]
Lange R., et al., 2015, @doi [ ] 10.1093/mnras/stu2467 , http://adsabs.harvard.edu/abs/2015MNRAS.447.2603L 447, 2603
2015 doi
-
[39]
Marinacci F., et al., 2018, @doi [ ] 10.1093/mnras/sty2206 , https://ui.adsabs.harvard.edu/abs/2018MNRAS.480.5113M 480, 5113
2018 doi
-
[40]
Meert A., Vikram V., Bernardi M., 2015, @doi [ ] 10.1093/mnras/stu2333 , https://ui.adsabs.harvard.edu/abs/2015MNRAS.446.3943M 446, 3943
2015 doi
-
[41]
J., Mao S., White S
Mo H. J., Mao S., White S. D. M., 1998, @doi [ ] 10.1046/j.1365-8711.1998.01227.x , https://ui.adsabs.harvard.edu/abs/1998MNRAS.295..319M 295, 319
1998
-
[42]
Morishita T., et al., 2024, @doi [ ] 10.3847/1538-4357/ad1404 , https://ui.adsabs.harvard.edu/abs/2024ApJ...963....9M 963, 9
2024 doi
-
[43]
P., Somerville R
Moster B. P., Somerville R. S., Maulbetsch C., van den Bosch F. C., Macci \`o A. V., Naab T., Oser L., 2010, @doi [ ] 10.1088/0004-637X/710/2/903 , http://adsabs.harvard.edu/abs/2010ApJ...710..903M 710, 903
2010 doi
-
[44]
P., Naab T., White S
Moster B. P., Naab T., White S. D. M., 2013, @doi [ ] 10.1093/mnras/sts261 , http://adsabs.harvard.edu/abs/2013MNRAS.428.3121M 428, 3121
2013 doi
-
[45]
H., Ostriker J
Naab T., Johansson P. H., Ostriker J. P., 2009, , http://adsabs.harvard.edu/abs/2009ApJ...699L.178N 699, 178
2009
-
[46]
P., et al., 2018, @doi [ ] 10.1093/mnras/sty618 , https://ui.adsabs.harvard.edu/abs/2018MNRAS.477.1206N 477, 1206
Naiman J. P., et al., 2018, @doi [ ] 10.1093/mnras/sty618 , https://ui.adsabs.harvard.edu/abs/2018MNRAS.477.1206N 477, 1206
2018 doi
-
[47]
F., Frenk C
Navarro J. F., Frenk C. S., White S. D. M., 1997, , 490, 493
1997
-
[48]
Nelson D., et al., 2018, @doi [ ] 10.1093/mnras/stx3040 , https://ui.adsabs.harvard.edu/abs/2018MNRAS.475..624N 475, 624
2018 doi
-
[49]
Nelson D., et al., 2019a, @doi [Computational Astrophysics and Cosmology] 10.1186/s40668-019-0028-x , https://ui.adsabs.harvard.edu/abs/2019ComAC...6....2N 6, 2
-
[50]
Nelson D., et al., 2019b, @doi [ ] 10.1093/mnras/stz2306 , https://ui.adsabs.harvard.edu/abs/2019MNRAS.490.3234N 490, 3234
-
[51]
P., Naab T., Johansson P
Oser L., Ostriker J. P., Naab T., Johansson P. H., Burkert A., 2010, @doi [ ] 10.1088/0004-637X/725/2/2312 , https://ui.adsabs.harvard.edu/abs/2010ApJ...725.2312O 725, 2312
2010 doi
-
[52]
Peebles P. J. E., 1969, , http://adsabs.harvard.edu/cgi-bin/nph-bib_query?bibcode=1969ApJ...155..393P&db_key=AST 155, 393
1969
-
[53]
Pillepich A., et al., 2018, @doi [ ] 10.1093/mnras/stx2656 , https://ui.adsabs.harvard.edu/abs/2018MNRAS.473.4077P 473, 4077
2018 doi
-
[54]
Pillepich A., et al., 2019, @doi [ ] 10.1093/mnras/stz2338 , https://ui.adsabs.harvard.edu/abs/2019MNRAS.490.3196P 490, 3196
2019 doi
-
[55]
A., Somerville R
Porter L. A., Somerville R. S., Primack J. R., Johansson P. H., 2014, @doi [ ] 10.1093/mnras/stu1434 , http://adsabs.harvard.edu/abs/2014MNRAS.444..942P 444, 942
2014 doi
-
[56]
Ravindranath S., et al., 2004, , http://adsabs.harvard.edu/cgi-bin/nph-bib_query?bibcode=2004ApJ...604L...9R&db_key=AST 604, L9
2004
-
[57]
V., Navarro J
Sales L. V., Navarro J. F., Schaye J., Dalla Vecchia C., Springel V., Haas M. R., Helmi A., 2009, @doi [ ] 10.1111/j.1745-3933.2009.00725.x , http://adsabs.harvard.edu/abs/2009MNRAS.399L..64S 399, L64
2009
-
[58]
Shen S., et al., 2003, , http://adsabs.harvard.edu/cgi-bin/nph-bib_query?bibcode=2003MNRAS.343..978S&db_key=AST 343, 978
2003
-
[59]
Shibuya T., Ouchi M., Harikane Y., 2015, @doi [ ] 10.1088/0067-0049/219/2/15 , https://ui.adsabs.harvard.edu/abs/2015ApJS..219...15S 219, 15
2015 doi
-
[60]
S., et al., 2018, @doi [ ] 10.1093/mnras/stx2040 , https://ui.adsabs.harvard.edu/abs/2018MNRAS.473.2714S 473, 2714
Somerville R. S., et al., 2018, @doi [ ] 10.1093/mnras/stx2040 , https://ui.adsabs.harvard.edu/abs/2018MNRAS.473.2714S 473, 2714
2018 doi
-
[61]
Springel V., 2010, @doi [ ] 10.1111/j.1365-2966.2009.15715.x , https://ui.adsabs.harvard.edu/abs/2010MNRAS.401..791S 401, 791
2010
-
[62]
Springel V., Hernquist L., 2003, @doi [ ] 10.1046/j.1365-8711.2003.06206.x , https://ui.adsabs.harvard.edu/abs/2003MNRAS.339..289S 339, 289
2003
-
[63]
Springel V., White S. D. M., Tormen G., Kauffmann G., 2001, @doi [ ] 10.1046/j.1365-8711.2001.04912.x , https://ui.adsabs.harvard.edu/abs/2001MNRAS.328..726S 328, 726
2001
-
[64]
Springel V., et al., 2018, @doi [ ] 10.1093/mnras/stx3304 , https://ui.adsabs.harvard.edu/abs/2018MNRAS.475..676S 475, 676
2018 doi
-
[65]
F., Remus R.-S., Dolag K., Beck A
Teklu A. F., Remus R.-S., Dolag K., Beck A. M., Burkert A., Schmidt A. S., Schulze F., Steinborn L. K., 2015, @doi [ ] 10.1088/0004-637X/812/1/29 , 812, 29
2015 doi
-
[66]
V., White S
\"U bler H., Naab T., Oser L., Aumer M., Sales L. V., White S. D. M., 2014, @doi [ ] 10.1093/mnras/stu1275 , http://adsabs.harvard.edu/abs/2014MNRAS.443.2092U 443, 2092
2014 doi
-
[67]
Vogelsberger M., et al., 2014a, @doi [ ] 10.1093/mnras/stu1536 , https://ui.adsabs.harvard.edu/abs/2014MNRAS.444.1518V 444, 1518
-
[68]
Vogelsberger M., et al., 2014b, @doi [ ] 10.1038/nature13316 , https://ui.adsabs.harvard.edu/abs/2014Natur.509..177V 509, 177
-
[69]
Weinberger R., et al., 2017, @doi [ ] 10.1093/mnras/stw2944 , https://ui.adsabs.harvard.edu/abs/2017MNRAS.465.3291W 465, 3291
2017 doi
-
[70]
White S. D. M., Rees M. J., 1978, @doi [ ] 10.1093/mnras/183.3.341 , https://ui.adsabs.harvard.edu/abs/1978MNRAS.183..341W 183, 341
1978 doi
-
[71]
S., Grand R
Yang H., Gao L., Frenk C. S., Grand R. J. J., Guo Q., Liao S., Shao S., 2023, @doi [ ] 10.1093/mnras/stac3335 , https://ui.adsabs.harvard.edu/abs/2023MNRAS.518.5253Y 518, 5253
2023 doi
-
[72]
Zavala J., et al., 2016, @doi [ ] 10.1093/mnras/stw1286 , http://adsabs.harvard.edu/abs/2016MNRAS.460.4466Z 460, 4466
2016 doi
-
[73]
Zjupa J., Springel V., 2017, @doi [ ] 10.1093/mnras/stw2945 , http://adsabs.harvard.edu/abs/2017MNRAS.466.1625Z 466, 1625
2017 doi
-
[74]
van der Wel A., et al., 2014, @doi [ ] 10.1088/0004-637X/788/1/28 , http://adsabs.harvard.edu/abs/2014ApJ...788...28V 788, 28
2014 doi
-
[75]
write newline
" write newline "" before.all 'output.state := FUNCTION fin.entry write newline FUNCTION new.block output.state before.all = 'skip after.block 'output.state := if FUNCTION new.sentence output.state after.block = 'skip output.state before.all = 'skip after.sentence 'output.stat...
Reviewed August 9, 2026 · model on record in the stance chip above.
Discussion (0). Continue with ORCID to comment.