REVIEW 3 major objections 5 minor 1 cited by
StarMAP: Global Neighbor Embedding for Faithful Data Visualization
T0 review · 3 major / 5 minor · reviewed 2026-08-09 · deepseek-v4-flash
Pith's one-line read StarMAP shows that adding fixed PCA-embedded anchor points to UMAP preserves both global and local structure in one visualization.
desk verdict StarMAP is a plausible UMAP variant with a new star-attraction mechanism, but the paper never isolates that mechanism from the PCA initialization — still worth peer review. read the letter →
The pith
A machine-rendered reading of the paper's core claim, the machinery that carries it, and where it could break.
The reading
What carries the argument
The central object is the star attraction force, defined for each point $y_i$ as $S_i = -\frac{2ab\,\lVert y_i - s_{m(i)}\rVert_2^{2(b-1)}}{1 + a\lVert y_i - s_{m(i)}\rVert_2^{2b}}\, d_i\, (y_i - s_{m(i)})$, where $s_{m(i)}$ is the fixed PCA embedding of the K-means anchor assigned to point $i$ and $d_i$ is the degree of $i$ in the kNN graph. It is the mechanism that carries the argument: it injects the PCA-determined global layout into every gradient step, so the final embedding remains anchored to the global structure while UMAP's neighbor attraction and repulsion continue to organize local neighborhoods.
What would settle it
On a hierarchical dataset with known ground truth, sweep $\lambda$ from 0 (StarMAP reduced to UMAP with PCA initialization) to 1 (star attraction only) and record the distance-correlation score; if the global score does not increase with $\lambda$, then star attraction itself is not what preserves global structure, and the paper's central mechanism is not doing the claimed work.
Extended reading notes
Core claim
StarMAP's central claim is that the global structure lost by neighbor embedding can be restored by a star attraction force, not by a better initialization alone. The method runs K-means on the data to obtain $C$ anchor points, computes a joint PCA embedding of the data points and the anchors, and keeps the anchor images (the stars) fixed during UMAP-style optimization. Each data point is pulled toward its assigned star by a force $S_i$ that has the same functional form as UMAP's neighbor attraction but is scaled by the node's degree, and the per-step update becomes $y_i \leftarrow y_i + \lambda S_i + (1-\lambda)A_i + R_i$, with $\lambda$ balancing global and local attraction. Because the stars are fixed, the optimization cannot drift away from the PCA-defined global layout, while the original attraction and repulsion terms still form local clusters. The paper argues that PCA embedding is the 'largest shadow' of the data and therefore the most accurate global view, so anchoring to PCA stars preserves intercluster similarities that t-SNE, UMAP, and PaCMAP either miss or preserve only through fragile initialization.
Load-bearing premise
StarMAP assumes that a two-dimensional PCA embedding of the data and its K-means centers is a reliable map of the data's global structure, so when the first two principal components smear meaningful groups together, as they do for MNIST, the stars pull the embedding along a misleading global layout.
Editorial extensions
If this is right
- In any dataset where intercluster relationships matter—cell type lineages, semantic hierarchies, learned representation structure—StarMAP should produce a single embedding that shows both the big picture and the clusters, something the paper demonstrates on the Neocortex and Planaria scRNA-seq datasets.
- Because the added cost is just one K-means pass and the complexity stays at UMAP's $O(N^{1.14})$, global structure preservation does not require expensive diffusion operators or triplet sampling; the paper's heuristic setting $C=\min(N/500,100)$ runs in roughly 20-25% more time than UMAP.
- Visualizing CLIP image features with StarMAP keeps semantic coherence along interpretable axes, such as gradations between related classes, which the paper shows UMAP with PCA initialization does not do as clearly.
- The method's known failure mode is when the first two principal components overlap meaningful clusters, as on MNIST; in that regime the paper recommends tuning the anchor count $C$, which can recover better distance correlation at some cost in local accuracy.
Reading between the lines
- Because star attraction is scaled by kNN degree, points that are hubs in the local graph are pulled harder toward their stars; a testable extension would weight the star force by local density or inverse degree to see whether density-heterogeneous data become more stable.
- The recipe is not tied to PCA: any global reference embedding that is cheap to compute, such as a spectral or diffusion-map layout, could supply the fixed stars, which would let the same mechanism preserve whichever large-scale structure the reference captures.
- A practical pre-check suggested by the MNIST result is to measure the variance explained by the first two principal components before running StarMAP; low values would predict the overlapping-cluster failure and indicate that a higher-dimensional PCA initialization or more anchors is needed.
Editorial analysis
A structured set of objections, weighed in public.
Referee Report
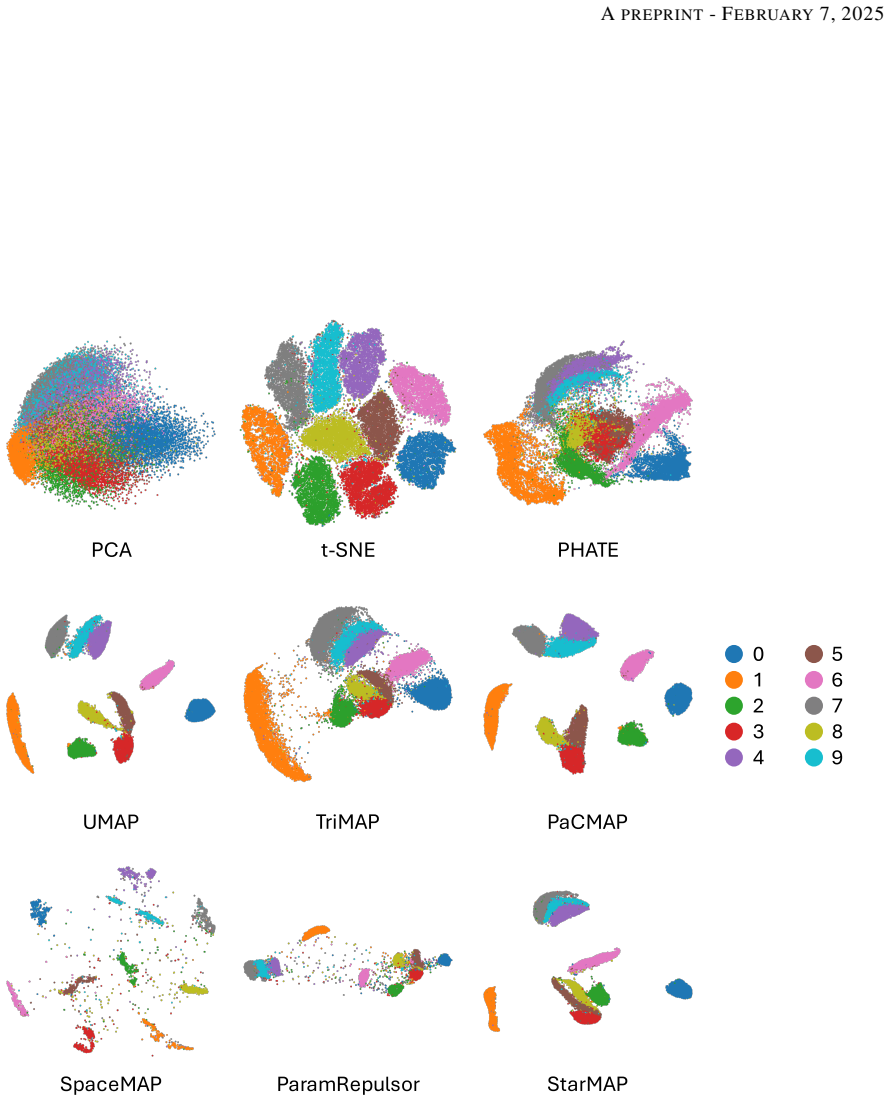
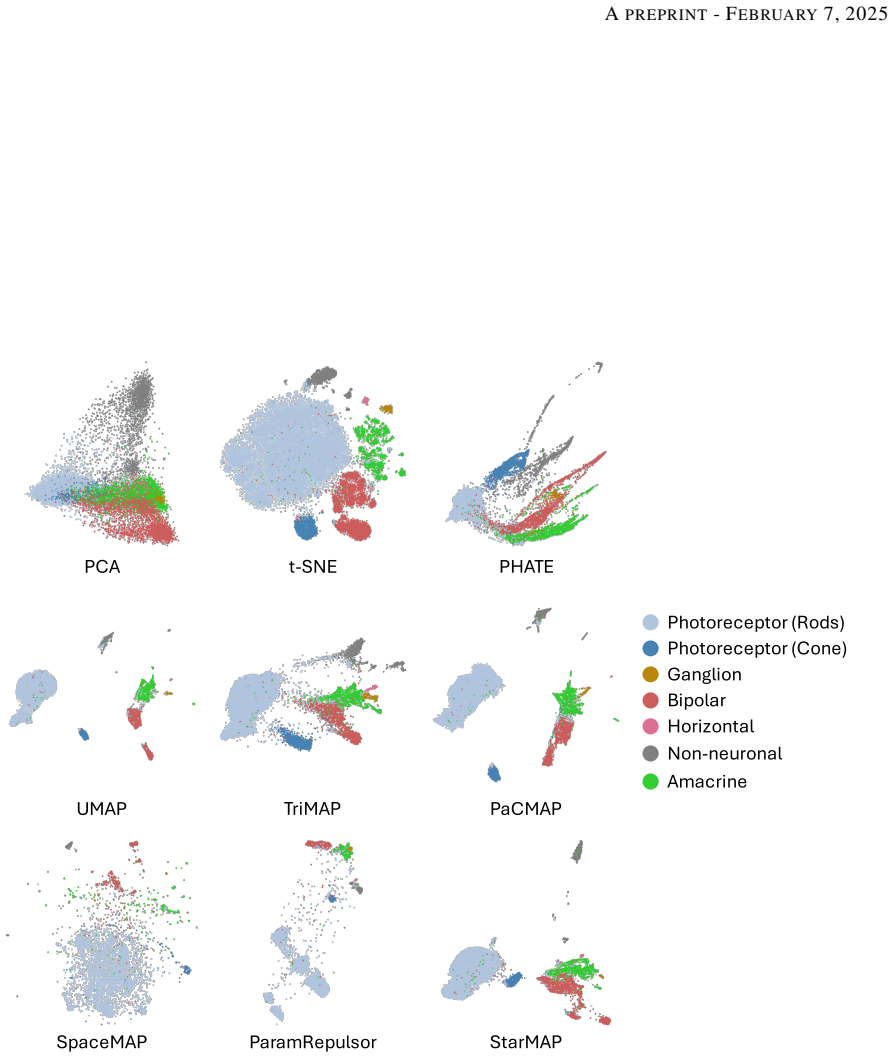
Summary. The paper proposes StarMAP, a UMAP variant that adds "star attraction" toward fixed PCA-embedded K-means anchor points, intending to preserve both global and local structure in two-dimensional embeddings. The method is described clearly: K-means clustering defines anchors, PCA of the augmented data gives both the initialization and the fixed star positions, and optimization combines the UMAP attraction/repulsion forces with a star-attraction term (Eq. 8). Experiments on synthetic hierarchical data, six real-world datasets (Mammoth, MNIST, FashionMNIST, Retina, Neocortex, Planaria), and CLIP representations of CIFAR-100 compare StarMAP against PCA, t-SNE, UMAP, PHATE, PaCMAP, and, in appendices, TriMAP, SpaceMAP, and ParamRepulsor, using kNN accuracy (local) and distance correlation (global). The paper claims that StarMAP alone simultaneously preserves global intercluster relationships and local cluster structure, and that this is due to the star-attraction mechanism.
Significance. If the central claim holds, StarMAP would be a simple, efficient, and practically useful contribution: it adds only one hyperparameter (C) and a fixed attraction term to UMAP, and the reported visuals show plausible gains on several benchmarks. The paper is honest about known limitations (MNIST failure, C sensitivity) and includes a heuristic version in Appendix C.3. The strongest strengths are the clarity of the method description, the synthetic-data demonstration of the effect of C, and the inclusion of error bars over 10 runs. The main weakness is that the causal claim — that the K-means star mechanism itself, rather than merely a generic 'stay near PCA initialization' effect, yields the global-structure gains — is not tested by any ablation. Since the global metric (distance correlation) heavily favors PCA by construction, the evidence as presented does not isolate the proposed mechanism. The manuscript is publishable in principle, but the load-bearing attribution of the effect to star attraction needs a dedicated control experiment.
major comments (3)
- [§4.3, Eq. (8), and §5.1] The central claim that star attraction preserves global structure is not isolated from the PCA initialization. StarMAP initializes from the PCA embedding of the augmented data (§4.2) and then adds the star force to keep points near the PCA-embedded anchors. The comparison in §5.1 only pits StarMAP against unconstrained UMAP with PCA initialization, which is free to drift. A fair causal test requires an ablation that keeps UMAP near its PCA initialization without any K-means anchors, e.g., an L2 penalty on the PCA-initialized coordinates with the same λ. The paper's own Appendix C.2 reports that on Cortex and Planaria the stars are not assigned to the visible clusters, yet StarMAP still preserves lineage; this is consistent with the possibility that the gain comes from initialization plus a generic 'stay near PCA' penalty, not from the anchor-specific attraction presented as the innovation.
- [§5.2 and §6] The anchor count C is manually tuned per dataset (C = 60, 12, 15, 150, 100, 200 for the six datasets), and §5.1 shows that different C values produce qualitatively different visualizations. The paper acknowledges in §6 that no clear criterion for C is given. This makes the reported quantitative results best-case per dataset rather than the behavior of a single method with fixed hyperparameters. The manuscript should report results for a fixed, pre-specified rule (e.g., the heuristic C = min(N/500, 100) from Appendix C.3) in the main comparison, and clearly separate the manually tuned results as an upper-bound analysis. Without this, the claim in §5.2 that StarMAP 'consistently obtained relatively high scores' is not yet established.
- [§5.2 and Figure 6] No significance tests are reported. Statements such as 'StarMAP consistently obtained relatively high scores across both metrics on the Mammoth, Fashion MNIST, and scRNA-seq datasets' are supported only by overlapping error bars in Figure 6. Given that several pairwise differences appear visually small, paired tests (e.g., Wilcoxon signed-rank over the 10 runs) or an explicit statement of which differences are larger than the error-bar spread are needed to support the comparative claims.
minor comments (5)
- [§4.1] The word 'difined' should be 'defined'.
- [§4.3, Eq. (7)] The degree d_i in Eq. (7) is used but not defined in the main text; define it as the sum of the weights w_ij over the neighborhood, or refer explicitly to the appendix where it is discussed.
- [§4.3] The sentence 'StarMAP can be considered a neighbor embedding method that operates within the PCA subspace' is vague; the embedding is initialized and attracted toward PCA points but is not constrained to the PCA subspace, so clarify what 'operates within' means.
- [Appendix C.3] The heuristic C = min(N/500, 100) would give C = 40 for Mammoth and C = 100 for MNIST, which differ from the manual values in §5.2; the relationship between the heuristic rule and the dataset-specific manual settings should be discussed explicitly.
- [Figure 9 caption] The caption says 'Quantitaive (left) and qualitative results (left)'; the second 'left' should be 'right'.
Circularity Check
No significant circularity: StarMAP's global-structure behavior is designed into the method, but the paper validates it on external datasets and standard metrics rather than deriving it from its own assumptions.
full rationale
The paper's central claim is that star attraction toward PCA-projected K-means anchors preserves global structure while UMAP-style forces preserve local structure. This is a design rationale, not a circular derivation: the global evaluation metric (distance correlation) is not the training objective, and the stars are not defined in terms of that metric. The PCA initialization and star positions are computed from the input data, but the paper compares against UMAP with PCA initialization, t-SNE, PHATE, PaCMAP, TriMAP, SpaceMAP, and ParamRepulsor on six external datasets plus a CLIP representation, so the empirical evaluation is self-contained and not forced by construction. The acknowledged limitation on MNIST, where the first two principal components overlap digit clusters and StarMAP degrades, and Appendix C.2, where stars are not assigned to visible clusters on Cortex and Planaria yet StarMAP still preserves lineage, show that the mechanism is not tautological. The skeptical concern that global gains may be inherited from PCA initialization rather than the K-means star mechanism is an experimental-ablation critique, not a circularity: the paper does not fit a parameter to the evaluation metric and then report that fit as a prediction. No load-bearing self-citation, imported uniqueness theorem, or ansatz-by-citation appears. The derivation chain from UMAP forces to the StarMAP update rule is explicit and self-contained.
Assumptions & free parameters
free parameters (2)
- C, number of anchor points =
C = 60, 12, 15, 150, 100, 200 for Mammoth, MNIST, FashionMNIST, Retina, Cortex, Planaria
- lambda, star attraction weight =
0.1
assumptions (4)
- domain assumption PCA embedding is the most accurate visualization of the global structure of the data
- domain assumption K-means centers in high-dimensional space, projected by PCA, form meaningful global anchors
- standard math UMAP's attraction-repulsion equations and default hyperparameters correctly model local neighborhood preservation
- domain assumption Distance correlation and kNN accuracy are valid proxies for global and local embedding faithfulness
invented entities (1)
-
Stars, fixed PCA-embedded K-means anchor points
Cite this review
Pith. "Pith review of StarMAP: Global Neighbor Embedding for Faithful Data Visualization." pith.science (2026). https://pith.science/paper/KMDVMAIR
@misc{pith2026250203776,
  author       = {Pith},
  title        = {Pith review of: StarMAP: Global Neighbor Embedding for Faithful Data Visualization},
  year         = {2026},
  howpublished = {\url{https://pith.science/paper/KMDVMAIR}},
  note         = {Machine review of arXiv:2502.03776}
}
read the original abstract
Neighbor embedding is widely employed to visualize high-dimensional data; however, it frequently overlooks the global structure, e.g., intercluster similarities, thereby impeding accurate visualization. To address this problem, this paper presents Star-attracted Manifold Approximation and Projection (StarMAP), which incorporates the advantage of principal component analysis (PCA) in neighbor embedding. Inspired by the property of PCA embedding, which can be viewed as the largest shadow of the data, StarMAP introduces the concept of \textit{star attraction} by leveraging the PCA embedding. This approach yields faithful global structure preservation while maintaining the interpretability and computational efficiency of neighbor embedding. StarMAP was compared with existing methods in the visualization tasks of toy datasets, single-cell RNA sequencing data, and deep representation. The experimental results show that StarMAP is simple but effective in realizing faithful visualizations.
Figures


Figures from the paper (15 more)





Forward citations
Cited by 1 Pith paper
-
mlx-vis: GPU-Native Dimensionality Reduction on Apple Silicon
mlx-vis is a pure-MLX library that runs eight dimensionality-reduction methods and k-NN construction on Apple Silicon GPUs, claiming 3–13x speedups over CPU packages.
Reference graph
Works this paper leans on
-
[1]
Amid, E. and Warmuth, M. K. TriMap: Large-scale dimensionality reduction using triplets. arXiv preprint arXiv:1910.00204,
arXiv 1910
-
[9]
Fashion-MNIST: a novel image dataset for benchmarking machine learning algorithms
Xiao, H., Rasul, K., and V ollgraf, R. Fashion-MNIST: a novel image dataset for benchmarking machine learning algorithms. arXiv preprint arXiv:1708.07747,
-
[10]
Appendix A presents the attraction and repulsion computations used in this study
11 A PREPRINT - FEBRUARY 7, 2025 Appendix Summary This appendix presents a more detailed description of our method and the experimental results, which were omitted from the main text due to space limitations. Appendix A presents the attraction and repulsion computations used in this study. Although the resulting attraction force differs from that of the o...
work page 2025
-
[13]
PHATE estimates the multihop neighbor relation, which enables neighbor-based global preservation
and multi- dimensional scaling (Torgerson, 1958). PHATE estimates the multihop neighbor relation, which enables neighbor-based global preservation. In this study, we used the implementation provided by the original paper. IV . UMAP (McInnes et al., 2018). UMAP is also a widely used neighbor embedding method that is generally faster than t-SNE. Here, we us...
work page 1958
-
[1992]
UMAP: Uniform manifold approximation and projection for dimension reduction
McInnes, L., Healy, J., and Melville, J. UMAP: Uniform manifold approximation and projection for dimension reduction. arXiv preprint arXiv:1802.03426,
-
[2000]
A., Ayoub, S., Misios, A., Glažar, P., Obermayer, B., Theis, F
10 A PREPRINT - FEBRUARY 7, 2025 Plass, M., Solana, J., Wolf, F. A., Ayoub, S., Misios, A., Glažar, P., Obermayer, B., Theis, F. J., Kocks, C., and Rajewsky, N. Cell type atlas and lineage tree of a whole complex animal by single-cell transcriptomics. Science, 360(6391): eaaq1723,
work page 2025
-
[2006]
Damrich, S., Böhm, J. N., Hamprecht, F. A., and Kobak, D. From t-SNE to UMAP with contrastive learning. arXiv preprint arXiv:2206.01816,
-
[2008]
Van Der Maaten, L. and Weinberger, K. Stochastic triplet embedding. In 2012 IEEE International Workshop on Machine Learning for Signal Processing, pp. 1–6. IEEE,
work page 2012
Show all 13 references
-
[2011]
of PCA. II. t-SNE (Van Der Maaten & Weinberger, 2012). t-SNE is a gold standard method for data visualization. Note that the original t-SNE algorithm is slow and does not scale data with N >10, 000; thus, in this study, we employed the Barnes-Hut approximation method (Van Der Maaten,
2012
-
[2014]
13 A PREPRINT - FEBRUARY 7, 2025 Figure 9: Quantitaive (left) and qualitative results (left) for the MNIST dataset with different StarMAP settings
in the scikit-learn library (Pedregosa et al., 2011). 13 A PREPRINT - FEBRUARY 7, 2025 Figure 9: Quantitaive (left) and qualitative results (left) for the MNIST dataset with different StarMAP settings. III. PHATE (Moon et al., 2019). PHATE is based on diffusion maps (Coifman & Lafon,
2011
-
[2019]
and Panov, M
9 A PREPRINT - FEBRUARY 7, 2025 Artemenkov, A. and Panov, M. Ncvis: noise contrastive approach for scalable visualization. In Proceedings of the International Conference on World Wide Web, pp. 2941–2947,
2025
-
[2021]
Hierarchical text-conditional image generation with CLIP latents
Ramesh, A., Dhariwal, P., Nichol, A., Chu, C., and Chen, M. Hierarchical text-conditional image generation with CLIP latents. arXiv preprint arXiv:2204.06125,
-
[2022]
EV A-CLIP: Improved training techniques for CLIP at scale.arXiv preprint arXiv:2303.15389,
Sun, Q., Fang, Y ., Wu, L., Wang, X., and Cao, Y . EV A-CLIP: Improved training techniques for CLIP at scale.arXiv preprint arXiv:2303.15389,
Reviewed August 9, 2026 · model on record in the stance chip above.
Discussion (0). Continue with ORCID to comment.