REVIEW 4 major objections 5 minor 37 references
High-resolution Observation of Mini-Filament Eruptions Near Coronal Hole Boundary and Their Response in Solar Corona
T0 review · 4 major / 5 minor · reviewed 2026-08-08 · deepseek-v4-flash
Pith's one-line read Observing 28 mini-filament eruptions at a coronal hole boundary, this study finds the three largest drove coronal ejections while the rest brightened overlying coronal bright points, evidence that tiny eruptions feed mass and magnetic…
desk verdict Careful high-resolution study of the smallest mini-filament eruptions to date; the qualitative findings are credible, but the quantitative correlation and budget numbers need more rigor before they can carry the solar-wind claim. read the letter →
The pith
A machine-rendered reading of the paper's core claim, the machinery that carries it, and where it could break.
The reading
What carries the argument
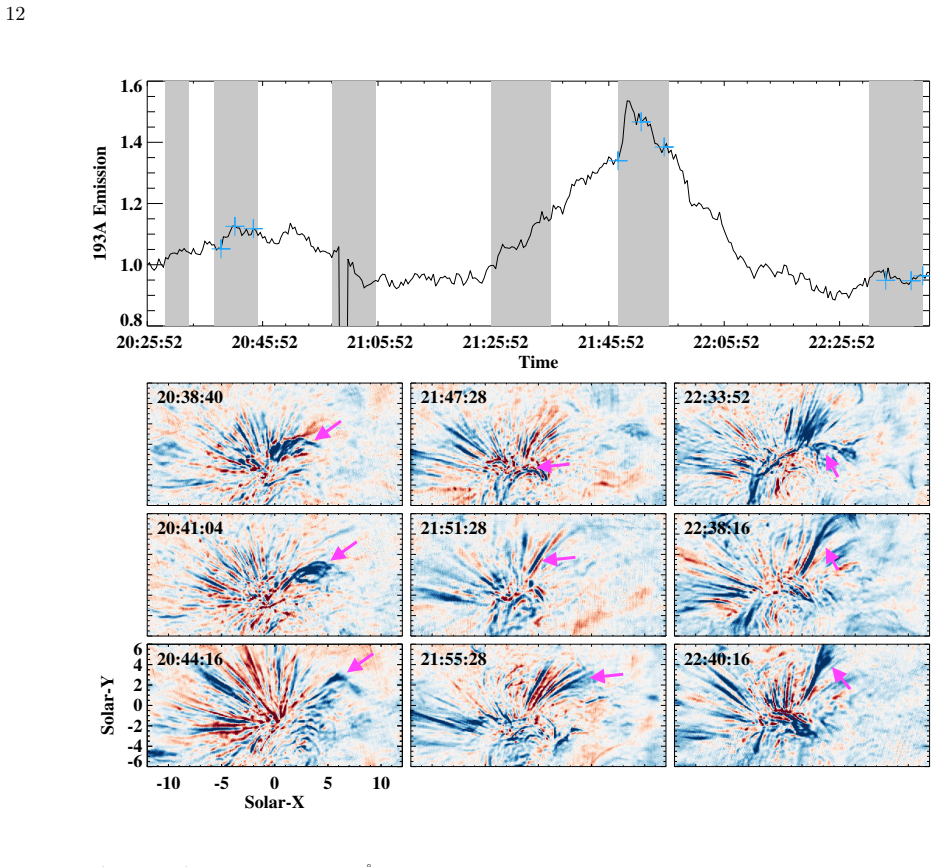
The carrying observational tool is the co-aligned pair of high-cadence Hα pseudo-Dopplergrams and EUV 193 Å difference images. Pseudo-Dopplergrams pick out mini-filaments as small Doppler-shifted features and fix their eruption time and location; the EUV difference images then reveal the coronal response. The quantitative link is a scatter plot of mini-filament length versus integrated EUV contrast (arcsec·s), giving a correlation coefficient of 0.65 after removing one outlier, plus magnetograms that show flux emergence followed by cancellation at the footpoints of the two largest events.
What would settle it
A targeted campaign with simultaneous high-cadence (about 10 s) Hα and EUV imaging of a coronal-hole boundary would settle it: if most visually identified mini-filament eruptions produced no localized 193 Å brightening once the cadence and sensitivity are improved, the claimed one-to-one correspondence would fail. A simpler check is to test whether coronal bright point brightenings ever start before the Hα eruption or occur with no mini-filament at all.
Extended reading notes
Core claim
The central discovery is that even the smallest chromospheric eruptions—mini-filaments spanning roughly 4–13 arcseconds—have a detectable coronal counterpart when observed with high-resolution Hα data and EUV difference imaging. The three largest events produced clear coronal consequences: two consecutive eruptions launched a small-scale blow-out ejection, and a triple eruption produced a jet-like brightening. The remaining 25 events, which showed no obvious ejection, were still accompanied by transient brightenings in overlying coronal bright points, with brightening onset locked to eruption time. The paper reads this as evidence that mini-filament eruptions are a genuine, quantifiable pathway for mass and magnetic flux into the corona near coronal holes, with the largest events potentially feeding small-scale magnetic flux ropes in the solar wind.
Load-bearing premise
The chain rests on the assumption that the EUV brightenings are actually caused by the preceding mini-filament eruptions and not just coincidental fluctuations in the dynamic coronal-hole background; the paper establishes this only by timing and spatial coincidence.
Editorial extensions
If this is right
- Mini-filament eruptions occur at a global rate of roughly 1.1 × 10^4 per day, making them more numerous than X-ray jets and comparable to jetlets, so they form a significant population of coronal transients.
- The estimated energy input from mini-filament eruptions, about 10^29 erg per day, is comparable to the total energy requirement of coronal bright points, though far below the overall coronal heating requirement.
- The estimated mass input, about 10^16 g per day, greatly exceeds the solar wind mass loss rate of about 10^14 g per day, though only a fraction of that mass is released into open field lines.
- Only the larger mini-filament eruptions—those producing visible coronal ejections—are plausible sources of small-scale magnetic flux ropes in the solar wind, while smaller eruptions mainly heat local coronal bright points.
- The measured size–brightness correlation means mini-filament length can serve as a proxy for coronal response strength in future surveys.
Reading between the lines
- If the mini-filament–coronal bright point association is causal, then the high global rate implies the chromosphere is continuously injecting small energy pulses into coronal holes, which could matter for models of coronal hole heating and solar wind seed populations even though each event is tiny.
- The 0.65 correlation rests on only 28 events with one outlier removed; a larger sample could either confirm the trend or show that it is driven entirely by the few largest events, which would change the physical interpretation from a general size rule to a threshold effect.
- The energy and mass extrapolations assume that a single previously studied mini-filament is representative; high-resolution spectroscopy of many events is needed to test whether thermal and kinetic energies actually scale linearly with filament size.
- The paper’s own caveat leaves open that smaller mini-filament eruptions may drive coronal ejections that current EUV sensitivity misses; higher-sensitivity observations would likely push the estimated contribution to the solar wind upward.
Editorial analysis
A structured set of objections, weighed in public.
Referee Report
Summary. The paper reports high-resolution Hα observations from BBSO/GST VIS and SDO/AIA 193 Å of 28 mini-filament eruptions near coronal hole boundaries over about 7.5 hours of useful data across five days. Three larger MFEs are presented as the sources of two small-scale coronal ejections, one classified as eruptive and one as jet-like, while the 25 smaller MFEs are claimed to be associated with localized brightenings in coronal bright points. The paper further reports a moderate positive correlation between MFE length and integrated EUV contrast, an association with magnetic flux cancellation in the two large events, and extrapolated global occurrence, energy, and mass-input rates for MFEs. The central claim is that MFEs transfer significant mass and magnetic flux to the corona and, for the largest events, may contribute to solar wind structures such as small-scale magnetic flux ropes.
Significance. If the observational association between small MFEs and coronal brightenings is robust, the paper provides a useful high-resolution, multi-wavelength data set for a population of events that is otherwise difficult to observe. The detailed case studies of two consecutive MFEs and of the three-component jet-like event are valuable and physically suggestive, including the Doppler signatures of untwisting and the NIRIS magnetograms showing flux emergence and cancellation. The explicit comparison with the larger Huang et al. (2023) catalog and with PSP-era targeting is a constructive step toward connecting chromospheric events to solar wind structures. However, the quantitative support for the generalized claims is currently weak: the correlation analysis relies on post-hoc outlier removal without criteria, no uncertainties or significance tests accompany the EUV contrast and length measurements, and the energy/mass scaling rests on assumed values from one previously studied event. The qualitative case studies are sound but the paper's central generalization to all 28 events requires stronger statistical backing.
major comments (4)
- [Section 3.3] The claim that all 25 smaller MFEs were associated with localized CBP brightenings is established only by temporal and spatial coincidence, with no control sample, null-hypothesis test, or false-positive estimate. The paper itself notes in this section that the highly dynamic AIA 193 Å background, especially in coronal holes, complicates identification, so it is essential to demonstrate that the brightenings are not random fluctuations. Without this, the derived occurrence rate, the size-EUV contrast correlation in Figure 7, and the mass/energy input estimates in Section 4 lose their empirical foundation.
- [Section 3.3, Figure 7] The reported correlation coefficient r=0.65 is computed after excluding an 'obvious outliner' event, but no objective criterion for this exclusion is stated, no uncertainties on the individual length and EUV-contrast measurements are given, and no significance test or confidence interval for the correlation is provided. Since the abstract's 'certain trend' rests on this result, the analysis should be redone with a stated, reproducible outlier rule and with uncertainties propagated from the measurements.
- [Sections 3.1, 3.2, and 3.3] There is an internal tension about the coronal response of smaller MFEs: Section 3.1 states that smaller MFEs do not generate clear eruptive signatures in AIA 193 Å and Section 3.2 states that smaller MFEs generally exhibit no clear coronal response, whereas Section 3.3 states that all 25 smaller MFEs were accompanied by enhanced integrated 193 Å emission. The paper should reconcile these statements explicitly, for example by distinguishing 'no clear eruptive signature' from 'localized CBP brightening,' and by quantifying how many of the 25 events showed identifiable brightenings without prior knowledge of the MFE timing.
- [Section 4] The global occurrence rate, energy input, and mass input estimates are extrapolated from 7.5 hours within a 30''×30'' field of view to the entire solar surface, and the energy/mass scaling uses the single event from Wang et al. (2024) with an assumed average mass of 10^12 g per event. No uncertainties are attached to these extrapolations, and the assumptions of uniform solar-surface distribution and representative energy per event are not tested. Because the abstract and discussion present these numbers as evidence that MFEs play a significant role in mass and flux transfer, the estimates should be presented with explicit ranges and a statement of the dominant systematic uncertainties.
minor comments (5)
- [Figure 2 caption] There are several typographical errors in the caption, including 'reprensent' for 'represent' and 'magneta' for 'magenta,' and the caption would benefit from a consistent description of the coordinate axes.
- [Figure 3] The top-row y-axis is labeled only 'Magnetic Field' without units; the reader must infer that the values are in arbitrary or relative units, and specifying the unit and the integration area would improve interpretability.
- [Section 3.3] The paper mentions 'six such MFEs' for Figure 6 but does not explain how these six relate to the 25 smaller events or the full sample of 28; a sentence clarifying the selection for Figure 6 would prevent confusion.
- [Section 4] The comparison table (Table 2) lists occurrence rates from different instruments and detection criteria spanning several orders of magnitude; the paper should state this limitation directly in the text rather than only in the discussion of jetlet rates.
- [Throughout] The notation 'Hα−0.8 Å' should be consistently formatted (e.g., using a minus sign or en-dash) and the units of 'arcsec · s' for integrated EUV contrast should be defined in the text where the quantity is first introduced.
Circularity Check
Only mild self-citation circularity in ejection classification; core observational claims are independent measurements.
-
self citation load bearing
[Section 3.2, 'Case study of a Mini-filament Eruption as the Source of a Coronal Jet-like Event', paragraph 4; also Section 3 opening classification]
"The observational characteristics of this event align with our previous classification of jet-like brightenings, reinforcing that these coronal responses are often associated with multiple concurrent MFEs rather than singular large-scale filament eruptions. Importantly, only larger MFEs appear to produce these jet-like brightenings, while smaller MFEs generally exhibit no clear coronal response. This distinction further supports the classification in Huang et al. (2023), where only sufficiently energetic MFEs were found to drive observable coronal dynamics."
The event is categorized using the authors' own prior classification scheme: the paper states 'Following the classification scheme for coronal ejections outlined in Huang et al. (2023), one of these small-scale coronal ejections was categorized as an eruptive event per Huang et al. (2023),' and the ejections were 'identified using the algorithm described in Huang et al. (2023).' The same observation is then presented as 'further supporting' that classification. This is a self-referential validation: the category assigned to the event is defined by the very scheme the observation is claimed to reinforce, so the confirmation is partly circular. This weakness is mild and localized, however, because the main mass-transfer and brightening claims do not depend on the Huang et al.
full rationale
The central observational claims are not circular: the 28 MFE identifications, the AIA 193 Å brightening associations, the MFE length versus EUV contrast correlation (r = 0.65), and the occurrence-rate estimate are measurements/extrapolations with stated selection criteria, not quantities fitted to the conclusions. The energy and mass totals (∼10^29 erg/day, ∼10^16 g/day) are explicitly scaled from Wang et al. (2024) using a stated area-scaling assumption; they are approximations, not predictions, and the scaling assumption is acknowledged rather than hidden. The only identifiable circular feature is the self-citation of Huang et al. (2023) in the classification of the two small-scale coronal ejections: the events are classified with the authors' own algorithm and then said to 'further support' that same classification. This is a minor self-referential loop that does not bear on the paper's main finding that MFEs are temporally and spatially associated with localized coronal brightenings. The lack of a null-hypothesis control for the coincidence-based association is a correctness/statistical concern, not a circularity one, and is noted separately.
Assumptions & free parameters
free parameters (2)
- MFE energy scaling factor =
8/5 ≈ 1.6
- Assumed average MFE mass per event =
1e12 g
assumptions (5)
- domain assumption Uniform spatial distribution of MFEs across the solar surface.
- domain assumption Physical similarity of all observed MFEs to the single MFE analyzed by Wang et al. (2024).
- domain assumption Milne-Eddington approximation and weak-field assumption for NIRIS magnetogram inversion.
- domain assumption Visual identification and manual registration are reliable for MFE detection and co-alignment.
- domain assumption The AIA 193 Å brightenings are causally associated with the identified MFEs rather than background variability.
Cite this review
Pith. "Pith review of High-resolution Observation of Mini-Filament Eruptions Near Coronal Hole Boundary and Their Response in Solar Corona." pith.science (2026). https://pith.science/paper/VIM7UCHZ
@misc{pith2026250207666,
  author       = {Pith},
  title        = {Pith review of: High-resolution Observation of Mini-Filament Eruptions Near Coronal Hole Boundary and Their Response in Solar Corona},
  year         = {2026},
  howpublished = {\url{https://pith.science/paper/VIM7UCHZ}},
  note         = {Machine review of arXiv:2502.07666}
}
abstract
We investigated mini-filament (MF) eruptions near coronal hole (CH) boundaries to explore their role in coronal dynamics and their potential contributions to the solar wind. Using high-resolution H$\alpha$ images from the 1.6m Goode Solar Telescope at Big Bear Solar Observatory and EUV data from AIA 193 \AA~ from Solar Dynamic Observatory, we analyzed 28 MFE events over 7.5 hours of observation spanning 5 days. Three largest MF eruptions triggered distinct coronal responses: two consecutive MFEs produced a small-scale eruptive coronal ejection, while the other generated a jet-like brightening. Furthermore, the 25 smaller-scale MFEs were associated with localized brightenings in coronal bright points (CBPs). These findings suggest that MFs play a significant role in transferring mass and magnetic flux to the corona, particularly within CH regions. We found certain trend that the size of MFEs is correlated with the EUV emissions. In addition, we observed magnetic flux cancellation associated with MFEs. However, except for a few largest MFEs, quantitative analysis of magnetic field evolution is beyond the capability of the data. These results underscore the importance of MFEs in the dynamic coupling between the chromosphere and corona, highlighting their potential role in shaping heliospheric structures. Although current study covers smallest MFEs ever studied, future higher-cadence, more accurate magnetograms and multi-wavelength observations are essential to fully resolve the fine-scale dynamics of these ubiquitous solar phenomena.
Figures


Figures from the paper (4 more)



Reference graph
Works this paper leans on
-
[1]
1999, Solar Physics, 190, 167, doi: 10.1023/a:1005213826793
Alexander, D., & Fletcher, L. 1999, Solar Physics, 190, 167, doi: 10.1023/a:1005213826793
-
[2]
Berghmans, D., Auch` ere, F., Long, D. M., et al. 2021, Astronomy & Astrophysics, 656, L4, doi: 10.1051/0004-6361/202140380
-
[3]
2022, \apj, 924, 43, doi: 10.3847/1538-4357/ac3487
Chen, Y., & Hu, Q. 2022, \apj, 924, 43, doi: 10.3847/1538-4357/ac3487
-
[4]
Chen, Y., Hu, Q., Zhao, L., Kasper, J. C., & Huang, J. 2021, The Astrophysical Journal, 914, 108, doi: 10.3847/1538-4357/abfd30
-
[5]
E., Morooka, M., Renzaglia, A., et al
Cravens, T. E., Morooka, M., Renzaglia, A., et al. 2019, Journal of Geophysical Research: Space Physics, 124, 4881, doi: 10.1029/2018ja026344 De Pontieu, B., McIntosh, S. W., Hansteen, V. H., &
-
[6]
Schrijver, C. J. 2009, The Astrophysical Journal, 701, L1, doi: 10.1088/0004-637x/701/1/l1 De Pontieu, B., McIntosh, S. W., Carlsson, M., et al. 2011, Science, 331, 55, doi: 10.1126/science.1197738
-
[7]
Fisk, L. A., & Schwadron, N. A. 2001, The Astrophysical Journal, 560, 425, doi: 10.1086/322503
doi:10.1086/322503 2001
-
[8]
Vaiana, G. S. 1974, The Astrophysical Journal, 189, L93, doi: 10.1086/181472
doi:10.1086/181472 1974
Show all 37 references
-
[9]
Goodman, M. L. 2012, The Astrophysical Journal, 757, 188, doi: 10.1088/0004-637x/757/2/188
2012 doi
-
[10]
1988, Solar Physics, 116, doi: 10.1007/bf00171715
Harrison, R., Rompolt, B., & Garczynska, I. 1988, Solar Physics, 116, doi: 10.1007/bf00171715
1988 doi
-
[11]
2014, The Astrophysical Journal, 796, 73, doi: 10.1088/0004-637x/796/2/73 —
Hong, J., Jiang, Y., Yang, J., et al. 2014, The Astrophysical Journal, 796, 73, doi: 10.1088/0004-637x/796/2/73 —. 2016, The Astrophysical Journal, 830, 60, doi: 10.3847/0004-637x/830/2/60 15
2014 doi
-
[12]
2023, The Astrophysical Journal Letters, 946, L17, doi: 10.3847/2041-8213/acc0f1
Huang, N., D’Anna, S., & Wang, H. 2023, The Astrophysical Journal Letters, 946, L17, doi: 10.3847/2041-8213/acc0f1
2023 doi
-
[13]
E., Genetelli, A., Attie, R., & Potts, H
Innes, D. E., Genetelli, A., Attie, R., & Potts, H. E. 2008, Astronomy & Astrophysics, 495, 319, doi: 10.1051/0004-6361:200811011
2008 doi
-
[14]
T., Uritsky, V
Kumar, P., Karpen, J. T., Uritsky, V. M., et al. 2022, The Astrophysical Journal, 933, 21, doi: 10.3847/1538-4357/ac6c24
2022 doi
-
[15]
Madjarska, M. S. 2019, Living Reviews in Solar Physics, 16, doi: 10.1007/s41116-019-0018-8
2019 doi
-
[16]
2022, Astronomy & Astrophysics, 660, A45, doi: 10.1051/0004-6361/202142439
Wiegelmann, T., & Xie, H. 2022, Astronomy & Astrophysics, 660, A45, doi: 10.1051/0004-6361/202142439
2022 doi
-
[17]
W., & Gurman, J
McIntosh, S. W., & Gurman, J. B. 2005, Solar Physics, 228, 285, doi: 10.1007/s11207-005-4725-z
2005 doi
-
[18]
L., Sterling, A
Moore, R. L., Sterling, A. C., & Falconer, D. A. 2015, The Astrophysical Journal, 806, 11, doi: 10.1088/0004-637x/806/1/11
2015 doi
-
[19]
2014, Solar Physics, 289, 2945, doi: 10.1007/s11207-014-0523-9
Morgan, H., & Druckm¨ uller, M. 2014, Solar Physics, 289, 2945, doi: 10.1007/s11207-014-0523-9
2014 doi
-
[20]
K., Hansteen, V
Panesar, N. K., Hansteen, V. H., Tiwari, S. K., et al. 2023, The Astrophysical Journal, 943, 24, doi: 10.3847/1538-4357/aca1c1
2023 doi
-
[21]
K., Sterling, A
Panesar, N. K., Sterling, A. C., & Moore, R. L. 2017, The Astrophysical Journal, 844, 131, doi: 10.3847/1538-4357/aa7b77
2017 doi
-
[22]
K., Sterling, A
Panesar, N. K., Sterling, A. C., Moore, R. L., et al. 2018, The Astrophysical Journal, 868, L27, doi: 10.3847/2041-8213/aaef37
2018 doi
-
[23]
K., Tiwari, S
Panesar, N. K., Tiwari, S. K., Berghmans, D., et al. 2021, The Astrophysical Journal Letters, 921, L20, doi: 10.3847/2041-8213/ac3007
2021 doi
-
[24]
R., Parnell, C
Priest, E. R., Parnell, C. E., & Martin, S. F. 1994, The Astrophysical Journal, 427, 459, doi: 10.1086/174157
1994 doi
-
[25]
E., Patsourakos, S., Pariat, E., et al
Raouafi, N. E., Patsourakos, S., Pariat, E., et al. 2016, Space Science Reviews, 201, 1, doi: 10.1007/s11214-016-0260-5
2016 doi
-
[26]
E., Stenborg, G., Seaton, D
Raouafi, N. E., Stenborg, G., Seaton, D. B., et al. 2023, The Astrophysical Journal, 945, 28, doi: 10.3847/1538-4357/acaf6c
2023 doi
-
[27]
2013, The Astrophysical Journal, 775, 22, doi: 10.1088/0004-637x/775/1/22
Sako, N., Shimojo, M., Watanabe, T., & Sekii, T. 2013, The Astrophysical Journal, 775, 22, doi: 10.1088/0004-637x/775/1/22
2013 doi
-
[28]
E., et al
Savcheva, A., Cirtain, J., DeLuca, E. E., et al. 2007, Publications of the Astronomical Society of Japan, 59, S771, doi: 10.1093/pasj/59.sp3.s771
2007 doi
-
[29]
W., et al
Shibata, K., Ishido, Y., Acton, L. W., et al. 1992, \pasj, 44, L173
1992
-
[30]
Sterling, A. C. 2000, Solar Physics, 196, 79, doi: 10.1023/a:1005213923962
2000 doi
-
[31]
C., & Moore, R
Sterling, A. C., & Moore, R. L. 2020, The Astrophysical Journal, 896, L18, doi: 10.3847/2041-8213/ab96be
2020 doi
-
[32]
C., Moore, R
Sterling, A. C., Moore, R. L., & Panesar, N. K. 2022, The Astrophysical Journal, 927, 127, doi: 10.3847/1538-4357/ac473f
2022 doi
-
[33]
T., Ji, K
Su, J. T., Ji, K. F., Cao, W., et al. 2016, The Astrophysical Journal, 817, 117, doi: 10.3847/0004-637x/817/2/117
2016 doi
-
[34]
K., Panesar, N
Tiwari, S. K., Panesar, N. K., Moore, R. L., et al. 2019, The Astrophysical Journal, 887, 56, doi: 10.3847/1538-4357/ab54c1
2019 doi
-
[35]
S., Krieger, A
Vaiana, G. S., Krieger, A. S., & Timothy, A. F. 1973, Solar Physics, 32, 81, doi: 10.1007/bf00152731
1973 doi
-
[36]
2024, The Astrophysical Journal, 974, 123, doi: 10.3847/1538-4357/ad74f3
Wang, J., Lee, J., Chae, J., Cao, W., & Wang, H. 2024, The Astrophysical Journal, 974, 123, doi: 10.3847/1538-4357/ad74f3
2024 doi
-
[37]
2000, The Astrophysical Journal, 530, 1071, doi: 10.1086/308377
Wang, J., Li, W., Denker, C., et al. 2000, The Astrophysical Journal, 530, 1071, doi: 10.1086/308377
2000 doi
Reviewed August 8, 2026 · model on record in the stance chip above.
Discussion (0). Continue with ORCID to comment.