REVIEW 4 major objections 6 minor 30 references
Quantifying Cryptocurrency Unpredictability: A Comprehensive Study of Complexity and Forecasting
T0 review · 4 major / 6 minor · reviewed 2026-08-07 · deepseek-v4-flash
Pith's one-line read Five major cryptocurrencies show Brownian-noise complexity, and naive models beat machine-learning and deep-learning forecasters on daily USD prices.
desk verdict A solid univariate forecasting benchmark whose Brownian-noise conclusion is mostly an artifact of using price levels rather than returns; worth refereeing, but needs reframing. read the letter →
The pith
A machine-rendered reading of the paper's core claim, the machinery that carries it, and where it could break.
The reading
What carries the argument
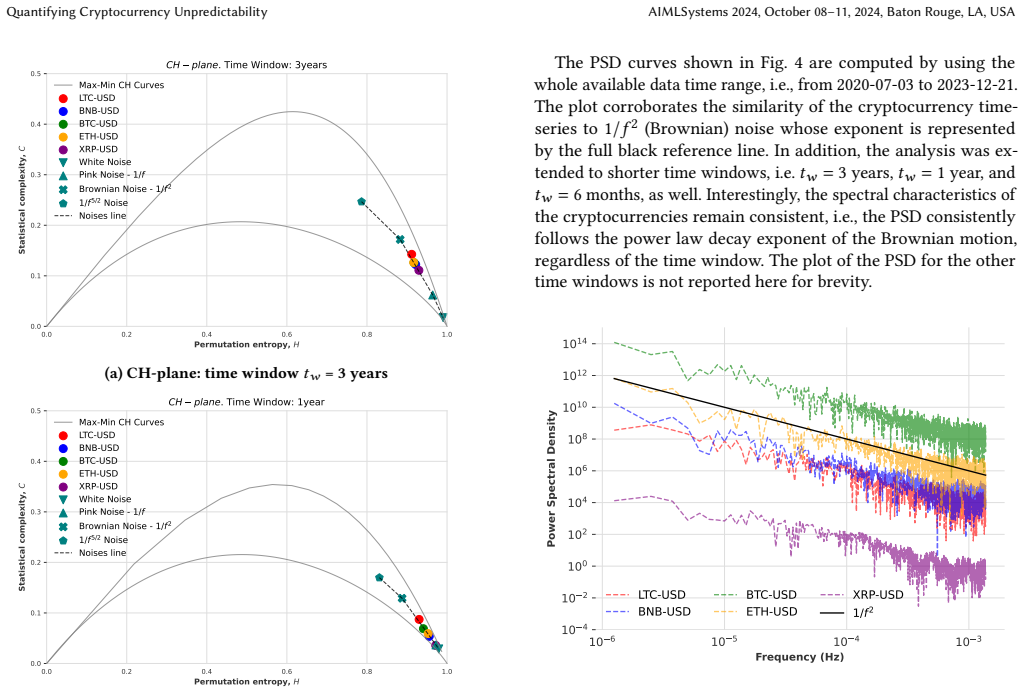
The central measuring device is the Complexity–Entropy causality plane (CH-plane), which plots permutation entropy (the Shannon entropy of ordinal patterns of length $d$) against the intensive Jensen–Shannon statistical complexity. A time series that sits on the 'noises line' of this plane is structurally similar to white, pink, Brownian, or $1/f^{5/2}$ noise; the paper adds the permutation Jensen–Shannon distance to quantify which noise is nearest, and the power spectral density to estimate the exponent $\alpha$ in $S(f)\propto 1/f^{\alpha}$. On the forecasting side, the load-bearing machinery is a rolling-window backtest that retrains each model as the training set grows, and the MAPE metric evaluated only at the forecast horizon, with naive models serving as the baseline that complex models must beat.
What would settle it
Compute the same CH-plane, PSD, and model benchmark on daily returns or log-returns instead of raw prices; if the series move to the white-noise region and the spectral slope flattens to $\alpha\approx 0$, while naive models still win, the Brownian-noise claim is an artifact of cumulative price levels rather than a discovery about crypto dynamics.
Extended reading notes
Core claim
The paper's central claim is that the five cryptocurrencies' univariate dynamics closely resemble noise processes when measured with permutation entropy, statistical complexity, and power spectral density. All series lie on the noises line of the CH-plane, with a spectral exponent close to $\alpha=2$, the Brownian-motion value; XRP is closest to pink ($1/f$) noise. Consistently, no statistical, machine-learning, or deep-learning model reliably outperforms NaiveDrift or NaiveSeasonal across all settings, and the deep recurrent models often fail badly, with MAPEs near 100 percent on Bitcoin and Ethereum. The authors interpret this as evidence that apparent complexity in cryptocurrency prices is mostly noise, and that forecasting future prices from historical prices alone is largely unfeasible.
Load-bearing premise
The result depends on treating raw USD price levels as the univariate series; any non-stationary random walk would show the same Brownian-like complexity profile, so the noise conclusion may be a property of integration rather than of cryptocurrencies specifically.
Editorial extensions
If this is right
- If the claim holds, reported gains from univariate crypto price forecasting should be treated skeptically unless they beat a naive baseline on out-of-sample data.
- Model selection in this domain should default to simple baselines; complex deep architectures add cost and variance without accuracy gains.
- Shorter training windows push the series closer to white noise, so short-horizon forecasts are not more reliable than long-horizon ones for these assets.
- The poor performance of Prophet in this setting shows that models assuming seasonality or holiday structure are mismatched to cryptocurrency dynamics.
Reading between the lines
- The Brownian-noise result is likely a generic property of cumulative price levels: any integrated random walk would occupy the same CH-plane region, so a natural extension is to rerun the analysis on returns, where the expected signature would shift to white noise.
- A testable extension is to check whether volatility clustering or jump dynamics in returns are forecastable even though levels are not; the current study's MAPE on levels would not detect such structure.
- The naive-model dominance implies that practitioners should evaluate trading strategies net of transaction costs; a random-walk benchmark may already be the best achievable baseline.
- Adding exogenous covariates such as sentiment or volume is the paper's own suggested escape route, but the evidence here suggests the gains would come from those covariates, not from more elaborate univariate models.
Signed reviews
Editorial analysis
A structured set of objections, weighed in public.
Referee Report
Summary. The paper studies five daily USD cryptocurrency price series (LTC-USD, BNB-USD, BTC-USD, ETH-USD, XRP-USD) from 2020-07-03 to 2023-12-21. It characterizes their complexity using Bandt-Pompe permutation entropy, the Complexity-Entropy causality plane, the power spectral density, and permutation Jensen-Shannon distances to colored noises, and it benchmarks twelve forecasting models (statistical, machine learning, and deep learning) with a rolling-origin evaluation across three training-window lengths and forecast horizons of 1, 7, and 30 days. The paper concludes that cryptocurrency price levels resemble Brownian noise and that univariate forecasting of cryptocurrencies is 'essentially comparable to pure noise forecasting,' with simple Naive models consistently outperforming more complex ML and DL models.
Significance. The forecasting benchmark is a useful negative result: it confirms at daily frequency that simple random-walk-style baselines are hard to beat for these five assets, and it provides a cautionary counterweight to studies that report ML/DL gains without comparing to naive baselines. The rolling-origin evaluation and the inclusion of multiple horizons and time windows are strengths. However, the complexity analysis is applied to raw price levels, so the Brownian-noise resemblance is a generic property of integrated series rather than a cryptocurrency-specific finding; the forecasting comparison lacks formal significance tests; and the DL results contain MAPE values near 99% that look like implementation artifacts. The central claim is defensible only after reframing or after additional analysis on returns or log-prices.
major comments (4)
- [Section 3.1 and 4.1 (Figs. 3-4, Table 2)] The complexity analysis is performed on raw USD price levels, yet the conclusions are phrased as properties of cryptocurrency dynamics. For any non-stationary integrated series—for instance the cumulative sum of independent increments, regardless of whether those increments are predictable—the price-level PSD is approximately 1/f^2 and the CH-plane position falls near the Brownian noise line. The reported Brownian resemblance is therefore a mathematical consequence of the level transformation and does not distinguish cryptocurrencies from a generic random walk. This affects the paper's framing in the abstract and Section 5 ('pure noise'). The authors should either re-run the CH-plane/PJSD/PSD analysis on returns or log-prices, or explicitly reframe the result as 'price levels behave like an integrated process; returns are the relevant object for predictability.' Without this, the complexity pillar of the paper does not support cryptocurrency-specific unpredictability.
- [Section 4.2 (Tables 3 and 4)] The claim that sophisticated statistical models are 'not statistically distinguishable' from Naive models is not supported by evidence. Table 4 reports mean MAPE and standard deviation, and the text treats overlapping standard deviations as a statistical finding. Overlap of unconditional standard deviations is not a significance test, and the aggregation across assets and windows ignores the rolling-window dependence of the forecast errors. A paired comparison per asset and window (e.g., Diebold-Mariano tests on absolute or squared errors, or a Wilcoxon signed-rank test on MAPE differences) is needed. This matters because the paper's headline conclusion is that naive models are comparable or superior; without a formal test, small numerical differences such as NaiveSeasonal 1.636 vs AutoETS 1.634 at horizon 1 in Table 4 cannot be interpreted as evidence of equivalence.
- [Section 3.3 and Table 3] The deep-learning results contain MAPE values near 99% for BTC-USD and ETH-USD across all time windows and horizons (e.g., VanillaRNN 99.091 and LSTM 99.765 for BTC-USD in the 3-year window). Given price levels of tens of thousands of dollars, these values indicate that the models failed to produce usable forecasts rather than that the series is unpredictable. The paper states in Section 3.1 that 'no data preprocessing was applied' and provides no hyperparameters, architecture details, training epochs, or seeds for the DL models. Without this information, or without an evaluation on standardized returns or levels, the conclusion that 'DL models struggle' is based on potentially broken training runs. The authors should report the exact Darts configuration for each DL model and either preprocess inputs (e.g., scaling) or explain why the reported MAPE values are plausible.
- [Section 4.1 (Fig. 4)] The statement that the PSD 'consistently follows the power law decay exponent of the Brownian motion' is based on a visual comparison with a 1/f^2 reference line. No power-law exponent is estimated from the data, no confidence intervals are given, and the PSD for shorter time windows is not shown. A quantitative fit of the log-log slope (e.g., via linear regression on the log PSD or a periodogram-based estimator) with uncertainty bounds is needed to support the claim that the exponent is indistinguishable from 2 rather than, say, 1.5 or 2.5. This is load-bearing for the complexity conclusion.
minor comments (6)
- [Table 2 caption] The caption reads 'Permutation Jehnsenn-Shannon distances'; this should be 'Permutation Jensen-Shannon distances'.
- [Figure 3] The three subfigures (a), (b), and (c) appear to display the same three-panel image; please replace them with the actual CH-plane plots for each of the three time windows.
- [Section 3.2] The description of C_JS[P] as 'multiplying this divergence by the entropy of P' omits the required normalization; the standard formula is C_JS[P] = Q_J[P, P_e] * H[P] / H_max, where Q_J includes a normalization constant.
- [Section 3.1] The phrase 'no data preprocessing was applied' is ambiguous: clarify whether it refers only to cleaning/missing values, and specify whether input features were standardized for the ML and DL models.
- [Section 5] The term 'pure noise forecasting' is never defined; specify the noise forecast benchmark used (e.g., a random walk without drift, or a bootstrap of returns) so the comparison is explicit.
- [References] Reference [23] is cited twice with different descriptions in the same paragraph; please review the citation to avoid duplication and clarify which findings come from which study.
Circularity Check
No significant circularity: all central claims are direct empirical measurements and out-of-sample forecasts, not reductions to fitted inputs or self-cited premises.
full rationale
The paper is an empirical study rather than a derivation from first principles. The complexity analysis in Section 4.1 directly computes permutation entropy, statistical complexity, PJSD distances, and PSD exponents from the price series; none of these quantities is defined in terms of the paper's conclusion, and no parameter is fitted to the target result and then renamed as a prediction. The forecasting comparison in Section 4.2 trains each model on training windows and evaluates on a held-out test set, with Naive models acting as standard baselines rather than as fitted parameters masquerading as forecasts. The statement that cryptocurrencies resemble Brownian noise reflects a modeling choice to analyze raw USD price levels rather than returns, and the statement that Naive models outperform complex models is an observed empirical outcome. These are validity concerns about the object of analysis, not circular steps in which an equation reduces to itself or a cited result carries the argument. There are no self-citations, uniqueness theorems, or ansatze smuggled in from prior work by the same authors. The paper contains no passage asserting a limitation that exposes a circular step. Under the stated criteria, no load-bearing step reduces to its own input by construction, so the appropriate finding is no significant circularity.
Assumptions & free parameters
free parameters (1)
- Bandt-Pompe embedding dimension d =
d=5 for 3-year window, d=4 for 1-year and 6-month windows
assumptions (4)
- standard math Permutation entropy and the CH-plane are valid discriminators of stochastic versus deterministic dynamics.
- domain assumption Raw price levels, not returns or log returns, are the appropriate series for assessing univariate predictability.
- domain assumption The Darts library implements each model equivalently to its canonical version, including RNN/LSTM default scaling behavior.
- domain assumption MAPE on price levels is a meaningful loss function for comparing forecasts across coins.
Cite this review
Pith. "Pith review of Quantifying Cryptocurrency Unpredictability: A Comprehensive Study of Complexity and Forecasting." pith.science (2026). https://pith.science/paper/MRCBJZKO
@misc{pith2026250209079,
  author       = {Pith},
  title        = {Pith review of: Quantifying Cryptocurrency Unpredictability: A Comprehensive Study of Complexity and Forecasting},
  year         = {2026},
  howpublished = {\url{https://pith.science/paper/MRCBJZKO}},
  note         = {Machine review of arXiv:2502.09079}
}
read the original abstract
This paper offers a thorough examination of the univariate predictability in cryptocurrency time-series. By exploiting a combination of complexity measure and model predictions we explore the cryptocurrencies time-series forecasting task focusing on the exchange rate in USD of Litecoin, Binance Coin, Bitcoin, Ethereum, and XRP. On one hand, to assess the complexity and the randomness of these time-series, a comparative analysis has been performed using Brownian and colored noises as a benchmark. The results obtained from the Complexity-Entropy causality plane and power density spectrum analysis reveal that cryptocurrency time-series exhibit characteristics closely resembling those of Brownian noise when analyzed in a univariate context. On the other hand, the application of a wide range of statistical, machine and deep learning models for time-series forecasting demonstrates the low predictability of cryptocurrencies. Notably, our analysis reveals that simpler models such as Naive models consistently outperform the more complex machine and deep learning ones in terms of forecasting accuracy across different forecast horizons and time windows. The combined study of complexity and forecasting accuracies highlights the difficulty of predicting the cryptocurrency market. These findings provide valuable insights into the inherent characteristics of the cryptocurrency data and highlight the need to reassess the challenges associated with predicting cryptocurrency's price movements.
Figures


Figures from the paper (1 more)

Reference graph
Works this paper leans on
-
[1]
W Farida Agustini, Ika Restu Affianti, and Endah RM Putri. 2018. Stock price prediction using geometric Brownian motion. Journal of Physics: Conference Series 974, 1 (mar 2018), 012047. https://doi.org/10.1088/1742-6596/974/1/012047
-
[2]
Erdinc Akyildirim, Ahmet Goncu, and Ahmet Sensoy. 2021. Prediction of cryp- tocurrency returns using machine learning. Annals of Operations Research 297, 1 (01 Feb 2021), 3–36. https://doi.org/10.1007/s10479-020-03575-y
-
[3]
Christoph Bandt and Bernd Pompe. 2002. Permutation entropy: a natural com- plexity measure for time series. Physical review letters 88, 17 (2002), 174102
work page 2002
-
[4]
Baur, KiHoon Hong, and Adrian D
Dirk G. Baur, KiHoon Hong, and Adrian D. Lee. 2018. Bitcoin: Medium of exchange or speculative assets? Journal of International Financial Markets, Insti- tutions and Money 54 (2018), 177–189. https://doi.org/10.1016/j.intfin.2017.12.004
-
[5]
Ahmed Bouteska, Mohammad Zoynul Abedin, Petr Hajek, and Kunpeng Yuan
-
[6]
Leo Breiman. 2001. Random forests. Machine learning 45, 1 (2001), 5–32
2001
-
[7]
Leopoldo Catania, Stefano Grassi, and Francesco Ravazzolo. 2019. Forecasting cryptocurrencies under model and parameter instability. International Journal of Forecasting 35, 2 (2019), 485–501. https://doi.org/10.1016/j.ijforecast.2018.09.005
-
[8]
Tianqi Chen and Carlos Guestrin. 2016. Xgboost: A scalable tree boosting system. In Proceedings of the 22nd acm sigkdd international conference on knowledge discovery and data mining . 785–794
2016
Show all 30 references
-
[9]
Massimo Guidolin Daniele Bianchi and Manuela Pedio. 2023. The dynamics of returns predictability in cryptocurrency markets. The European Journal of Finance 29, 6 (2023), 583–611. https://doi.org/10.1080/1351847X.2022.2084343 arXiv:https://doi.org/10.1080/1351847X.2022.2084343
2023
-
[10]
Alysha M De Livera, Rob J Hyndman, and Ralph D Snyder. 2011. Forecasting time series with complex seasonal patterns using exponential smoothing. J. Amer. Statist. Assoc. 106, 496 (2011), 1513–1527
2011
-
[11]
J. L. Elman. 1990. Finding structure in time. Cognitive Science 14, 2 (1990), 179–211
1990
-
[12]
Julien Herzen, Francesco Lässig, Samuele Giuliano Piazzetta, Thomas Neuer, Léo Tafti, Guillaume Raille, Tomas Van Pottelbergh, Marek Pasieka, Andrzej Skrodzki, Nicolas Huguenin, Maxime Dumonal, Jan Kościsz, Dennis Bader, Frédérick Gusset, Mounir Benheddi, Camila Williamson, Mi...
2022
-
[13]
Sepp Hochreiter and Jürgen Schmidhuber. 1997. Long short-term memory.Neural computation 9, 8 (1997), 1735–1780
1997
-
[14]
Rob J Hyndman and George Athanasopoulos. 2021. Forecasting: Principles and Practice (3rd ed). OTexts
2021
-
[15]
Salim Lahmiri and Stelios Bekiros. 2019. Cryptocurrency forecasting with deep learning chaotic neural networks. Chaos, Solitons & Fractals 118 (2019), 35–40. https://doi.org/10.1016/j.chaos.2018.11.014
2019 doi
-
[16]
Salim Lahmiri, Stelios Bekiros, and Frank Bezzina. 2022. Complexity analysis and forecasting of variations in cryptocurrency trading volume with support vector regression tuned by Bayesian optimization under different kernels: An empirical comparison from a large dataset. Expe...
2022
-
[17]
Sean McNally, Jason Roche, and Simon Caton. 2018. Predicting the Price of Bitcoin Using Machine Learning. In 2018 26th Euromicro International Conference on Parallel, Distributed and Network-based Processing (PDP) . 339–343. https: //doi.org/10.1109/PDP2018.2018.00060
2018
-
[18]
Ujan Mukhopadhyay, Anthony Skjellum, Oluwakemi Hambolu, Jon Oakley, Lu Yu, and Richard Brooks. 2016. A brief survey of Cryptocurrency systems. In 2016 14th Annual Conference on Privacy, Security and Trust (PST) . 745–752. https: //doi.org/10.1109/PST.2016.7906988
2016
-
[19]
Satoshi Nakamoto. 2008. Bitcoin: A Peer-to-Peer Electronic Cash System. https: //bitcoin.org/bitcoin.pdf Accessed: 2015-07-01
2008
-
[20]
Boris N Oreshkin, Dmitri Carpov, Nicolas Chapados, and Yoshua Bengio. 2019. N-BEATS: Neural basis expansion analysis for time series forecasting. In arXiv preprint arXiv:1905.10437
2019 arXiv
-
[21]
O. A. Rosso, H. A. Larrondo, M. T. Martin, A. Plastino, and M. A. Fuentes. 2007. Distinguishing Noise from Chaos. Phys. Rev. Lett. 99 (Oct 2007), 154102. Issue 15. https://doi.org/10.1103/PhysRevLett.99.154102
2007 doi
-
[22]
Helder Sebastião and Pedro Godinho. 2021. Forecasting and trading cryptocur- rencies with machine learning under changing market conditions. Financial Innovation 7, 1 (06 Jan 2021), 3. https://doi.org/10.1186/s40854-020-00217-x
2021 doi
-
[23]
Ludermir, and Tatijana Stosic
Darko Stosic, Dusan Stosic, Teresa B. Ludermir, and Tatijana Stosic. 2019. Explor- ing disorder and complexity in the cryptocurrency space. Physica A: Statistical Mechanics and its Applications 525 (2019), 548–556. https://www.sciencedirect. com/science/article/pii/S0378437119303279
2019
-
[24]
Ivan Svetunkov, Nikolaos Kourentzes, and John Keith Ord. 2022. Complex ex- ponential smoothing. Naval Research Logistics (NRL) 69, 8 (2022), 1108–1123. https://doi.org/10.1002/nav.22074
2022 doi
-
[25]
Sean J Taylor and Benjamin Letham. 2018. Forecasting at scale. The American Statistician 72, 1 (2018), 37–45
2018
-
[26]
Junhuan Zhang, Kewei Cai, and Jiaqi Wen. 2024. A survey of deep learning applications in cryptocurrency. iScience 27, 1 (2024), 108509. https://doi.org/10. 1016/j.isci.2023.108509
2024
-
[27]
Ribeiro, and Osvaldo A
Luciano Zunino, Felipe Olivares, Haroldo V. Ribeiro, and Osvaldo A. Rosso. 2022. Permutation Jensen-Shannon distance: A versatile and fast symbolic tool for complex time-series analysis. Phys. Rev. E 105 (Apr 2022), 045310. Issue 4. https://doi.org/10.1103/PhysRevE.105.045310
2022 doi
-
[28]
Tabak, Darío G
Luciano Zunino, Massimiliano Zanin, Benjamin M. Tabak, Darío G. Pérez, and Osvaldo A. Rosso. 2010. Complexity-entropy causality plane: A useful approach to quantify the stock market inefficiency. Physica A: Statistical Mechanics and its Applications 389, 9 (2010), 1891–1901. h...
2010 doi
-
[29]
Alexandra Gabriela Ţiţan. 2015. The Efficient Market Hypothesis: Review of Specialized Literature and Empirical Research. Procedia Economics and Finance 32 (2015), 442–449. https://doi.org/10.1016/S2212-5671(15)01416-1 Emerging Markets Queries in Finance and Business 2014, EMQ...
2015 doi
-
[2024]
International Review of Financial Analysis 92 (2024), 103055
Cryptocurrency price forecasting – A comparative analysis of ensemble learning and deep learning methods. International Review of Financial Analysis 92 (2024), 103055. https://doi.org/10.1016/j.irfa.2023.103055
2024
Reviewed August 7, 2026 · model on record in the stance chip above.
Discussion (0). Continue with ORCID to comment.