REVIEW 3 major objections 7 minor 1 cited by
LOB-Bench: Benchmarking Generative AI for Finance -- an Application to Limit Order Book Data
T0 review · 3 major / 7 minor · reviewed 2026-08-07 · deepseek-v4-flash
Pith's one-line read This paper builds a distributional benchmark for generative models of limit order book data and reports that the autoregressive LOBS5 model beats both a parametric baseline and other generative models on most realism scores.
desk verdict Useful, honest benchmark package; the SOTA comparison is confounded by unequal training budgets and periods, so the headline ranking should be taken with salt until re-run under matched conditions. read the letter →
The pith
A machine-rendered reading of the paper's core claim, the machinery that carries it, and where it could break.
The reading
What carries the argument
The load-bearing machinery is the scoring-function framework: aggregators map messages and order book states to scalar quantities such as spread, book volumes, imbalance, inter-arrival time, and order levels; histograms of these scores are estimated with variable-width binning and compared using the L1 (total variation) and Wasserstein-1 distances. Conditional versions of the same comparison, with one score conditioned on decile buckets of another, expose how models fail in particular market contexts, and error divergence conditional on the sampling step quantifies the autoregressive trap. A trained discriminator network acts as a worst-case scoring function, and price-impact response functions from the market microstructure literature measure whether generated data responds to order-flow events the way real data does.
What would settle it
Pair each model's aggregate LOB-Bench score with the change in mid-price prediction F1 when its synthetic data is added to training: if a better benchmark score does not go with equal or better downstream F1, then distributional closeness on these statistics is not a sufficient proxy for practical quality.
Extended reading notes
Core claim
The central claim is that LOB-Bench provides a workable, distributional way to rank generative models of message-level order flow, and that under this ranking the autoregressive S5 model LOBS5 beats a parametric baseline, a conditional GAN, and RWKV sequence models on most scores. The paper further reports two systematic findings: distributional error grows with the number of sampled steps for every model, and none of the tested models' synthetic data improves a downstream mid-price classification task, though the distributional scores give a clearer separation of model quality than that task does.
Load-bearing premise
The benchmark's ranking only measures how close generated and real distributions are on its chosen statistics; the paper assumes without external validation that this closeness is what makes a model useful for downstream applications such as counterfactual simulation or strategy testing.
Editorial extensions
If this is right
- Models can be ranked by a single aggregate distributional score with confidence intervals, enabling reproducible comparisons.
- Error-divergence curves expose how quickly each model derails as it generates longer sequences, pointing at the autoregressive trap.
- Discriminator scores provide a hard-to-game upper bound on realism that even the best current model fails by a clear margin.
- The benchmark's pluggable scoring functions make it extensible to other high-dimensional event-stream domains, not only equities.
- Current generative LOB models do not yet help downstream mid-price prediction; the paper treats this as a minimum viable bar that future models should clear.
Reading between the lines
- The paper's own F1 experiment suggests distributional closeness may not translate into practical value: a model that wins LOB-Bench could still be useless for counterfactual strategy testing until downstream correlations are demonstrated.
- A sharper test of the benchmark would be to see whether models ranked higher on LOB-Bench also produce more realistic responses in a simulated execution task, for instance matching the square-root market impact law the authors cite as future work.
- Because the discriminator still separates LOBS5 output with ROC 0.83, conditioning discriminator scores on perturbation level could turn adversarial measurement into a more informative continuum rather than a pass/fail.
- The same framework could be applied to transaction data, forex quote streams, or decentralized exchange order flow, where similar realism questions arise.
Editorial analysis
A structured set of objections, weighed in public.
Referee Report
Summary. The paper proposes LOB-Bench, an evaluation framework for generative models of limit order book message streams. The framework computes L1 and Wasserstein-1 distances between real and generated distributions of numerous LOB statistics (spread, volumes, imbalance, inter-arrival times, etc.), both unconditionally and conditionally on other scores, along with market impact response functions and an adversarially trained discriminator score. The authors benchmark five models – LOBS5 (an S5-based autoregressive model), RWKV-4/RWKV-6, the Coletta et al. (2022) conditional GAN, and the Cont et al. (2010) parametric baseline – on GOOG and INTC data, and report that LOBS5 achieves the best aggregate scores and best reproduces impact curves. The paper also reports a mid-price prediction experiment that shows no improvement when generated data is added to training.
Significance. The benchmark is a timely and potentially useful tool for the community: it is open-source, flexible, includes standard financial statistics, and provides quantitative distributional scores rather than qualitative stylized facts. The authors include a bin-size sensitivity analysis and make code and generated data available. However, the headline comparative claim ('autoregressive GenAI approach beats traditional model classes') is not supported by the experiments as designed, because the models are trained on different time periods and with very different compute budgets. The paper's own downstream validation does not show practical benefit of the generated data. The benchmark's core machinery is sound, but the evaluation protocol and the strength of the claims need substantial revision.
major comments (3)
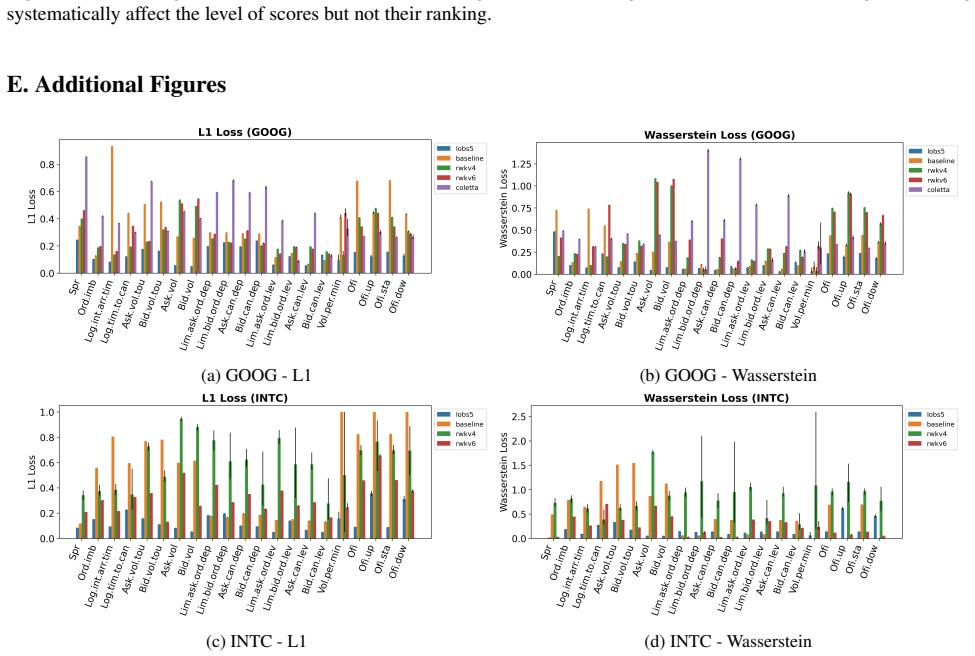
- [Section 6 and Appendices B–C] The model comparison is confounded by non-uniform training windows and compute budgets. LOBS5 and the RWKV models are trained on all of 2022, while the Coletta model is trained on three days in January 2019 and tested on the next three days (as reported in Section 6). Since the benchmark scores are distributional distances to January 2023 test data, a model trained on 2022 has a large in-domain advantage. Additionally, LOBS5 uses 30.4 L40 days of training (Appendix B) versus 10 L40S days for all four RWKV models (Appendix C). The abstract and Section 6 claim that LOBS5 is state-of-the-art and that the autoregressive GenAI approach beats traditional model classes, but this conflates model class with training data recency and compute. A controlled comparison (e.g., retraining Coletta on 2022 data, or at least matching the test window) or substantially weakened claims are required.
- [Section 6, Figure 7] The impact response analysis omits Coletta and RWKV curves because they 'quickly diverge due to error accumulation in inference.' This selective reporting removes two of the five models from a headline metric and cannot be used as evidence for the superiority of LOBS5 on this metric. If divergence occurs, it should be quantified and included (e.g., as a separate 'derailment' score, consistent with the benchmark's own divergence analysis in Figure 18), or the omission criterion should be specified in advance.
- [Section 4.3 and Figure 8] The mid-price prediction experiment, the paper's only external validation, shows that adding generated data from any model never improves F1 scores and often degrades them. The paper acknowledges this, but it undercuts the claim that the benchmark measures 'realism' in a sense that is useful for downstream applications. The discriminator ROC of 0.83 for LOBS5 (Section 4.2) further indicates that even the best model is clearly distinguishable from real data. The paper should either provide a different external validation (e.g., matching stylized facts, execution cost in a simulator) or explicitly state that the benchmark measures distributional fidelity on a fixed set of statistics, not fitness for downstream use.
minor comments (7)
- [Section 3] The sentence 'This pre-processed dataset containst orders' contains a typo; it should be 'contains'.
- [Equation (6)] The symbol p_t is used for the mid-price while the paper also uses p for probability densities; please disambiguate the notation.
- [Appendix D] The word 'halfing' should be 'halving'.
- [Figure 3 caption] The model name 'coletta' should be capitalized consistently as 'Coletta'.
- [Section 4.2] The description of the discriminator input dimension is unclear: n=10 gives D=40, but the encoding Psi_i is described as mapping to R^3; please reconcile these numbers.
- [Section 4.1] The statement that event lag times are 'distributed uniformly on a logarithmic scale' should be rephrased as 'log-uniformly' or 'uniformly in log-space' for clarity.
- [Figure 4] The figure reports mean, median, and IQM alongside bootstrapped confidence intervals; please clarify how the CIs are computed for the median and IQM summaries.
Circularity Check
No circular derivation chain: the benchmark ranks models against external real-data statistics, so LOBS5's leading score is an empirical result rather than a construct of the scoring equations.
full rationale
The paper's central claim (autoregressive GenAI beats traditional model classes; LOBS5 is state-of-the-art) is produced by computing L1 and Wasserstein-1 distances between distributions of explicit score functions applied to real LOBSTER data and to model-generated data (Section 4, Eqs. 1-4). None of the scoring functions is defined in terms of the LOBS5 model, no parameter is fitted to the test-period real data and then renamed a prediction, and no uniqueness theorem from the authors' prior work is invoked to forbid alternative model choices. The LOBS5 architecture is inherited from Nagy et al. (2023) and inference uses the authors' JAX-LOB simulator, but the benchmark comparison is external to those citations: the winning model must still match real hold-out data. The main weaknesses are experimental-fairness confounds rather than circularity: Section 6 states LOBS5 was trained on 'the entire year of 2022' while 'The Coletta model is trained on three days from January 2019 and tested on three subsequent days', and Appendix B/C disclose 30.4 L40 days for LOBS5 vs 10 L40S days for all four RWKV models; the Coletta INTC results and Coletta/RWKV impact curves are omitted because of divergence. These choices make the headline comparison uncontrolled, but they do not make the derivation equivalent to its inputs. Likewise, the benchmark's own evidence (discriminator ROC 0.83; Figure 8 showing generated data does not improve mid-price F1) is a validity caveat, not a circularity. Accordingly, no specific circular step can be quoted; the score reflects only the minor self-referential element that the benchmark's designers are also the developers of the winning model.
Assumptions & free parameters
free parameters (3)
- Number of deciles for conditional evaluation =
10
- Lag times for impact response functions =
log-uniform between 1 and 200 ticks
- Order book depth for discriminator input =
n = 10 levels
assumptions (3)
- domain assumption Distributional similarity between real and generated data on the selected scoring functions is a valid proxy for the realism and usefulness of generative LOB models.
- domain assumption The LOBSTER message data and the JAX-LOB simulator faithfully represent true market dynamics, including order splitting behavior.
- standard math Standard statistical tools (Freedman-Diaconis binning, bootstrap confidence intervals, Wasserstein-1 under mean-variance normalization) are appropriate for the data scales in question.
Cite this review
Pith. "Pith review of LOB-Bench: Benchmarking Generative AI for Finance -- an Application to Limit Order Book Data." pith.science (2026). https://pith.science/paper/MSREZ4S5
@misc{pith2026250209172,
  author       = {Pith},
  title        = {Pith review of: LOB-Bench: Benchmarking Generative AI for Finance -- an Application to Limit Order Book Data},
  year         = {2026},
  howpublished = {\url{https://pith.science/paper/MSREZ4S5}},
  note         = {Machine review of arXiv:2502.09172}
}
read the original abstract
While financial data presents one of the most challenging and interesting sequence modelling tasks due to high noise, heavy tails, and strategic interactions, progress in this area has been hindered by the lack of consensus on quantitative evaluation paradigms. To address this, we present LOB-Bench, a benchmark, implemented in python, designed to evaluate the quality and realism of generative message-by-order data for limit order books (LOB) in the LOBSTER format. Our framework measures distributional differences in conditional and unconditional statistics between generated and real LOB data, supporting flexible multivariate statistical evaluation. The benchmark also includes features commonly used LOB statistics such as spread, order book volumes, order imbalance, and message inter-arrival times, along with scores from a trained discriminator network. Lastly, LOB-Bench contains "market impact metrics", i.e. the cross-correlations and price response functions for specific events in the data. We benchmark generative autoregressive state-space models, a (C)GAN, as well as a parametric LOB model and find that the autoregressive GenAI approach beats traditional model classes.
Figures


Figures from the paper (19 more)






Forward citations
Cited by 1 Pith paper
-
Prospects of Imitating Trading Agents in the Stock Market
A state-space generative model trained on synthetic limit order book data can partially imitate trading agent behavior, matching some action distributions while underestimating cancellations, with results limited by h...
Reference graph
Works this paper leans on
-
[6]
URL http://github.com/google-deepmind. Defazio, A. and Mishchenko, K. Learning-rate-free learning by d-adaptation. The 40th International Conference on Machine Learning (ICML 2023),
work page 2023
-
[9]
With this larger model, we also successfully removed the explicit error correction mechanism, which originally rejected semantically incorrectly generated messages, as error rates could be sufficiently reduced by scaling the model. 3https://lobsterdata.com/info/DataStructure.php 13 LOB-Bench: Benchmarking Generative AI for Finance C. RWKV Training Details...
work page 2023
-
[10]
D. Sensitivity of Divergence Metrics to the Bin Size We adopt a dynamic bin size determined by the Freedman–Diaconis (FD) rule, which is specifically designed to adapt to the underlying data distribution. As a result, we do not anticipate significant sensitivity to the choice of bin size. This choice is further supported by a theoretical convergence prope...
work page 2023
-
[11]
URL https://arxiv. org/abs/2406.11903v1. Ntakaris, A., Magris, M., Kanniainen, J., Gabbouj, M., and Iosifidis, A. Benchmark dataset for mid-price forecasting of limit order book data with machine learning methods. Journal of Forecasting, 37(8):852–866,
-
[13]
URL https://ora.ox.ac.uk/objects/uuid: 929fa3fe-4e5f-4cef-ad9f-03eb40110818 . Peng, B., Alcaide, E., Anthony, Q., Albalak, A., Arcadinho, S., Biderman, S., Cao, H., Cheng, X., Chung, M., Grella, M., et al. Rwkv: Reinventing rnns for the transformer era. arXiv preprint arXiv:2305.13048,
-
[16]
The square-root impact law also holds for option markets
T´oth, B., Eisler, Z., and Bouchaud, J.-P. The square-root impact law also holds for option markets. Wilmott, 2016 (85):70–73,
work page 2016
-
[18]
Parden, can you repeat that? defending against jailbreaks via repetition
Zhang, Z., Zhang, Q., and Foerster, J. Parden, can you repeat that? defending against jailbreaks via repetition. arXiv preprint arXiv:2405.07932,
-
[19]
12 LOB-Bench: Benchmarking Generative AI for Finance A. Benchmark Code The benchmark code can be found on GitHub at https://github.com/peernagy/lob bench, additional resources can be found on the project website https://lobbench.github.io/. The benchmark suite provides a convenient API functionality to evaluate model data for a range of scoring functions ...
work page 2023
Show all 23 references
-
[21]
We divide each dataset into chunks of 16384 tokens, and randomly shuffle these chunks for training
trained on GOOG 2017 messages, resulting in datasets of 5.5 billion tokens for INTC 2022 (corresponding to 276 million messages) and 7.5 billion tokens for GOOG 2022 (corresponding to 380 million messages). We divide each dataset into chunks of 16384 tokens, and randomly shuff...
2017
-
[22]
For stability, we clipped the maximum global gradient norm to 1.0 (Pascanu et al., 2013)
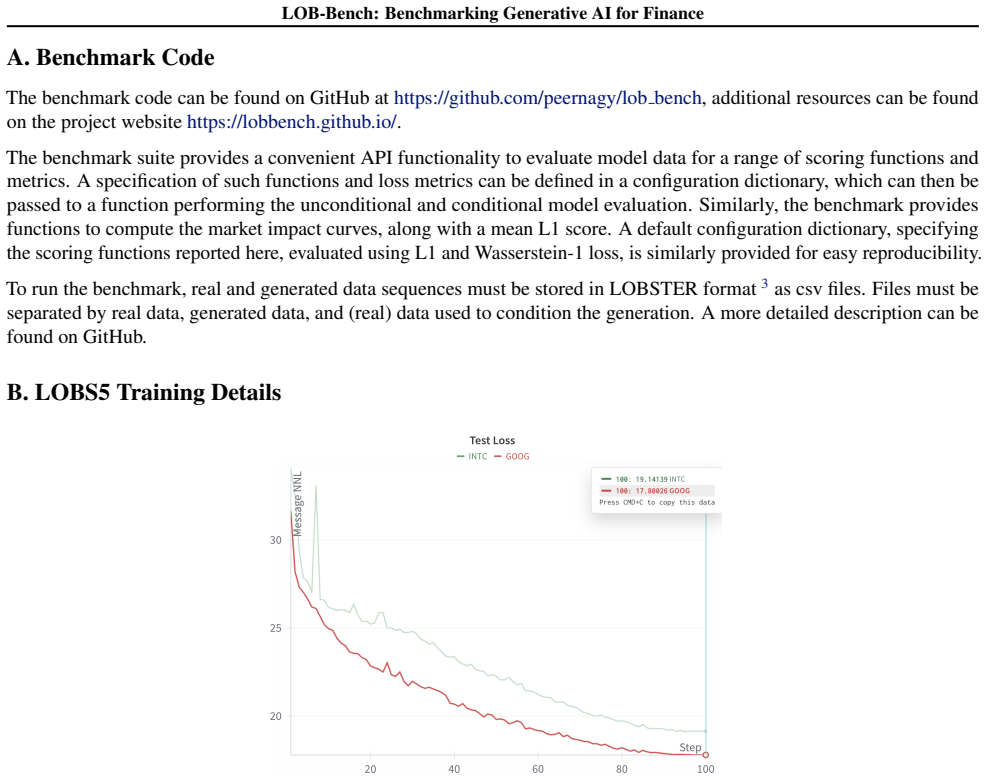
in Optax (DeepMind et al., 2020), without scaling the learning rate or using any learning rate schedulers. For stability, we clipped the maximum global gradient norm to 1.0 (Pascanu et al., 2013). In total, training all 4 of our RWKV models (2 model architectures, each over 2 ...
2020
-
[2001]
doi: 10.1080/713665670
ISSN 1469-7688, 1469-7696. doi: 10.1080/713665670. URL http://www.tandfonline.com/doi/abs/ 10.1080/713665670. Cont, R., Stoikov, S., and Talreja, R. A stochastic model for order book dynamics. Operations research, 58(3): 549–563,
-
[2002]
doi: 10.1088/1469-7688/2/ 5/303
ISSN 1469-7688, 1469-7696. doi: 10.1088/1469-7688/2/ 5/303. URL http://www.tandfonline.com/ doi/abs/10.1088/1469-7688/2/5/303. Coletta, A., Moulin, A., Vyetrenko, S., and Balch, T. Learn- ing to simulate realistic limit order book markets from data as a world agent. In Proceed...
-
[2010]
The price impact of order book events
Cont, R., Kukanov, A., and Stoikov, S. The price impact of order book events. JOURNAL OF FINANCIAL ECONO- METRICS (Winter 2014), 12(1):47–88,
2014
-
[2011]
Kingma, D
doi: https://doi.org/10.2139/ssrn.1977207. Kingma, D. P. and Ba, J. Adam: A method for stochastic optimization. arXiv preprint arXiv:1412.6980,
-
[2013]
Paulin, J
URL https: //arxiv.org/abs/1211.5063. Paulin, J. Understanding flash crash contagion and systemic risk: a calibrated agent-based approach. http://purl.org/dc/dcmitype/Text, University of Oxford, January
-
[2016]
doi: 10.18653/v1/P16-1162
Association for Compu- tational Linguistics. doi: 10.18653/v1/P16-1162. URL https://aclanthology.org/P16-1162/. Spooner, T., Fearnley, J., Savani, R., and Koukorinis, A. Market making via reinforcement learning. In Proceed- ings of the 17th International Conference on Autonomo...
-
[2017]
org/abs/1706.03762
URL http://arxiv. org/abs/1706.03762. arXiv:1706.03762. Vyetrenko, S., Byrd, D., Petosa, N., Mahfouz, M., Dervovic, D., Veloso, M., and Balch, T. Get real: realism metrics for robust limit order book market simulations. In Pro- ceedings of the First ACM International Conferenc...
-
[2018]
doi: 10.1007/s10588-017-9258-0
ISSN 1572-9346. doi: 10.1007/s10588-017-9258-0. URL https://doi. org/10.1007/s10588-017-9258-0 . Murphy, K. P.Machine learning: a probabilistic perspective. MIT press,
-
[2019]
arXiv:1905.03554
URL http:// arxiv.org/abs/1905.03554. arXiv:1905.03554. Lecun, Y . and Bengio, Y . Convolutional networks for im- ages, speech, and time-series. In The handbook of brain theory and neural networks. MIT Press,
1905 arXiv
-
[2020]
Dslob: a synthetic limit order book dataset for bench- marking forecasting algorithms under distributional shift
Cao, D., El-Laham, Y ., Trinh, L., Vyetrenko, S., and Liu, Y . Dslob: a synthetic limit order book dataset for bench- marking forecasting algorithms under distributional shift. arXiv preprint arXiv:2211.11513,
-
[2023]
Eagle and finch: Rwkv with matrix- valued states and dynamic recurrence
Peng, B., Goldstein, D., Anthony, Q., Albalak, A., Al- caide, E., Biderman, S., Cheah, E., Du, X., Ferdinan, T., Hou, H., et al. Eagle and finch: Rwkv with matrix- valued states and dynamic recurrence. arXiv preprint arXiv:2404.05892,
-
[2024]
Llacay, B
URL https: //arxiv.org/abs/2402.02370v2. Llacay, B. and Peffer, G. Using realistic trading strate- gies in an agent-based stock market model. Computa- tional and Mathematical Organization Theory , 24(3): 308–350, September
-
[6266]
URL https://www.worldscientific.com/doi/ abs/10.1142/S2382626615500070
doi: 10.1142/S2382626615500070. URL https://www.worldscientific.com/doi/ abs/10.1142/S2382626615500070. Publisher: World Scientific Publishing Co. Byrd, D., Hybinette, M., and Balch, T. H. Abides: Towards high-fidelity multi-agent market simulation. In Proceed- ings of the 202...
Reviewed August 7, 2026 · model on record in the stance chip above.
Discussion (0). Continue with ORCID to comment.