REVIEW 5 major objections 4 minor 46 references
Predictive Multiplicity in Survival Models: A Method for Quantifying Model Uncertainty in Predictive Maintenance Applications
T0 review · 5 major / 4 minor · reviewed 2026-08-16 · deepseek-v4-flash
Pith's one-line read Equally accurate survival models can produce conflicting failure-risk predictions for the same equipment, and the paper introduces three metrics that quantify how often this happens.
desk verdict The formal adaptation of predictive multiplicity metrics to survival models is real and clean, but the experiments evaluate at each unit's realized event time rather than a fixed horizon, which undermines the headline claims. read the letter →
The pith
A machine-rendered reading of the paper's core claim, the machinery that carries it, and where it could break.
The reading
What carries the argument
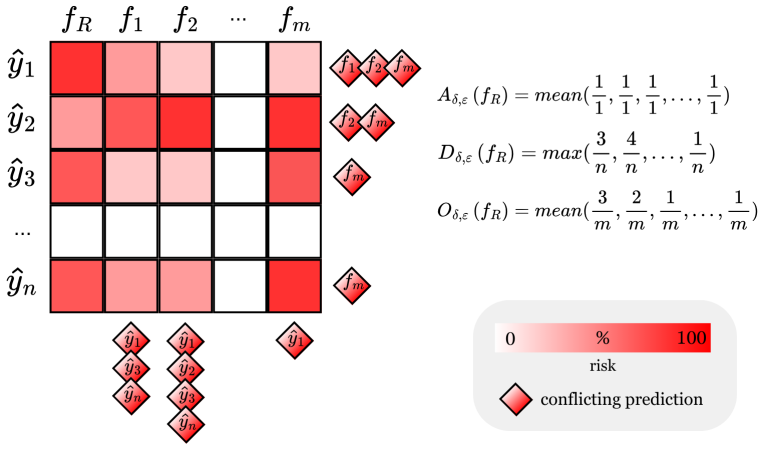
The mechanism that carries the argument is the Rashomon set, the set of models whose performance score is within a tolerance $\epsilon$ of the best available model, together with the conflict threshold $\delta$ that decides when two risk estimates should be called conflicting. The survival-risk output being compared is the conditional cumulative distribution function $f(x_i,t_i)=\Pr(T\le t_i\mid x_i)$, evaluated at each observation's event or censoring time. The three metrics are then summary statistics over the Rashomon set: ambiguity asks whether any plausible model changes an observation's risk, discrepancy asks how many observations the most divergent single model would flip, and obscurity averages disagreement over all plausible models. What makes the argument load-bearing is the choice of this model set and the scoring metric: differences among models are only meaningful if the models are genuinely near-optimal, so the entire measurement is conditioned on how the Rashomon set is constructed.
What would settle it
Recompute ambiguity, discrepancy, and obscurity on the same CMAPSS subsets using Cox proportional-hazards and deep survival networks for the Rashomon set instead of Random Survival Forests, keeping the same $\epsilon$, $\delta$, and Brier-score rule; if the metrics do not rise with $\epsilon$, the claimed multiplicity is an artifact of the forest family rather than a general property of accurate survival models.
Extended reading notes
Core claim
The central discovery is that predictive multiplicity—previously defined for binary, probabilistic, and multi-target classification—also occurs in survival models, and that it is quantifiable with three adapted metrics. Given a reference survival model $f_R$, a performance metric $\Phi$, and a Rashomon parameter $\epsilon$, the Rashomon set $H_\epsilon(f_R)$ collects all models whose performance is within $\epsilon$ of the reference. For a conflict threshold $\delta$, the paper defines ambiguity as the fraction of observations whose risk estimate $f(x_i,t_i)$ differs from $f_R(x_i,t_i)$ by at least $\delta$ under some model in the set, discrepancy as the largest single-model conflict fraction, and obscurity as the average conflict fraction across the set. Applied to Random Survival Forests on CMAPSS, these metrics grow with $\epsilon$ and shrink with $\delta$, with ambiguity and discrepancy often reaching values near one; the paper takes this as direct evidence that accurate survival models can yield conflicting failure-risk and degradation estimates for the same equipment.
Load-bearing premise
The results assume that the Random Survival Forest variants scored by the integrated Brier score under a censoring time fixed at 250 cycles adequately represent all plausible near-optimal survival models for predictive maintenance.
Editorial extensions
If this is right
- A maintenance team that picks a single survival model by Brier score cannot infer that the chosen risk rankings are reliable; ambiguity and discrepancy give the possible spread of failure-risk estimates.
- Reporting ambiguity alongside a point risk estimate turns model uncertainty into a decision quantity: high ambiguity at a chosen $\delta$ is a signal to inspect, add sensors, or defer maintenance actions.
- Evaluating a survival model family by its multiplicity profile at fixed $\epsilon$ is a complement to accuracy ranking; a family with lower ambiguity at the same accuracy is more decision-reliable.
- The tight-set behavior of obscurity means the most dangerous disagreements can hide inside a small cluster of nearly tied models, so Rashomon-set size alone is not a safe proxy for uncertainty.
Reading between the lines
- Beyond the paper, $\delta$ can be calibrated to maintenance costs: if a missed failure is more expensive than a false alarm, the relevant conflict threshold is the risk difference that changes the optimal action, not a statistical convention.
- The same three metrics apply verbatim to other survival outputs—predicted time-to-failure or remaining-useful-life quantiles—if $f(x_i,t_i)$ is replaced by the corresponding functional; the paper tests only cumulative risk.
- Observation-level ambiguity could act as an acquisition function for active learning or sensor placement: units whose risk estimates are least stable under the Rashomon set are the ones worth labeling or inspecting first.
- A testable implication is that ambiguity at tiny $\epsilon$ measures model underspecification; datasets with high tight-set ambiguity should benefit more from additional features than from further hyperparameter search.
Signed reviews
Editorial analysis
A structured set of objections, weighed in public.
Referee Report
Summary. The paper extends the notion of predictive multiplicity to survival analysis, defining three metrics—ambiguity, discrepancy, and obscurity—over a Rashomon set of near-optimal survival models. The methodology is applied to the CMAPSS predictive-maintenance benchmark using Random Survival Forests with a large hyperparameter grid, and the metrics are computed at various Rashomon tolerances epsilon and conflict thresholds delta. The authors report that ambiguity and discrepancy increase with epsilon and reach values near or equal to 1 across multiple datasets, and they conclude that multiple accurate survival models can yield conflicting failure-risk estimates and degradation predictions for the same equipment.
Significance. If the empirical results were robust, this would be a valuable contribution: it formalizes predictive multiplicity for survival data, addresses a real need in maintenance decision-making, and provides an open code repository. The formal definitions in Section 3 are mathematically coherent, and the exploration of a 22,500-configuration model grid is a strength. However, the central empirical claims are undercut by several load-bearing issues: the monotonic increase of ambiguity and discrepancy with epsilon is a tautological consequence of the max-based definitions, the metrics are evaluated at each unit's observed event/censoring time rather than at a fixed decision horizon, the abstract's headline 40-45% figure is inconsistent with Table 3 values that reach 1.0, and no uncertainty quantification (error bars, repeated seeds) is provided for the reported numbers. These issues prevent the paper from currently supporting its general conclusions, though they are addressable within the manuscript's scope.
major comments (5)
- [Section 3.3, Eqs. (8)-(9); Section 5] The paper presents the increase of ambiguity and discrepancy with epsilon as an empirical finding, but this monotonicity is a direct mathematical consequence of the definitions: both metrics take a maximum (or a ratio derived from a maximum) over the Rashomon set H_epsilon, and enlarging the set cannot decrease the maximum. The text in Section 5 ('Overall, model uncertainty is limited when epsilon is small but increases markedly as epsilon grows') is therefore circular. Please reframe the monotonicity as an axiomatic property of the definitions, or recompute the metrics on fixed model sets of controlled size to separate the effect of set expansion from the multiplicity phenomenon.
- [Abstract; Table 3] The abstract states that ambiguity 'reaching up to 40-45% of observations', but Table 3 reports ambiguity values of 1.0 at several (epsilon, delta) combinations across all four datasets (e.g., epsilon=0.05, delta=0.01 and epsilon=0.10, delta=0.01). The 40-45% figure does not match any value in the table as far as can be determined from the text. Please either correct the abstract to reflect the actual range of the metrics or identify explicitly the specific configuration to which the 40-45% figure refers.
- [Section 3.3, Eqs. (8)-(10); Section 4.2] The metrics evaluate f(x_i, t_i) at each observation's realized event or censoring time. With censoring time fixed at 250 cycles, t_i=250 for all censored units and t_i equals the realized failure time for uncensored units. Under a well-calibrated model, the values f(x_i, t_i) for uncensored units are marginally uniform, so the reported disagreement may reflect randomness in the realized failure times rather than genuine conflict about failure risk within a fixed maintenance horizon (e.g., Pr(T <= h | x) for a chosen h). The conclusion that models 'yield conflicting estimations of failure risk and degradation progression' is not supported because no metric evaluates the full survival curve or a prespecified decision horizon. Please recompute the three metrics at one or more fixed horizons (e.g., h=50, 100, 150 cycles) and, ideally, also report an integral metric over the survival curve.
- [Section 4.2; Section 6] The censoring time is fixed at t=250 'to eliminate the censoring sensitivity', but no sensitivity analysis is provided. This is particularly concerning because the authors themselves cite Yardimci and Cavus (2025) reporting that censoring time significantly affects prediction uncertainty in this setting. The limitation statement in Section 6 acknowledges dependence on the performance metric, and the experiments use only the Brier score. Please add sensitivity analyses that vary the censoring time and use an alternative performance metric (e.g., concordance index) to assess whether the reported multiplicity values and trends are robust to these choices.
- [Section 5, Table 3] No error bars, confidence intervals, or repeated runs are reported. Random Survival Forests are randomized (bootstrap sampling, random split points), and the paper trains 22,500 configurations without specifying seeds. The reported values, especially the exact numbers in Table 3 (e.g., 0.8875, 0.9028), may be unstable across runs. Please repeat the full pipeline over multiple random seeds and report means and standard deviations (or confidence intervals) for the multiplicity metrics.
minor comments (4)
- [Section 2.3] The sentence 'a commonly accepted framework for uncertainty quantification in remains elusive' is missing a word; it should read 'in predictive maintenance' or similar.
- [Section 3.3.2] In the text following Eq. (9), 'as a result of replacing f0 with another model' refers to the reference model; please use fR consistently instead of f0.
- [Section 4.1] The sentence 'Because it is recognized as the benchmark dataset' is a sentence fragment; it should be integrated into the previous sentence or completed.
- [Figure 2 caption] The phrase 'δ sets the threshold for how much a model's prediction must differ from the reference to be considered conflicting' appears mid-caption without clear punctuation; please integrate it grammatically.
Circularity Check
The reported epsilon- and delta-trends of the new metrics are monotonic by definition, and the metrics are evaluated at realized event times, so the central multiplicity claim partially reduces to the metric definitions.
-
self definitional
[Section 5, Table 3 and Figure 2, with Eqs. (7)-(9)]
"As ϵ increases to 0.05, a broader range of models—those with slightly worse performance than the reference model—are included in the Rashomon set. Under this condition, ambiguity and discrepancy increase across all datasets except FD003."
Eq. (8) defines ambiguity as a per-observation maximum over H_ε(fR), and Eq. (9) defines discrepancy as a maximum over H_ε(fR). Eq. (7) makes H_ε(fR) monotonically grow with ε, so a maximum over a larger set cannot decrease. Thus 'ambiguity and discrepancy increase with ε' is a formal consequence of the definitions, not an empirical discovery about survival models. The empirical content is only in the magnitudes and dataset-specific saturations, not in the direction of the trend.
-
self definitional
[Section 5, Figure 2 discussion; Eqs. (8)-(10)]
"However, as δ increases, a relative decline in both ambiguity and discrepancy is observed. This implies that, while small prediction differences are widespread, fewer observations exceed larger deviation thresholds."
Every metric uses the indicator 1[|f(x_i,t_i)−f_R(x_i,t_i)| ≥ δ]. Increasing δ strictly restricts which observations satisfy the conflict condition, so A, D, and O are nonincreasing in δ for any fixed Rashomon set. The reported 'decline as δ increases' is therefore a definitional property of the threshold indicator, and the paper's own explanation ('fewer observations exceed larger deviation thresholds') states the mechanism. Presenting this as an empirical trend is circular; only the specific rates of decline are data-dependent.
1 more flagged steps
-
self definitional
[Section 3.3, Eqs. (8)-(10); Abstract and Conclusions]
"Aδ,ϵ(fR;D) := 1/n Σ_i max_{f∈Hϵ(fR)} 1[|f(x_i,t_i)−fR(x_i,t_i)| ≥ δ] ... These results demonstrate that multiple accurate survival models may yield conflicting estimations of failure risk and degradation progression for the same equipment."
The metrics evaluate every model at t_i, the observation's actual event or censoring time, not at a fixed prediction horizon. Since censoring is fixed at 250 cycles, t_i=250 for all censored units, and for uncensored units t_i is the realized failure time. A well-calibrated model's CDF at the realized failure time is an outcome-dependent quantity, so differences in f(x_i,t_i) conflate model disagreement with variation in failure times. The conclusion that models give 'conflicting estimations of failure risk for the same equipment' is therefore tied by construction to the chosen evaluation times; it does not directly establish conflict about maintenance-relevant fixed-horizon risks such as Pr(T≤h | x_i).
full rationale
The paper is not fraudulent: the Rashomon-set construction, the RSF training, and the dataset-level numerical values (e.g., FD001 showing low multiplicity, FD003 showing high multiplicity, obscurity peaking at small ε and then declining) are genuine empirical outputs. However, the headline trends are partly built into the formalism. Eq. (8)-(9) define ambiguity and discrepancy as maxima over H_ε, and Eq. (7) makes H_ε nested in ε, so 'increases with ε' for those two metrics is a monotonicity theorem; all three metrics' decline with δ follows immediately from the threshold indicator. In addition, the metrics are evaluated at each observation's realized event/censoring time t_i, so the central claim about conflicting risk for the same equipment is not a claim about a fixed maintenance horizon. These are definitional issues rather than statistical artifacts. The self-citations (Cavus and Biecek 2024; Yardimci and Cavus 2025) are motivational and are not load-bearing in the derivation. Overall score 6: the framework has genuine empirical content in the magnitudes and cross-dataset comparisons, but the paper presents some by-construction trends as empirical findings, and the central conclusion is closely tied to the metric's outcome-dependent evaluation time.
Assumptions & free parameters
free parameters (3)
- Rashomon tolerance epsilon =
0.01, 0.05, 0.10; grid 0 to 0.5 in Figure 2
- Conflict threshold delta =
0.01, 0.05, 0.10
- Censoring time =
250 cycles
assumptions (4)
- standard math Survival model output f(x,t) is a proper conditional CDF of the event time, and the event-time distribution is continuous, so S(t) = exp(-H(t)) holds.
- domain assumption The Brier score is an appropriate performance metric for ranking survival models in this task.
- domain assumption Models within the Brier-score tolerance epsilon are all considered valid near-optimal models.
- ad hoc to paper Fixing censoring time at 250 cycles removes censoring sensitivity and yields representative survival data.
Cite this review
Pith. "Pith review of Predictive Multiplicity in Survival Models: A Method for Quantifying Model Uncertainty in Predictive Maintenance Applications." pith.science (2026). https://pith.science/paper/SXRAYNIM
@misc{pith2026250412156,
  author       = {Pith},
  title        = {Pith review of: Predictive Multiplicity in Survival Models: A Method for Quantifying Model Uncertainty in Predictive Maintenance Applications},
  year         = {2026},
  howpublished = {\url{https://pith.science/paper/SXRAYNIM}},
  note         = {Machine review of arXiv:2504.12156}
}
read the original abstract
In many applications, especially those involving prediction, models may yield near-optimal performance yet significantly disagree on individual-level outcomes. This phenomenon, known as predictive multiplicity, has been formally defined in binary, probabilistic, and multi-target classification, and undermines the reliability of predictive systems. However, its implications remain unexplored in the context of survival analysis, which involves estimating the time until a failure or similar event while properly handling censored data. We frame predictive multiplicity as a critical concern in survival-based models and introduce formal measures -- ambiguity, discrepancy, and obscurity -- to quantify it. This is particularly relevant for downstream tasks such as maintenance scheduling, where precise individual risk estimates are essential. Understanding and reporting predictive multiplicity helps build trust in models deployed in high-stakes environments. We apply our methodology to benchmark datasets from predictive maintenance, extending the notion of multiplicity to survival models. Our findings show that ambiguity steadily increases, reaching up to 40-45% of observations; discrepancy is lower but exhibits a similar trend; and obscurity remains mild and concentrated in a few models. These results demonstrate that multiple accurate survival models may yield conflicting estimations of failure risk and degradation progression for the same equipment. This highlights the need to explicitly measure and communicate predictive multiplicity to ensure reliable decision-making in process health management.
Figures

Reference graph
Works this paper leans on
-
[1]
write newline
" write newline "" before.all 'output.state := FUNCTION n.dashify 't := "" t empty not t #1 #1 substring "-" = t #1 #2 substring "--" = not "--" * t #2 global.max substring 't := t #1 #1 substring "-" = "-" * t #2 global.max substring 't := while if t #1 #1 substring * t #2 global.max substring 't := if while FUNCTION word.in bbl.in ":" * " " * FUNCTION f...
-
[2]
Abdar, M., Pourpanah, F., Hussain, S., Rezazadegan, D., Liu, L., Ghavamzadeh, M., & Nahavandi, S. (2021). A review of uncertainty quantification in deep learning: Techniques, applications, and challenges. Information Fusion, 76, 243--297
work page 2021
-
[3]
Alabdallah, A., Jakubowski, J., Pashami, S., Bobek, S., Ohlsson, M., Rögnvaldsson, T., & Nalepa, G. J. (2024, June). Understanding survival models through counterfactual explanations. In International Conference on Computational Science (pp. 310–324). Cham: Springer Nature Switzerland
work page 2024
-
[4]
Ali, J., Lahoti, P., & Gummadi, K. P. (2021). Accounting for model uncertainty in algorithmic discrimination. In Proceedings of the 2021 AAAI/ACM Conference on AI, Ethics, and Society (pp. 336--345)
work page 2021
-
[5]
Babu, G. S., Zhao, P., & Li, X. (2016). Deep convolutional neural network-based regression approach for estimation of remaining useful life. International Journal of Advanced Manufacturing Technology, 89(1), 1025–1038. https://doi.org/10.1007/s00170-016-9163-1
-
[6]
Baniecki, H., Sobieski, B., Szatkowski, P., Bombinski, P., & Biecek, P. (2025). Interpretable machine learning for time-to-event prediction in medicine and healthcare. Artificial Intelligence in Medicine, 159, 103026
work page 2025
-
[7]
Báskay, J., Mezei, T., Banczerowski, P., Horváth, A., Joó, T., & Pollner, P. (2025). Censoring Sensitivity Analysis for Benchmarking Survival Machine Learning Methods. Sci, 7(1), 18
work page 2025
-
[8]
Biecek, P., & Samek, W. (2024, July). Position: Explain to question, not to justify. In Proceedings of the 41st International Conference on Machine Learning (pp. 3996-4006)
work page 2024
Show all 46 references
-
[9]
Bousdekis, A., Magoutas, B., Apostolou, D., & Mentzas, G. (2020). A review of data-driven decision-making methods for predictive maintenance of industrial equipment. Journal of Manufacturing Systems, 56, 24–40. https://doi.org/10.1016/j.jmsy.2020.04.004
2020 doi
-
[10]
Breiman, L. (2001). Statistical modeling: The two cultures. Statistical Science, 16(3), 199--231
2001
-
[11]
Cavus, M., & Biecek, P. (2024). An experimental study on the Rashomon effect of balancing methods in imbalanced classification. arXiv preprint arXiv:2405.01557
2024 arXiv
-
[12]
F., Lee, K., Choksi, M
Cooper, A. F., Lee, K., Choksi, M. Z., Barocas, S., De Sa, C., Grimmelmann, J., & Zhang, B. (2024). Arbitrariness and social prediction: The confounding role of variance in fair classification. In Proceedings of the AAAI Conference on Artificial Intelligence, 38(20), 22004--22012
2024
-
[13]
Y., Ngo, D
Du, A. Y., Ngo, D. D., & Wu, Z. S. (2024). Reconciling model multiplicity for downstream decision making. arXiv preprint arXiv:2405.19667
2024 arXiv
-
[14]
I., Cofone, I., & Farnadi, G
Ganesh, P., Daldaban, I. I., Cofone, I., & Farnadi, G. (2024). The cost of arbitrariness for individuals: Examining the legal and technical challenges of model multiplicity. arXiv preprint arXiv:2407.13070
2024 arXiv
-
[15]
O., Schierholz, M., Kreuter, F., & Kauermann, G
Gruber, C., Schenk, P. O., Schierholz, M., Kreuter, F., & Kauermann, G. (2023). Sources of uncertainty in machine learning--A statistician's view. arXiv preprint arXiv:2305.16703
2023 arXiv
-
[16]
Guillaume, A., Vrain, C., & Wael, E. (2020). Predictive maintenance on event logs: Application on an ATM fleet. arXiv preprint arXiv:2011.10996
2020 arXiv
-
[17]
He, W., & Jiang, Z. (2023). A survey on uncertainty quantification methods for deep neural networks: An uncertainty source perspective. Perspective, 1, 88
2023
-
[18]
C., & Mathew, J
Heng, A., Zhang, S., Tan, A. C., & Mathew, J. (2009). Rotating machinery prognostics: State of the art, challenges and opportunities. Mechanical Systems and Signal Processing, 23(3), 724–739. https://doi.org/10.1016/j.ymssp.2008.06.009
2009 doi
-
[19]
Holmer, O., Frisk, E., & Krysander, M. (2023). Energy-based survival models for predictive maintenance. IFAC-PapersOnLine, 56(2), 10862--10867
2023
-
[20]
Hüllermeier, E., & Waegeman, W. (2021). Aleatoric and epistemic uncertainty in machine learning: An introduction to concepts and methods. Machine Learning, 110(3), 457--506
2021
-
[21]
B., Blackstone, E
Ishwaran, H., Kogalur, U. B., Blackstone, E. H., & Lauer, M. S. (2008). Random survival forests. The Annals of Applied Statistics, 2(3), 841--860. https://doi.org/10.1214/08-AOAS169
2008 doi
-
[22]
Iversen, P., Witzke, S., Baum, K., & Renard, B. Y. (2023). Identifying Drivers of Predictive Aleatoric Uncertainty. arXiv preprint arXiv:2312.07252
2023 arXiv
-
[23]
Jardine, A. K. S., Lin, D., & Banjevic, D. (2006). A review on machinery diagnostics and prognostics implementing condition-based maintenance. Mechanical Systems and Signal Processing, 20(7), 1483–1510. https://doi.org/10.1016/j.ymssp.2005.09.012
2006 doi
-
[24]
P., Kore, A
Kane, A. P., Kore, A. S., Khandale, A. N., Nigade, S. S., & Joshi, P. P. (2022). Predictive maintenance using machine learning. arXiv preprint arXiv:2205.09402
2022 arXiv
-
[25]
Kargar-Sharif-Abad, M., Kharazian, Z., Miliou, I., & Lindgren, T. (2024). SHAP-Driven Explainability in Survival Analysis for Predictive Maintenance Applications. In ECAI: European Conference on Artificial Intelligence, HAII5.0: Embracing Human-Aware AI in Industry 5.0
2024
-
[26]
S., & Deng, Q
Li, S., Barnard, A. S., & Deng, Q. (2024). Practical attribution guidance for Rashomon sets. *arXiv preprint arXiv:2407.18482*
2024 arXiv
-
[27]
M., Pannullo, F., Jakobsen, M
Lillelund, C. M., Pannullo, F., Jakobsen, M. O., Morante, M., & Pedersen, C. F. (2024). A probabilistic estimation of remaining useful life from censored time-to-event data. arXiv preprint arXiv:2405.01614
2024 arXiv
-
[28]
Marx, C., Calmon, F. D. P., & Ustun, B. (2020, November). Predictive multiplicity in classification. In International Conference on Machine Learning (pp. 6765--6774). PMLR
2020
-
[29]
L., Shaker, M
Nguyen, V. L., Shaker, M. H., & Hüllermeier, E. (2022). How to measure uncertainty in uncertainty sampling for active learning. Machine Learning, 111(1), 89-122
2022
-
[30]
Pinciroli, L., Baraldi, P., & Zio, E. (2023). Maintenance optimization in Industry 4.0. Reliability Engineering & System Safety, 234, 109204. https://doi.org/10.1016/j.ress.2023.109204
2023
-
[31]
S., Rögnvaldsson, T., & Choudhury, S
Rahat, M., Kharazian, Z., Mashhadi, P. S., Rögnvaldsson, T., & Choudhury, S. (2023, September). Bridging the gap: A comparative analysis of regressive remaining useful life prediction and survival analysis methods for predictive maintenance. In PHM Society Asia-Pacific Confere...
2023
-
[32]
Rudin, C., Zhong, C., Semenova, L., Seltzer, M., Parr, R., Liu, J., & Boner, Z. (2024). Amazing things come from having many good models. arXiv preprint arXiv:2407.04846
2024 arXiv
-
[33]
(2008, October)
Saxena, A., Goebel, K., Simon, D., & Eklund, N. (2008, October). Damage propagation modeling for aircraft engine run-to-failure simulation. In 2008 International Conference on Prognostics and Health Management (pp. 1-9). IEEE
2008
-
[34]
Schwabacher, M. (2005). A survey of data-driven prognostics. Proceedings of the AIAA Infotech@Aerospace Conference, 1–5. https://doi.org/10.2514/6.2005-7002
2005 doi
-
[35]
D., Nourelfath, M., & Hajji, A
Shoorkand, H. D., Nourelfath, M., & Hajji, A. (2024). A hybrid deep learning approach to integrate predictive maintenance and production planning for multi-state systems. Journal of Manufacturing Systems, 74, 397--410
2024
-
[36]
Simson, J., Pfisterer, F., & Kern, C. (2024). One model, many scores: using multiverse analysis to prevent fairness hacking and evaluate the influence of model design decisions. In Proceedings of the 2024 ACM Conference on Fairness, Accountability, and Transparency (pp. 1305--1320)
2024
-
[37]
Sipos, R., Fradkin, D., Moerchen, F., & Wang, Z. (2014). Log-based predictive maintenance. Proceedings of the 20th ACM SIGKDD International Conference on Knowledge Discovery and Data Mining, 1867–1876. https://doi.org/10.1145/2623330.2623348
2014
-
[38]
Sokol, K., Kull, M., Chan, J., & Salim, F. (2024). Cross-model fairness: Empirical study of fairness and ethics under model multiplicity. ACM Journal on Responsible Computing, 1(3), 1--27
2024
-
[39]
(2021, September)
Vollert, S., & Theissler, A. (2021, September). Challenges of machine learning-based RUL prognosis: A review on NASA's C-MAPSS data set. In 2021 26th IEEE International Conference on Emerging Technologies and Factory Automation (ETFA) (pp. 1--8). IEEE
2021
-
[40]
C., & Ustun, B
Watson-Daniels, J., Parkes, D. C., & Ustun, B. (2023, June). Predictive multiplicity in probabilistic classification. In Proceedings of the AAAI Conference on Artificial Intelligence, 37(9), 10306--10314
2023
-
[41]
M., & Chouldechova, A
Watson-Daniels, J., Barocas, S., Hofman, J. M., & Chouldechova, A. (2023, June). Multi-target multiplicity: Flexibility and fairness in target specification under resource constraints. In Proceedings of the 2023 ACM Conference on Fairness, Accountability, and Transparency (pp....
2023
-
[42]
Widodo, A., & Yang, B.-S. (2007). Support vector machine in machine condition monitoring and fault diagnosis. Mechanical Systems and Signal Processing, 21(6), 2560–2574. https://doi.org/10.1016/j.ymssp.2006.12.007
2007 doi
-
[43]
Yang, Z., Kanniainen, J., Krogerus, T., & Emmert-Streib, F. (2022). Prognostic modeling of predictive maintenance with survival analysis for mobile work equipment. Scientific Reports, 12(1), 8529
2022
-
[44]
Yardimci, Y., & Cavus, M. (2025). Rashomon perspective for measuring uncertainty in the survival predictive maintenance models. arXiv preprint arXiv:2502.15772
2025 arXiv
-
[45]
Zeng, C., Huang, J., Wang, H., Xie, J., & Zhang, Y. (2023). Deep Bayesian survival analysis of rail useful lifetime. Engineering Structures, 295, 116822
2023
-
[46]
Zhao, R., Yan, R., Chen, Z., Mao, K., Wang, P., & Gao, R. X. (2019). Deep learning and its applications to machine health monitoring. Mechanical Systems and Signal Processing, 115, 213–237. https://doi.org/10.1016/j.ymssp.2018.05.050
2019 doi
Reviewed August 16, 2026 · model on record in the stance chip above.
Discussion (0). Continue with ORCID to comment.