REVIEW 4 major objections 5 minor 35 references
Real-IAD D3: A Real-World 2D/Pseudo-3D/3D Dataset for Industrial Anomaly Detection
T0 review · 4 major / 5 minor · reviewed 2026-08-16 · deepseek-v4-flash
Pith's one-line read Real-IAD D3 adds photometric-stereo pseudo-3D views to RGB and micrometer point clouds and reports that the three-modality fusion beats every 2D-only and 2D+3D baseline on average.
desk verdict Real-IAD D3 is a potentially valuable dataset with a genuinely new pseudo-3D modality, but the paper overclaims the method's consistency and never validates the photometric-stereo output. read the letter →
The pith
A machine-rendered reading of the paper's core claim, the machinery that carries it, and where it could break.
The reading
What carries the argument
The load-bearing mechanism is photometric stereo: four directional light sources illuminate each part, and the pixel intensities $I(x,y)$ are converted to surface normals by solving $n(x,y) = (L^\top L)^{-1} L^\top I(x,y)$, where $L$ is the known light-direction matrix. The result is a pseudo-3D image of surface orientation that encodes shallow defects as sudden normal changes. On top of this, the D3M benchmark adds a Channel-Spatial Swapping module that exchanges 10% of RGB and pseudo-3D feature-map channels and spatial blocks, an unsupervised contrastive loss that aligns swapped 2D patches with point-cloud patches, and three memory banks scored by one-class SVMs to produce image-level and pixel-level anomaly maps. The 3D point clouds are captured on the same platform with a four-direction DLP structured-light system, which the paper credits for the strict RGB/3D/pseudo-3D alignment.
What would settle it
Take the glossy categories (for example ferrite bead, dc power connector, or knob cap), compute the photometric-stereo normal maps, and compare them against normals derived from the 0.002 mm point clouds; if the pseudo-3D normals deviate systematically in specular regions, rerun the D3M benchmark on only the matte categories and on only the glossy categories. The central claim would be settled by showing whether the pseudo-3D gain is present in the glossy subset or comes entirely from diffuse materials.
Extended reading notes
Core claim
Real-IAD D3's core discovery is that a pseudo-3D modality obtained by photometric stereo is a usable third signal for unsupervised industrial anomaly detection, not just a substitute for measured 3D. The dataset contains 5,000 normal and 3,450 anomalous samples across 20 categories with 69 defect groups, covers defect areas as small as 0.46% of the part, and captures point clouds of up to 16.2 million points at 0.002 mm accuracy. The authors argue that pseudo-3D surface normals reveal shallow texture and orientation defects that are hard to see in RGB and too small for coarser point clouds, and their D3M benchmark backs this with average I-AUROC 0.890 and P-AUROC 0.937, outperforming the 2D+3D M3DM baseline and a 2D+pseudo-3D PatchCore combination. In their framing, strictly aligned multimodal capture on a single platform is what makes the fusion possible, and the additional modality raises the ceiling for fine-defect localization.
Load-bearing premise
The pseudo-3D views are computed by assuming each surface scatters light evenly from a known direction, which is false for shiny metal and plastic parts; if that assumption breaks on enough categories, the third modality adds noise rather than signal and the reported gain over 2D+3D would not survive.
Editorial extensions
If this is right
- Photometric-stereo pseudo-3D should be treated as a complementary third channel rather than a replacement for scanned 3D, since the full three-modality fusion gives the best scores.
- The 2D+pseudo-3D combination already shows strong average scores in the paper's PatchCore-style comparison, so adding a four-light capture stage may yield a large part of the fusion gain even before measured 3D is included.
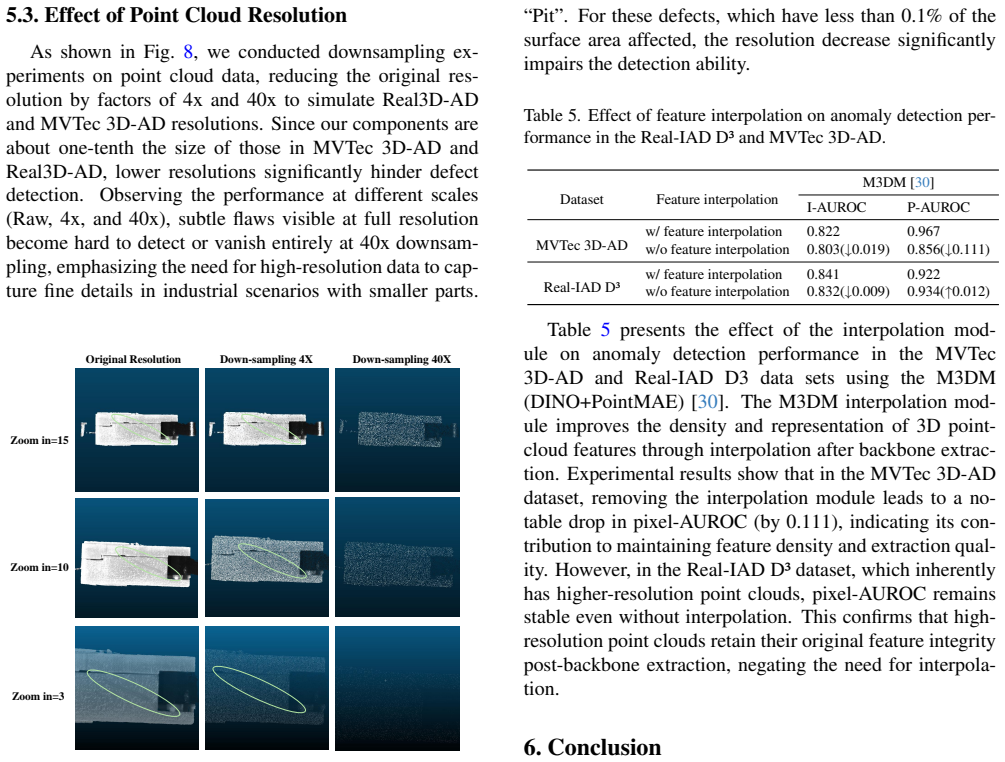
- Resolution is decisive for small components: downsampling point clouds by 4x or 40x degrades detection of scratches and pits, so micrometer-level capture is necessary rather than optional in this regime.
- The high native point-cloud density removes the need for post-backbone feature interpolation on Real-IAD D3, whereas on MVTec 3D-AD pixel-AUROC drops by 0.111 without it; practitioners can skip interpolation when raw resolution is high.
Reading between the lines
- One consequence the paper leaves implicit is that the pseudo-3D channel inherits photometric stereo's diffuse-reflection assumption; on shiny metal and plastic parts the normal equation can produce artifacts, so a material-wise breakdown of the 0.890 average could reveal categories where the third modality hurts.
- Because RGB, pseudo-3D, and point clouds are captured by one fixed rig, part of the fusion gain may be specific to that alignment; running D3M on a different acquisition setup would test whether the benefit transfers.
- The near-parity of the 2D+pseudo-3D result with the full three-modality result suggests measured 3D pays off mainly on larger geometric defects, so a per-defect-type analysis could tell practitioners when micrometer point-cloud hardware is worth the cost.
Signed reviews
Editorial analysis
A structured set of objections, weighed in public.
Referee Report
Summary. The paper introduces Real-IAD D3, a multimodal industrial anomaly detection dataset containing 8,450 samples across 20 product categories, with synchronized high-resolution RGB images, micrometer-level 3D point clouds (precision 0.002 mm), and a pseudo-3D modality computed via four-light photometric stereo. The authors also propose D3M, a benchmark method that fuses RGB, pseudo-3D, and point-cloud features using channel-spatial swapping, unsupervised contrastive alignment, and multi-bank decision fusion. Experiments report average I-AUROC 0.890 and P-AUROC 0.937 for D3M on the proposed dataset, outperforming single-modality and 2D+3D baselines on average. The paper also includes resolution-downsampling and feature-interpolation analyses to highlight the value of high-resolution point clouds.
Significance. If the dataset is released as described, it would be a substantial resource for the IAD community: it is larger and higher-resolution than MVTec 3D-AD and Real3D-AD, covers 69 defect groups across diverse real-world materials, and provides synchronized 2D/pseudo-3D/3D data with public access. The pseudo-3D modality is a novel contribution that could aid detection of subtle surface defects, though its validity on glossy and textured materials is not yet demonstrated. The D3M benchmark is a useful baseline but is largely composed of existing components (DINO, PointMAE, M3DM-style contrastive fusion and decision layers); its methodological novelty is limited. The average performance gains over M3DM are real, but the paper's stronger claim of 'consistently surpassing' all 2D+3D methods is contradicted by the per-category numbers, and the ablations do not isolate the pseudo-3D contribution. The paper would become publishable after a major revision that validates the pseudo-3D modality and corrects or qualifies the performance claims.
major comments (4)
- [§5.1, Table 2] The claim that D3M 'consistently surpasses' 2D+3D methods is contradicted by the per-category results. For example, on miniature_lifting_motor the I-AUROC drops from 0.975 (M3DM) to 0.823 (D3M), and on power_jack it drops from 0.996 to 0.973. In addition, D3M is worse than M3DM on P-AUROC in at least eight categories (connector_housing_female 0.951 vs 0.979, dc_power_connector 0.947 vs 0.950, ethernet_connector 0.970 vs 0.978, fork_crimp_terminal 0.946 vs 0.964, fuse_holder 0.915 vs 0.948, lattice_block_plug 0.941 vs 0.958, miniature_lifting_motor 0.961 vs 0.991, purple_clay_pot 0.922 vs 0.953). The paper should be revised to state that D3M achieves the best average performance, not consistent per-category superiority, and the authors should discuss the categories where the additional pseudo-3D modality degrades performance.
- [§5.2, Table 3] The experimental design does not isolate the contribution of the pseudo-3D modality. D3M differs from M3DM in several architectural components (CSS swapping, contrastive fusion with swapped 2D features, and a triple memory bank), so the improvement of D3M over M3DM in Table 2 cannot be attributed to the pseudo-3D input alone. Moreover, Table 3 reports M3DM(2D+3D) with I-AUROC 0.752 and P-AUROC 0.687, which is inconsistent with the M3DM averages in Table 2 (0.841 I-AUROC, 0.922 P-AUROC) and is not explained in the text. The authors should provide a controlled ablation that runs the same architecture with and without the pseudo-3D modality, and they must reconcile the M3DM numbers between Table 2 and Table 3.
- [§3.1, photometric stereo equation] The pseudo-3D modality is generated by solving n = (L^T L)^{-1} L^T I under the assumption of Lambertian reflectance, known fixed light directions, and no shadows or interreflections. Many of the 20 categories are glossy metals and plastics (ferrite_bead, power_jack, headphone_jack_socket, dc_power_connector), where specularities violate the Lambertian assumption. The paper provides no calibration details for the light directions, no albedo normalization, and, critically, no validation of the recovered normal maps against the co-captured micrometer-level point clouds. Without such validation, the pseudo-3D modality could be a corrupted signal, and the headline claim that this modality improves detection is not established. I request that the authors add either a quantitative comparison of the photometric-stereo normals against the 3D scans on representative categories or an ablation in which the pseudo-3D channel is replaced by a noise or constant signal, to demonstrate that the performance gain is specifically due to meaningful surface-orientation information.
- [Throughout (Sec. 3.1, Fig. 2, Fig. 3)] The paper interchangeably calls the photometric-stereo output 'pseudo-3D depth' and 'pseudo-3D surface normals', but Eq. (1) and Eq. (2) estimate a surface normal field, not depth. This is a conceptual mismatch that affects how readers and downstream methods interpret the modality. The authors should consistently describe the modality as surface normals (or, if they truly intend depth, explain how depth is integrated from normals) and adjust the text, captions, and figures accordingly.
minor comments (5)
- [Throughout] There are several typos and inconsistencies: 'Pesudo-3D' in Table 3 and Figure 7, 'Tabel' in Table 3 caption, and inconsistent category names (e.g., 'common-mode-filter' vs 'commonmodefilter', 'connector_housing-female' vs 'connectorhousing-female'). These should be standardized.
- [Abstract and Sec. 1] The URL in the abstract contains a space ('realiad4ad.github.io/Real-IAD D3'); it should be corrected to a proper link, e.g., 'https://realiad4ad.github.io/Real-IAD-D3'.
- [Table 1] The table lists '3D Point-Cloud Resolution' as 0.01 mm and 'Point Precision' as 0.002 mm, but the text in Sec. 3 says 'accuracy of 0.002 mm' and 'four-point cloud resolutions'. The relationship between resolution, precision, and accuracy should be defined clearly to avoid confusion.
- [Sec. 5.3, Table 4] Table 4 reports PointMAE at Original vs 4x resolution but does not include the 40x condition shown in Fig. 8; the text and figure should be consistent about which downsampling factors are evaluated quantitatively.
- [Fig. 8] The figure labels 'Zoom in=15', 'Zoom in=10', and 'Zoom in=3' are not explained in the text or caption; please clarify what these values represent.
Circularity Check
No significant circularity: the dataset construction and D3M benchmark are self-contained, and self-citations to Real-IAD and M3DM are lineage/method borrowings rather than load-bearing derivations.
full rationale
Walking the derivation chain from dataset construction (Sec. 3.1) through the D3M benchmark (Sec. 4) to the experimental claims (Sec. 5), no load-bearing step reduces to its inputs by construction. The pseudo-3D modality is produced by a standard photometric-stereo least-squares solve n=(L^T L)^{-1} L^T I from four directional images; this is an independent data-generation formula, not a target-valued fit. The D3M benchmark borrows the M3DM contrastive fusion idea and one-class SVM decision layer, with the only hand-set fusion ratio alpha=0.1; alpha is not fitted to I-AUROC/P-AUROC, and the reported averages are measured on a held benchmark rather than derived from the dataset statistics. Self-citations to Real-IAD [28] and M3DM [30] are lineage and method attribution, not uniqueness theorems or assumptions that entail the D3M results. Concerns that the Lambertian assumption may be violated on glossy categories, or that per-category numbers (e.g., connector_housing_female P-AUROC 0.951 vs M3DM 0.979) weaken the claim of consistent improvement, are empirical validity and robustness issues, not circularity. I therefore find no significant circularity; the minimal score reflects only the presence of non-load-bearing self-citations.
Assumptions & free parameters
free parameters (2)
- CSS swapping ratio alpha =
0.1
- CSS block size k =
unspecified
assumptions (3)
- domain assumption Photometric stereo under Lambertian reflectance with calibrated four-light directions recovers true surface normals
- domain assumption Pretrained DINO and PointMAE features transfer well to industrial defect detection
- domain assumption Pixel-level annotations are accurate and consistent across all samples
Cite this review
Pith. "Pith review of Real-IAD D3: A Real-World 2D/Pseudo-3D/3D Dataset for Industrial Anomaly Detection." pith.science (2026). https://pith.science/paper/TAUKEN7F
@misc{pith2026250414221,
  author       = {Pith},
  title        = {Pith review of: Real-IAD D3: A Real-World 2D/Pseudo-3D/3D Dataset for Industrial Anomaly Detection},
  year         = {2026},
  howpublished = {\url{https://pith.science/paper/TAUKEN7F}},
  note         = {Machine review of arXiv:2504.14221}
}
read the original abstract
The increasing complexity of industrial anomaly detection (IAD) has positioned multimodal detection methods as a focal area of machine vision research. However, dedicated multimodal datasets specifically tailored for IAD remain limited. Pioneering datasets like MVTec 3D have laid essential groundwork in multimodal IAD by incorporating RGB+3D data, but still face challenges in bridging the gap with real industrial environments due to limitations in scale and resolution. To address these challenges, we introduce Real-IAD D3, a high-precision multimodal dataset that uniquely incorporates an additional pseudo3D modality generated through photometric stereo, alongside high-resolution RGB images and micrometer-level 3D point clouds. Real-IAD D3 features finer defects, diverse anomalies, and greater scale across 20 categories, providing a challenging benchmark for multimodal IAD Additionally, we introduce an effective approach that integrates RGB, point cloud, and pseudo-3D depth information to leverage the complementary strengths of each modality, enhancing detection performance. Our experiments highlight the importance of these modalities in boosting detection robustness and overall IAD performance. The dataset and code are publicly accessible for research purposes at https://realiad4ad.github.io/Real-IAD D3
Figures


Figures from the paper (5 more)


Reference graph
Works this paper leans on
-
[1]
Anomaly detection in 3d point clouds using deep geometric descriptors
Paul Bergmann and David Sattlegger. Anomaly detection in 3d point clouds using deep geometric descriptors. In Pro- ceedings of the IEEE/CVF Winter Conference on Applica- tions of Computer Vision, pages 2613–2623, 2023. 2
work page 2023
-
[2]
Mvtec ad–a comprehensive real-world dataset for unsupervised anomaly detection
Paul Bergmann, Michael Fauser, David Sattlegger, and Carsten Steger. Mvtec ad–a comprehensive real-world dataset for unsupervised anomaly detection. In Proceedings of the IEEE/CVF conference on computer vision and pattern recognition, pages 9592–9600, 2019. 1, 2
work page 2019
-
[3]
Uninformed students: Student-teacher anomaly detection with discriminative latent embeddings
Paul Bergmann, Michael Fauser, David Sattlegger, and Carsten Steger. Uninformed students: Student-teacher anomaly detection with discriminative latent embeddings. In Proceedings of the IEEE/CVF conference on computer vi- sion and pattern recognition, pages 4183–4192, 2020. 2
2020
-
[4]
The mvtec 3d-ad dataset for unsupervised 3d anomaly detection and localization
Paul Bergmann, Xin Jin, David Sattlegger, and Carsten Ste- ger. The mvtec 3d-ad dataset for unsupervised 3d anomaly detection and localization. arXiv preprint arXiv:2112.09045,
-
[5]
The eyecandies dataset for unsupervised multimodal anomaly detection and local- ization
Luca Bonfiglioli, Marco Toschi, Davide Silvestri, Nicola Fioraio, and Daniele De Gregorio. The eyecandies dataset for unsupervised multimodal anomaly detection and local- ization. In Proceedings of the Asian Conference on Com- puter Vision, pages 3586–3602, 2022. 2, 3
work page 2022
-
[6]
A sur- vey on visual anomaly detection: Challenge, approach, and prospect
Yunkang Cao, Xiaohao Xu, Jiangning Zhang, Yuqi Cheng, Xiaonan Huang, Guansong Pang, and Weiming Shen. A sur- vey on visual anomaly detection: Challenge, approach, and prospect. arXiv preprint arXiv:2401.16402, 2024. 1, 2, 3
arXiv 2024
-
[7]
Easynet: An efficient network for 3d industrial anomaly detection
Ruitao Chen, Guoyang Xie, Jiaqi Liu, Jinbao Wang, Ziqi Luo, Jinfan Wang, and Feng Zheng. Easynet: An efficient network for 3d industrial anomaly detection. In Proceedings of the ACM International Conference on Multimedia , pages 7038–7046, 2023. 2
work page 2023
-
[8]
Xuhai Chen, Yue Han, and Jiangning Zhang. A zero-/few- shot anomaly classification and segmentation method for cvpr 2023 vand workshop challenge tracks 1&2: 1st place on zero-shot ad and 4th place on few-shot ad. arXiv preprint arXiv:2305.17382, 2023. 3
arXiv 2023
Show all 35 references
-
[9]
Shape-guided dual-memory learning for 3d anomaly detection
Yu-Min Chu, Chieh Liu, Ting-I Hsieh, Hwann-Tzong Chen, and Tyng-Luh Liu. Shape-guided dual-memory learning for 3d anomaly detection. In Proceedings of the 40th Interna- tional Conference on Machine Learning , pages 6185–6194,
-
[10]
Padim: a patch distribution modeling framework for anomaly detection and localization
Thomas Defard, Aleksandr Setkov, Angelique Loesch, and Romaric Audigier. Padim: a patch distribution modeling framework for anomaly detection and localization. In Inter- national Conference on Pattern Recognition, pages 475–489. Springer, 2021. 2
2021
-
[11]
Anomaly detection via reverse distillation from one-class embedding
Hanqiu Deng and Xingyu Li. Anomaly detection via reverse distillation from one-class embedding. In Proceedings of the IEEE/CVF Conference on Computer Vision and Pattern Recognition, pages 9737–9746, 2022. 1
2022
-
[12]
Cflow-ad: Real-time unsupervised anomaly detection with compact neural flow
Denis Gudovskiy et al. Cflow-ad: Real-time unsupervised anomaly detection with compact neural flow. IEEE Transac- tions on Artificial Intelligence, page 2022, 2022. 1, 2, 3
2022
-
[13]
A diffusion-based framework for multi-class anomaly detection
Haoyang He, Jiangning Zhang, Hongxu Chen, Xuhai Chen, Zhishan Li, Xu Chen, Yabiao Wang, Chengjie Wang, and Lei Xie. A diffusion-based framework for multi-class anomaly detection. In Proceedings of the AAAI Conference on Artifi- cial Intelligence, pages 8472–8480, 2024. 3
2024
-
[14]
Learning unified reference rep- resentation for unsupervised multi-class anomaly detection
Liren He, Zhengkai Jiang, Jinlong Peng, Liang Liu, Qian- gang Du, Xiaobin Hu, Wenbing Zhu, Mingmin Chi, Yabiao Wang, and Chengjie Wang. Learning unified reference rep- resentation for unsupervised multi-class anomaly detection. arXiv preprint arXiv:2403.11561, 2024. 3
2024 arXiv
-
[15]
Back to the feature: clas- sical 3d features are (almost) all you need for 3d anomaly detection
Eliahu Horwitz and Yedid Hoshen. Back to the feature: clas- sical 3d features are (almost) all you need for 3d anomaly detection. In Proceedings of the IEEE/CVF Conference on Computer Vision and Pattern Recognition , pages 2967– 2976, 2023. 2
2023
-
[16]
Winclip: Zero- /few-shot anomaly classification and segmentation
Jongheon Jeong, Yang Zou, Taewan Kim, Dongqing Zhang, Avinash Ravichandran, and Onkar Dabeer. Winclip: Zero- /few-shot anomaly classification and segmentation. In Pro- ceedings of the IEEE/CVF Conference on Computer Vision and Pattern Recognition, pages 19606–19616, 2023. 3
2023
-
[17]
Pyramid- flow: High-resolution defect contrastive localization using pyramid normalizing flow
Jiarui Lei, Xiaobo Hu, Yue Wang, and Dong Liu. Pyramid- flow: High-resolution defect contrastive localization using pyramid normalizing flow. In Proceedings of the IEEE/CVF Conference on Computer Vision and Pattern Recognition , pages 14143–14152, 2023. 2
2023
-
[18]
Promptad: Learn- ing prompts with only normal samples for few-shot anomaly detection
Xiaofan Li, Zhizhong Zhang, Xin Tan, Chengwei Chen, Yanyun Qu, Yuan Xie, and Lizhuang Ma. Promptad: Learn- ing prompts with only normal samples for few-shot anomaly detection. In Proceedings of the IEEE/CVF Conference on Computer Vision and Pattern Recognition , pages 16838– 1...
2024
-
[19]
Real3d- ad: A dataset of point cloud anomaly detection
Jiaqi Liu, Guoyang Xie, Ruitao Chen, Xinpeng Li, Jinbao Wang, Yong Liu, Chengjie Wang, and Feng Zheng. Real3d- ad: A dataset of point cloud anomaly detection. Advances in Neural Information Processing Systems, 36, 2024. 3
2024
-
[20]
Model- ing the distribution of normal data in pre-trained deep fea- tures for anomaly detection
Oliver Rippel, Patrick Mertens, and Dorit Merhof. Model- ing the distribution of normal data in pre-trained deep fea- tures for anomaly detection. In 2020 25th International Con- ference on Pattern Recognition (ICPR) , pages 6726–6733. IEEE, 2021. 2
2020
-
[21]
Towards to- tal recall in industrial anomaly detection
Karsten Roth, Latha Pemula, Joaquin Zepeda, Bernhard Sch¨olkopf, Thomas Brox, and Peter Gehler. Towards to- tal recall in industrial anomaly detection. In Proceedings of the IEEE/CVF Conference on Computer Vision and Pattern Recognition (CVPR), pages 14318–14328, 2022. 2, 7
2022
-
[22]
Towards to- tal recall in industrial anomaly detection
Karsten Roth, Latha Pemula, Joaquin Zepeda, Bernhard Sch¨olkopf, Thomas Brox, and Peter Gehler. Towards to- tal recall in industrial anomaly detection. In Proceedings of the IEEE/CVF Conference on Computer Vision and Pattern Recognition, pages 14318–14328, 2022. 2
2022
-
[23]
Asymmetric student-teacher networks for indus- trial anomaly detection
Marco Rudolph, Tom Wehrbein, Bodo Rosenhahn, and Bas- tian Wandt. Asymmetric student-teacher networks for indus- trial anomaly detection. In Proceedings of the IEEE/CVF Winter Conference on Applications of Computer Vision , pages 2592–2602, 2023. 2
2023
-
[24]
Multiresolution knowledge distillation for anomaly detection
Mohammadreza Salehi, Niousha Sadjadi, Soroosh Baselizadeh, Mohammad H Rohban, and Hamid R Ra- biee. Multiresolution knowledge distillation for anomaly detection. In Proceedings of the IEEE/CVF confer- ence on computer vision and pattern recognition , pages 14902–14912, 2021
2021
-
[25]
Revisiting reverse distillation for anomaly detection
Tran Dinh Tien, Anh Tuan Nguyen, Nguyen Hoang Tran, Ta Duc Huy, Soan Duong, Chanh D Tr Nguyen, and Steven QH Truong. Revisiting reverse distillation for anomaly detection. In Proceedings of the IEEE/CVF Con- ference on Computer Vision and Pattern Recognition, pages 24511–24520...
2023
-
[26]
Position encoding enhanced feature mapping for image anomaly detection
Qian Wan, Yunkang Cao, Liang Gao, Weiming Shen, and Xinyu Li. Position encoding enhanced feature mapping for image anomaly detection. In 2022 IEEE 18th Interna- tional Conference on Automation Science and Engineering (CASE), pages 876–881. IEEE, 2022. 3
2022
-
[27]
Pspu: Enhanced positive and unlabeled learning by leveraging pseudo super- vision
Chengjie Wang, Chengming Xu, Zhenye Gan, Yuxi Li, Jian- long Hu, Wenbing Zhu, and Lizhuang Ma. Pspu: Enhanced positive and unlabeled learning by leveraging pseudo super- vision. In 2024 IEEE International Conference on Multime- dia and Expo (ICME), pages 1–6. IEEE, 2024. 2
2024
-
[28]
Real-iad: A real-world multi-view dataset for benchmarking versatile industrial anomaly detec- tion
Chengjie Wang, Wenbing Zhu, Bin-Bin Gao, Zhenye Gan, Jiangning Zhang, Zhihao Gu, Shuguang Qian, Mingang Chen, and Lizhuang Ma. Real-iad: A real-world multi-view dataset for benchmarking versatile industrial anomaly detec- tion. In Proceedings of the IEEE/CVF Conference on Com-...
-
[29]
Softpatch+: Fully un- supervised anomaly classification and segmentation
Chengjie Wang, Xi Jiang, Bin-Bin Gao, Zhenye Gan, Yong Liu, Feng Zheng, and Lizhuang Ma. Softpatch+: Fully un- supervised anomaly classification and segmentation. Pattern Recognition, 161:111295, 2025. 2
2025
-
[30]
Multimodal industrial anomaly detection via hybrid fusion
Yue Wang, Jinlong Peng, Jiangning Zhang, Ran Yi, Yabiao Wang, and Chengjie Wang. Multimodal industrial anomaly detection via hybrid fusion. InProceedings of the IEEE/CVF Conference on Computer Vision and Pattern Recognition , pages 8032–8041, 2023. 2, 5, 6, 7, 8
2023
-
[31]
Pushing the limits of fewshot anomaly detection in industry vision: Graphcore
Guoyang Xie et al. Pushing the limits of fewshot anomaly detection in industry vision: Graphcore. International Con- ference on Learning Representations (ICLR), 2022. 3
2022
-
[32]
A unified model for multi-class anomaly detection
Zhiyuan You, Lei Cui, Yujun Shen, Kai Yang, Xin Lu, Yu Zheng, and Xinyi Le. A unified model for multi-class anomaly detection. In Advances in Neural Information Pro- cessing Systems, pages 4571–4584. Curran Associates, Inc.,
-
[33]
Cheat- ing depth: Enhancing 3d surface anomaly detection via depth simulation
Vitjan Zavrtanik, Matej Kristan, and Danijel Sko ˇcaj. Cheat- ing depth: Enhancing 3d surface anomaly detection via depth simulation. In Proceedings of the IEEE/CVF Winter Confer- ence on Applications of Computer Vision, pages 2164–2172,
-
[34]
Lingrui Zhang et al. What makes a good data augmentation for few-shot unsupervised image anomaly detection? InPro- ceedings of the IEEE/CVF Conference on Computer Vision and Pattern Recognition, pages 4344–4353, 2023. 3
2023
-
[35]
Spot-the- difference: A novel benchmark for image anomaly detection in industrial inspection
Zongyi Zou, Qiang Qiu, and Weiming Shen. Spot-the- difference: A novel benchmark for image anomaly detection in industrial inspection. In Proceedings of the IEEE/CVF International Conference on Computer Vision, pages 2608– 2616, 2022. 1, 2 A. Expanded Details of the Real-IAD D...
2022
Reviewed August 16, 2026 · model on record in the stance chip above.
Discussion (0). Continue with ORCID to comment.