REVIEW 3 major objections 5 minor 44 references
A Low-Cost Photogrammetry System for 3D Plant Modeling and Phenotyping
T0 review · 3 major / 5 minor · reviewed 2026-08-16 · deepseek-v4-flash
Pith's one-line read This paper claims that a low-cost, open-source photogrammetry system can reconstruct wheat plants as 3D point clouds and extract canopy traits that predict expert architecture ratings.
desk verdict A genuinely useful low-cost photogrammetry system with open data and code, but the architecture-classification results don't establish generalization to new varieties because genotypes leak across the train/test split. read the letter →
The pith
A machine-rendered reading of the paper's core claim, the machinery that carries it, and where it could break.
The reading
What carries the argument
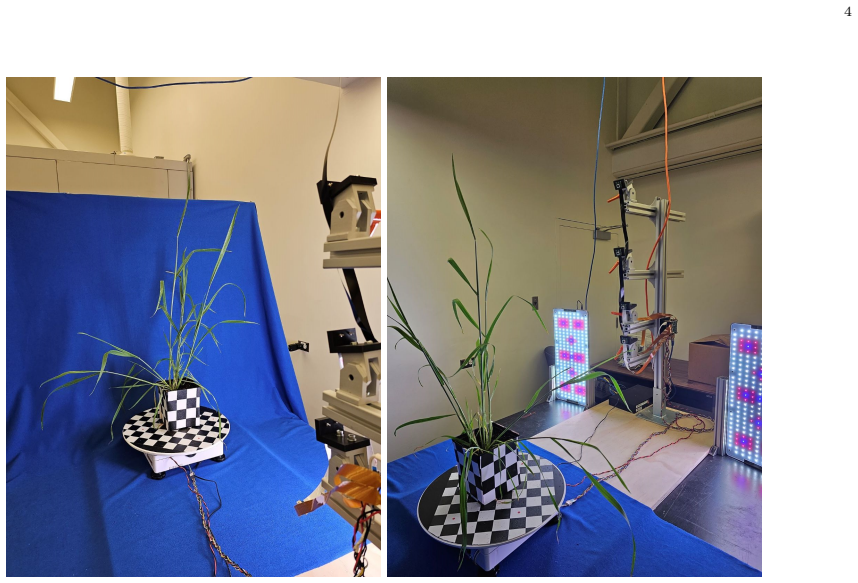
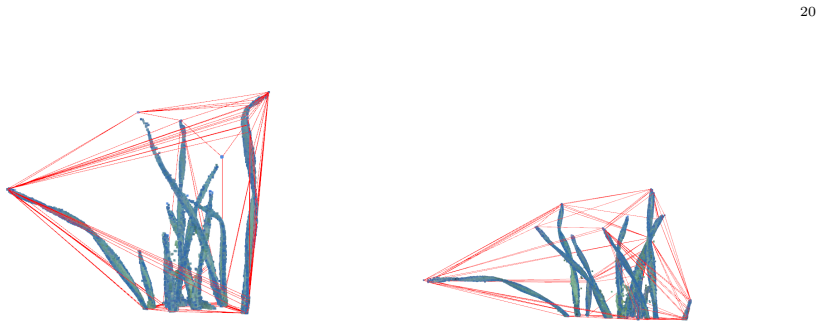
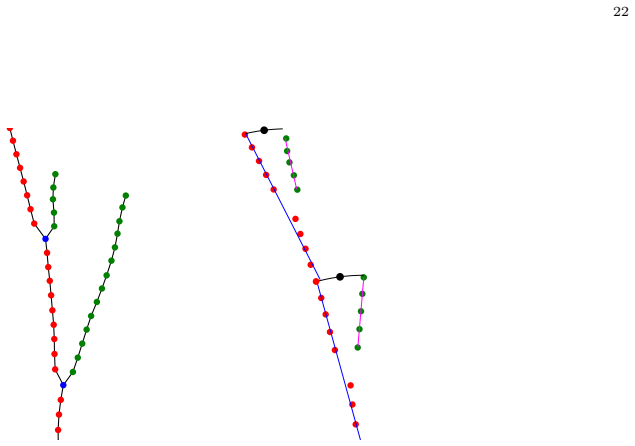
The mechanism is a complete imaging-and-processing pipeline. Four cameras mounted in an arc photograph the plant while a motorized turntable rotates it step by step, and structure-from-motion software turns those overlapping images into a dense 3D point cloud. The load-bearing scaling step identifies the turntable's outer ring from a radial-distance histogram and uses its known physical diameter to convert reconstructed coordinates into real-world units; RANSAC plane fitting then aligns the turntable plane with z=0. Trait extraction operates on the cleaned cloud: an alpha-shape, a generalization of the convex hull, computes ground-cover area; slice-wise density-based clustering with a directed-graph stem path computes leaf angles; and standard computations give height, radius, and convex-hull volumes.
What would settle it
Take a set of reconstructed wheat plants and compare the scaled point-cloud height, maximum radius, convex-hull volume, and leaf angles against direct manual or calibrated measurements on the same plants. If the ring-based scale or plane alignment carries systematic error, visible as a consistent offset in height or radius, then the trait values, and therefore the regression and k-NN ratings, are not measuring what they claim. A simpler check is to rerun the architecture regressions using only unscaled point-cloud features; if predictive power survives, the metric scaling is not load-bearing.
Extended reading notes
Core claim
The central claim is that structure-from-motion reconstruction from overlapping images of a rotating plant produces point clouds rich enough for quantitative phenotyping. After the clouds are aligned to the turntable plane and scaled using the known diameter of the turntable ring, the authors extract phenotypic traits and show that these traits, and ratios of traits, are predictive of an expert's subjective canopy-architecture rating. On held-out plants, the best multiple linear regression reaches R²=0.72 with MAE=1.73 for 14-day-old plants, and the best k-nearest-neighbor model reaches R²=0.81 with MAE=1.00 for 35-day-old plants. The authors frame this as a proof of concept that the system's features can directly support breeding-relevant questions, rather than as a predictor of manual measurements.
Load-bearing premise
The load-bearing premise is that the point-cloud coordinates are metrically accurate after scaling by the turntable-ring histogram and plane alignment, so that every extracted trait is a faithful proxy for the physical plant.
Editorial extensions
If this is right
- If the system is correct, a researcher can obtain, for under $3,000 CAD and with open-source software, quantitative plant traits that currently require expensive laser scanning or tedious manual measurement.
- The held-out test results indicate that objective trait-based models can approximate expert canopy-architecture ratings closely enough to rank or triage varieties, with the day-35 k-NN model achieving MAE 1.00.
- The trait set, including height, radius, hull volumes, ground cover, and leaf angles, becomes a reusable feature vocabulary for wheat phenotyping because each trait is computed from the same point cloud.
- Feature ratios such as height-to-hull-volume being selected by both predictive models suggest that normalized, size-relative traits generalize better across growth stages, giving a concrete design rule for future phenotyping pipelines.
Reading between the lines
- A direct metric-validation study, comparing point-cloud height, radius, and leaf angles against manual ruler and protractor measurements on the same plants, would cleanly separate reconstruction error from trait-algorithm error; the paper currently validates only through the expert-rating proxy.
- The acquisition and trait pipeline should transfer to other small upright crops, since the leaf-angle and ground-cover steps are not wheat-specific, though the authors only demonstrate wheat.
- Because expert ratings are assigned at the variety level while predictions are per-plant, part of the reported error is within-variety biological variation plus rater bias; averaging several expert ratings would likely sharpen ground truth and reduce apparent error.
- A field-deployable or multi-station version of the rig could raise throughput beyond roughly 25 minutes per plant without changing the core reconstruction logic, a direction the authors list as future work.
Signed reviews
Editorial analysis
A structured set of objections, weighed in public.
Referee Report
Summary. The paper presents an open-source, low-cost photogrammetry system for 3D plant reconstruction and phenotyping, built from a Raspberry Pi, four Arducam cameras, a motorized turntable, and aluminum framing. The software pipeline uses COLMAP for structure-from-motion reconstruction, followed by point-cloud alignment, turntable-ring-based scaling, color filtering, manual pot removal, and a semi-automated graph-based segmentation for multi-seedling pots. From the reconstructed point clouds, the authors extract traits including plant height, radius, convex-hull volumes, ground-cover projection area, and leaf angles. The main application claim is that these traits can predict expert-assigned erectophile versus planophile canopy-architecture ratings; they report multiple linear regression and k-NN results on held-out plants for day-14 and day-35 wheat datasets, with test MAE values of 1.73 (R2=0.72) and 1.00 (R2=0.81), respectively.
Significance. If the claims are supported, the system would be a useful, affordable, and reproducible tool for plant phenotyping: the hardware is inexpensive, the code and data are publicly released, and the trait extraction pipeline addresses realistic problems such as multi-plant segmentation and leaf-angle estimation. However, the central validation of the architecture-classification claim is weakened by a genotype-level label-leakage issue: each of the six varieties has a single expert rating, and the held-out test plants come from the same six varieties used in training. This means the reported test accuracies may reflect memorization of variety-level labels rather than generalization to unseen canopy architectures. The absence of direct metric validation against manual measurements or calibrated objects is a further concern, though less damaging because several features are ratios that are partially scale-invariant. Overall the contribution is technically substantial and reproducible, but the evidence for the headline phenotyping claim is currently inconclusive.
major comments (3)
- [VI-A; Tables VII and VIII] The evaluation protocol does not support the claim that the extracted traits objectively classify erectophile versus planophile architectures for new varieties. The expert assigned a single rating to all plants of each variety (Table IV), and the train/test split places 8 plants per variety in training and 2 per variety in the test set. Every test plant therefore belongs to a genotype whose rating appears in training. Under this protocol, k-NN with k=2 can succeed simply by retrieving same-genotype neighbors, and any genotype-correlated feature set (height, volume, hull, ground cover) can memorize the six labels. The effective number of independent test units is six, not twelve. Please report a genotype-level evaluation, such as leave-one-genotype-out predictions, or explicitly restrict the claim to ranking plants within already-known varieties.
- [IV-D; V-C] The metric accuracy of the reconstructed point clouds is asserted rather than demonstrated. Scaling depends on the turntable-ring histogram (Algorithm 2) and plane segmentation (Algorithm 1), but no comparison is made between HMax, RMax, convex-hull volumes, or ground-cover area and manual measurements or calibrated reference objects. Since Table VII includes absolute features such as HMax, V100, and G in the regression, a reconstruction-dependent scale or completeness error would propagate directly into the reported coefficients and accuracies. The authors should add a validation experiment with a known-size calibration object or manual measurements on at least a subset of plants.
- [V-C6; VI] The leaf-angle extraction algorithm is described at length, yet leaf angles do not appear among the features selected for either predictive model in Tables VII and VIII, and no direct comparison between extracted leaf angles and the architecture rating is reported. Because the erectophile/planophile distinction is fundamentally about leaf orientation, the paper should either include leaf-angle features in the predictive analysis or explicitly explain why they were omitted at the 14-day stage where the method is stated to be valid.
minor comments (5)
- [Throughout] The manuscript contains several typographical errors that should be corrected: 'utilizing', 'manullay', 'steam' (for stem), 'futher', 'the the turntable', 'theses measurements', and 'out explicit segmentation'.
- [Table III] The hardware specifications in Table III appear inconsistent with the actual hardware: the NVIDIA RTX 3090 has compute capability 8.6 and memory bandwidth of roughly 936 GB/s, and the Tesla V100 has compute capability 7.0, not 5.0/6.0 as listed. Please verify and correct these entries.
- [Table V] The camera resolution is listed as 4084 x 3051 in Table V but as 4056 x 3040 in Section III and Table I; please reconcile the numbers.
- [Algorithm 3] Algorithm 3 uses generic lower_threshold and upper_threshold arguments, while the text describes specific LAB thresholds (b-channel >= 80 and a-channel < 140). Please clarify how the pseudocode maps to the LAB thresholds and ensure the released code matches the description.
- [VI-A] The p-values reported in Table VII come from coefficients of a stepwise forward/backward selection procedure on the training set; these are not valid significance tests on the held-out data. Please label them as selection diagnostics or provide confidence intervals from the final model.
Circularity Check
No circularity: trait-based supervised models are trained and tested on held-out plants; the shared-genotype split is a validation concern, not a circular derivation.
full rationale
The paper's central derivation is a supervised learning pipeline: phenotypic traits computed from photogrammetric point clouds are used to predict an expert-assigned UPOV canopy-architecture rating. The target labels were assigned per genotype before point-cloud creation (Section VI), and the features are computed independently from the point clouds. The multiple linear regression and k-NN models are fit on a 48-plant training split and evaluated on a 12-plant held-out test split, with feature selection performed on training data only (Section VI-A and VI-B). Nothing in the paper defines a trait in terms of the rating or fits a parameter to the test labels and then reports it as a prediction; the held-out test is genuinely held out at the plant level. The main limitation is that the expert rating is constant per variety while the split is per plant, so test plants share genotype labels with training plants; this is a generalization-design weakness, not a circularity. The system's reconstruction and processing components are supported by external tools (COLMAP, Open3D, DBSCAN, alpha-shapes) and the paper does not rely on load-bearing self-citations. No circular reduction of the claimed results to their inputs is present.
Assumptions & free parameters
free parameters (7)
- LAB mask thresholds (b-channel >= 80, a-channel < 140) =
b >= 80, a < 140
- Alpha-shape parameter alpha for ground cover area =
100
- Number of z-slices n for leaf-angle extraction =
80
- DAG edge-cost weights alpha, beta, gamma, delta =
Not specified in text; available on GitHub
- RANSAC distance threshold and max iterations =
Not specified in text
- DBSCAN parameters (eps, min_samples) =
Not specified in text
- Model hyperparameters k and feature-selection threshold =
k=5 (day 14), k=2 (day 35); p<0.05 in forward/backward feature selection
assumptions (7)
- domain assumption COLMAP structure-from-motion reconstructs metric geometry from the captured images.
- domain assumption The turntable ring segmentation identifies a circle whose diameter is known exactly, giving the correct point-cloud scale.
- domain assumption RANSAC plane fit returns the turntable plane and normal, so aligning to z=0 is valid.
- domain assumption The expert's single UPOV rating per genotype is a reliable ground truth for erectophile versus planophile architecture.
- ad hoc to paper Plants at day 14 grow upward with no strongly arcing leaves, so the leaf-angle graph and regression approach is valid.
- domain assumption Color thresholding removes blue background artifacts without removing plant points.
- domain assumption Voxel downsampling, normal estimation, and statistical outlier removal preserve trait-relevant geometry.
Cite this review
Pith. "Pith review of A Low-Cost Photogrammetry System for 3D Plant Modeling and Phenotyping." pith.science (2026). https://pith.science/paper/RILMGPR6
@misc{pith2026250416840,
  author       = {Pith},
  title        = {Pith review of: A Low-Cost Photogrammetry System for 3D Plant Modeling and Phenotyping},
  year         = {2026},
  howpublished = {\url{https://pith.science/paper/RILMGPR6}},
  note         = {Machine review of arXiv:2504.16840}
}
read the original abstract
We present an open-source, low-cost photogrammetry system for 3D plant modeling and phenotyping. The system uses a structure-from-motion approach to reconstruct 3D representations of the plants via point clouds. Using wheat as an example, we demonstrate how various phenotypic traits can be computed easily from the point clouds. These include standard measurements such as plant height and radius, as well as features that would be more cumbersome to measure by hand, such as leaf angles and convex hull. We further demonstrate the utility of the system through the investigation of specific metrics that may yield objective classifications of erectophile versus planophile wheat canopy architectures.
Figures


Figures from the paper (14 more)




Reference graph
Works this paper leans on
-
[1]
Anna L. Casto, Haley Schuhl, Jose C. Tovar, Qi Wang, Rebecca S. Bart, Noah Fahlgren, and Malia A. Gehan. Picturing the future of food.The Plant Phenome Journal , 4(1):e20014, 2021
work page 2021
-
[2]
Muhammad Salman Akhtar, Zuhair Zafar, Raheel Nawaz, and Muhammad Moazam Fraz. Unlocking plant secrets: A systematic review of 3d imaging in plant phenotyping techniques.Computers and Electronics in Agriculture , 222:109033, 2024
work page 2024
-
[3]
J. De Vylder, F. Vandenbussche, Y. Hu, W. Philips, and D. Van Der Straeten. Rosette tracker: An open source image analysis tool for automatic quantification of genotype effects.Plant Physiology, 160(3):1149–1159, 08 2012
work page 2012
- [4]
-
[5]
K. E. Keightley and G. W. Bawden. 3d volumetric modeling of grapevine biomass using tripod lidar.Computers and Electronics in Agriculture, 74(2):305–312, 2010
work page 2010
- [6]
-
[7]
K. Nagasubramanian, S. Jones, A.K. Singh, et al. Plant disease identification using explainable 3d deep learning on hyperspectral images. Plant Methods, 15:98, 2019
work page 2019
- [8]
Show all 44 references
-
[9]
Khanna, L
R. Khanna, L. Schmid, A. Walter, and J. Nieto. A spatio temporal spectral framework for plant stress phenotyping.Plant Methods, 15(1):13, 2019
2019
-
[10]
S. Paulus. Measuring crops in 3d: using geometry for plant phenotyping.Plant Methods, 15:103, 2019
2019
-
[11]
Hosoi and K
F. Hosoi and K. Omasa. Estimating vertical plant area density profile and growth parameters of a wheat canopy at different growth stages using three-dimensional portable lidar imaging.ISPRS Journal of Photogrammetry and Remote Sensing , 64(2):151–158, 2009
2009
-
[12]
Gebbers, D
R. Gebbers, D. Ehlert, and R. Adamek. Rapid mapping of the leaf area index in agricultural crops.Agronomy Journal, 103:1532–1541, 09 2011
2011
-
[13]
Nguyen, D
T. Nguyen, D. Slaughter, N. Max, J. Maloof, and N. Sinha. Structured light-based 3d reconstruction system for plants. Sensors (Basel, Switzerland) , 15:18587–612, 08 2015
2015
-
[14]
Paulus, H
S. Paulus, H. Schumann, H. Kuhlmann, and J. Léon. High-precision laser scanning system for capturing 3d plant architecture and analysing growth of cereal plants.Biosystems Engineering, 121:1–11, 05 2014
2014
-
[15]
J. A. Gibbs, M. P. Pound, A. P. French, D. M. Wells, E. H. Murchie, and T. Pridmore. Approaches to three-dimensional reconstruction of plant shoot topology and geometry.Functional Plant Biology, 44(1):62–75, 2016
2016
-
[16]
X. Lu, E. Ono, S. lu, Y. Zhang, P. Teng, M. Aono, Y. Shimizu, F. Hosoi, and K. Omasa. Reconstruction method and optimum range of camera-shooting angle for 3d plant modeling using a multi-camera photography system.Plant Methods, 16, 08 2020
2020
-
[17]
Breitzman, Maria G
Yin Bao, Lie Tang, Matthew W. Breitzman, Maria G. Salas Fernandez, and Patrick S. Schnable. Field-based robotic phenotyping of sorghum plant architecture using stereo vision.Journal of Field Robotics , 36(2):397–415, 2019
2019
-
[18]
Phenostereo: a high-throughput stereo vision system for field-based plant phenotyping-with an application in sorghum stem diameter estimation
Lirong Xiang, Lie Tang, Jingyao Gai, and Le Wang. Phenostereo: a high-throughput stereo vision system for field-based plant phenotyping-with an application in sorghum stem diameter estimation. 2020
2020
-
[19]
Field phenotyping of grapevine growth using dense stereo reconstruction
Maria Klodt, Katja Herzog, Reinhard Töpfer, and Daniel Cremers. Field phenotyping of grapevine growth using dense stereo reconstruction. 16(1):143
-
[20]
Paproki, X
A. Paproki, X. Sirault, S. Berry, et al. A novel mesh processing based technique for 3d plant analysis.BMC Plant Biology, 12(63), 2012
2012
-
[21]
Moeckel, S
T. Moeckel, S. Dayananda, R. R. Nidamanuri, S. Nautiyal, N. Hanumaiah, A. Buerkert, and M. Wachendorf. Estimation of vegetable crop parameter by multi-temporal uav-borne images.Remote Sensing, 10(5), 2018
2018
-
[22]
Y. Shi, J. A. Thomasson, S. C. Murray, N. A. Pugh, W. L. Rooney, S. Shafian, N. Rajan, G. Rouze, C. L. S. Morgan, H. L. Neely, and et al. Unmanned aerial vehicles for high-throughput phenotyping and agronomic research.PLOS ONE, 11(7):1–26, 07 2016
2016
-
[23]
J. He, R. Harrison, and B. Li. A novel 3d imaging system for strawberry phenotyping.Plant Methods, 13, 11 2017
2017
-
[24]
van der Heijden, Y
G. van der Heijden, Y. Song, G. Horgan, G. Polder, J. Dieleman, M. Brink, A. Palloix, F. Eeuwijk, and C. Glasbey. Spicy: towards automated phenotyping of large pepper plants in the greenhouse.Functional Plant Biology, 39, 11 2012
2012
-
[25]
Biskup, H
B. Biskup, H. Scharr, U. Schurr, and U. Rascher. A stereo imaging system for measuring structural parameters of plant canopies. Plant, Cell & Environment , 30(10):1299–1308, 2007
2007
-
[26]
Shafiekhani, S
A. Shafiekhani, S. Kadam, F. B. Fritschi, and G. N. DeSouza. Vinobot and vinoculer: Two robotic platforms for high- throughput field phenotyping.Sensors, 17(1), 2017
2017
-
[27]
Milella, R
A. Milella, R. Marani, A. Petitti, and G. Reina. In-field high throughput grapevine phenotyping with a consumer-grade depth camera. Computers and Electronics in Agriculture , 156:293–306, 2019
2019
-
[28]
Three-dimensionalmodeling of weed plants using low-cost photogrammetry.Sensors, 18(4), 2018
DionisioAndújar,MikelCalle,CésarFernández-Quintanilla,ÁngelaRibeiro,andJoséDorado. Three-dimensionalmodeling of weed plants using low-cost photogrammetry.Sensors, 18(4), 2018
2018
-
[29]
Thanh-Nghi Doan and Chuong V. Nguyen. A low-cost digital 3D insect scanner. 11(3):337–355
-
[30]
scAnt—an open-source platform for the creation of 3D models of arthropods (and other small objects)
Fabian Plum and David Labonte. scAnt—an open-source platform for the creation of 3D models of arthropods (and other small objects). 9:e11155. 28
-
[31]
Raspberry pi 4 model b 4gb
Raspberry Pi Foundation. Raspberry pi 4 model b 4gb. https://www.raspberrypi.org/products/raspberry-pi-4-model-b/,
-
[32]
Getting Started with 64MP-AF Quad Camera Kit, 2022
Arducam Technology Co., Limited. Getting Started with 64MP-AF Quad Camera Kit, 2022. [Online; accessed 2023-03-21]
2022
-
[33]
Photocapture 360m - motorized turntable
Ortery Technologies, Inc. Photocapture 360m - motorized turntable. https://www.ortery.com/ photocapture-360-product-photography-turntables/, 2023. [Online; accessed 2023-02-26]
2023
-
[34]
Dc and stepper motor hat for raspberry pi
Adafruit Industries. Dc and stepper motor hat for raspberry pi. https://www.adafruit.com/product/2348, 2023. [Online; accessed 2024-02-24
2023
-
[35]
Joe Hrzich. Photopi. https://github.com/joehrz/PhotoPi, 2024. [Online; accessed 2024-10-5]
2024
-
[36]
Paramiko
Jeff Forcier. Paramiko. https://www.paramiko.org/, 2024. [Online; accessed 2024-08-14]
2024
-
[37]
J. L. Schönberger and J. Frahm. Structure-from-motion revisited. In Conference on Computer Vision and Pattern Recognition (CVPR), 2016
2016
-
[38]
Open3D: A modern library for 3D data processing.arXiv:1801.09847, 2018
Qian-Yi Zhou, Jaesik Park, and Vladlen Koltun. Open3D: A modern library for 3D data processing.arXiv:1801.09847, 2018
2018 arXiv
-
[39]
Edelsbrunner, D
H. Edelsbrunner, D. Kirkpatrick, and R. Seidel. On the shape of a set of points in the plane.IEEE Transactions on Information Theory, 29(4):551–559, 1983
1983
-
[40]
A density-based algorithm for discovering clusters in large spatial databases with noise
Martin Ester, Hans-Peter Kriegel, Jörg Sander, Xiaowei Xu, et al. A density-based algorithm for discovering clusters in large spatial databases with noise. Inkdd, volume 96, pages 226–231, 1996
1996
-
[41]
Richards, Colin R
Richard A. Richards, Colin R. Cavanagh, and Penny Riffkin. Selection for erect canopy architecture can increase yield and biomass of spring wheat.Field Crops Research, 244:107649, 2019
2019
-
[42]
Springer Nature, 2023
Gareth James, Daniela Witten, Trevor Hastie, Robert Tibshirani, and Jonathan Taylor.An introduction to statistical learning: With applications in python . Springer Nature, 2023
2023
-
[43]
Cover and P
T. Cover and P. Hart. Nearest neighbor pattern classification.IEEE Transactions on Information Theory , 13(1):21–27, 1967
1967
-
[2023]
[Online; accessed 2023-02-26]
2023
Reviewed August 16, 2026 · model on record in the stance chip above.
Discussion (0). Continue with ORCID to comment.