REVIEW 3 major objections 5 minor 39 references
Statistical Inference for Clustering-based Anomaly Detection
T0 review · 3 major / 5 minor · reviewed 2026-08-16 · deepseek-v4-flash
Pith's one-line read DBSCAN's anomaly flags can be tested with exact false-positive control, the paper proves.
desk verdict The idea—selective inference for DBSCAN-detected anomalies—is worth taking seriously, but the key lemma has a sign error that voids the stated FPR guarantee, so the paper needs a corrected proof before it can be trusted. read the letter →
The pith
A machine-rendered reading of the paper's core claim, the machinery that carries it, and where it could break.
The reading
What carries the argument
The load-bearing object is the truncation region $\mathcal{Z}$, the set of scalar values $z$ along the line $X(z) = a + bz$ for which DBSCAN produces the same anomaly set as the observed data; the selective p-value is a tail probability of the truncated normal distribution of $|Z|$ over $\mathcal{Z}$. Because $\mathcal{Z}$ is hard to compute directly, the paper uses over-conditioning: it first conditions on each point's eps-neighborhood being unchanged, which Lemma 3 expresses as a system of quadratic inequalities in $z$. Then it stitches these regions together along the parametrized line with a divide-and-conquer line search, alternating DBSCAN runs and analytic interval updates to build $\mathcal{Z}$ as a union of intervals. This machinery turns a discrete, combinatorial selection event into an interval computation, which is what makes an exact p-value tractable.
What would settle it
Run DBSCAN on a small null data set, enumerate by brute force every point along the conditioning line that yields the same anomaly set, and compare that set with the intervals returned by Algorithm 1; any discrepancy means the selective p-values are not the exact truncated-normal tail probabilities and the false positive rate at $\alpha$ will not be exact. Equivalently, simulate many null data sets and check whether the empirical false positive rate of SI-CLAD exceeds $\alpha$ by more than Monte Carlo error.
Extended reading notes
Core claim
The paper's central claim is that false detection control is attainable for DBSCAN-based anomaly detection. Given the observed data, SI-CLAD treats each flagged point as a test of whether its mean equals the mean of the non-flagged points. The test statistic is projected onto a scalar direction, and the p-value is computed from the truncated normal law of that statistic conditional on the event that DBSCAN returns the same anomaly set and on a nuisance component. Lemma 1 states that this selective p-value satisfies $P(p \leq \alpha) = \alpha$ exactly under the null, not merely approximately, and the experiments show that the false positive rate is controlled across univariate, multidimensional, and correlated settings while the true positive rate is the highest among methods that are valid.
Load-bearing premise
The entire false-positive guarantee depends on the assumption that the algorithm computes exactly the set of data sets on which DBSCAN would flag the same anomalies, and the paper assumes both the quadratic characterization and the finite line search recover that set rather than a superset or approximation of it.
Editorial extensions
If this is right
- An analyst using DBSCAN with pre-specified eps and MinPts can report a significance level for each flagged anomaly without correcting for the fact that the data determined the flags.
- The same conditional test works in multiple dimensions and under correlated noise, so the guarantee is not limited to toy one-dimensional settings.
- The over-conditioned version of the method is also valid, but the full line search recovers more power, so the gap between the two quantifies the price of over-conditioning.
- Computational cost per p-value grows roughly linearly in sample size and dimension in the reported experiments, making the exact test feasible on moderate datasets.
- For Euclidean-distance DBSCAN the method inherits the validity of the truncated-normal selective inference framework; for other distance functions the supplied characterization does not apply.
Reading between the lines
- If the computed truncation region is indeed exact, the same line-search-plus-over-conditioning recipe should transfer to other density-based detectors such as OPTICS or DENCLUE whenever their selection events can be written as quadratic inequalities; the paper gestures at this extension but does not prove it.
- The covariance is assumed known or estimated from independent data, so a natural stress test is to estimate it from the same data and measure how much the false positive rate inflates when the truncated normal law is misspecified.
- For small sample sizes, comparing Algorithm 1's intervals against brute-force enumeration of DBSCAN-stable intervals would separate approximation error from statistical validity and could be used to choose the tolerance parameter.
- Because the standard exponential multiple-testing correction becomes hopeless as the sample size grows, the practical value of conditioning the correction factor down to one grows precisely in the large-$n$ regime where naive tests fail.
Signed reviews
Editorial analysis
A structured set of objections, weighed in public.
Referee Report
Summary. This paper proposes SI-CLAD, a selective-inference method that computes p-values for anomalies detected by DBSCAN. The data are modeled as Gaussian; for each detected anomaly j, the test statistic is the deviation from the mean of the remaining points, and the p-value is computed conditional on the DBSCAN output and on a nuisance component (Eqs. 3-8). The main technical step is Lemma 3, which claims that the set of z values along a one-dimensional parametrization preserving all eps-neighborhoods is described by quadratic inequalities, and Algorithm 1 uses that characterization in a line search to build the truncation region Z; the p-value is then a truncated-normal tail probability (Eq. 12). Lemma 1 asserts exact FPR control. Experiments on synthetic and real data report FPR control and high TPR, and code is available. Section 3.4 sketches a multi-dimensional extension.
Significance. If the derivation were sound, this would be a useful contribution to the growing selective-inference literature: it would be the first valid p-value method for DBSCAN-based anomaly detection, with an explicit algorithm and reproducible code, and the idea of over-conditioning on eps-neighborhoods to tame DBSCAN's discontinuous selection event is natural. The empirical FPR results are encouraging. However, the central theoretical claim currently rests on an incorrect characterization in Lemma 3 and on an unproven exactness claim for the line-search algorithm, so the paper cannot be accepted in its present form.
major comments (3)
- [Appendix A.3, Lemma 3] The inequality for non-neighbors is written incorrectly. With sigma_ij = -1, the condition sigma_ij ||X_i(z)-X_j(z)||^2 <= eps^2 becomes -||X_i(z)-X_j(z)||^2 <= eps^2, which holds for every z; all 'must remain outside' constraints are vacuous, so the computed Z_oc is a superset of the true over-conditioning region. The correct unified inequality in the same notation is sigma_ij ||X_i(z)-X_j(z)||^2 <= sigma_ij eps^2, i.e., ||X_i(z)-X_j(z)||^2 >= eps^2 when sigma_ij = -1. Because Algorithm 1 builds [L_z,R_z] from this flawed Z_oc, the truncation set used in Eq. (12) is not the actual selection event. Enlarging the truncation set changes the truncated-normal normalizing constant and is not automatically conservative; the p-value can move downward, so the equality P(p_selective <= alpha) = alpha in Lemma 1 is not established.
- [Algorithm 1 / Eq. (14)] The paper does not prove that the finite line search recovers the union in Eq. (14). The algorithm checks the DBSCAN output only at the left endpoint z, appends the whole interval [L_z,R_z], and then jumps to R_z + delta; intervals of the selection event shorter than delta, or lying between R_z and the next sampled point, are missed, and the choice of z_min and z_max is left unspecified. Since Eq. (12) requires the exact Z in Eq. (11), exact FPR control is not guaranteed for the implemented procedure. A proof of exact recovery, or a conservative modification with explicit handling of the grid and tolerance, is needed.
- [Section 3.4, Eqs. (15)-(16)] The multi-dimensional extension is not derived. Gamma_j is a sum of absolute deviations; its representation as a linear form eta_j^T vec(X) fixes the sign vector s from the observed data, but the distributional statement in Eq. (16) conditions only on O_X and s_X. The induced truncation region for the signs is not characterized, and the claim that the techniques of Sections 3.2 and 3.3 apply 'straightforwardly' is unsupported. In particular, the unconditional distribution of Gamma_j under the null is a folded normal, not a normal, so the truncated-normal argument requires an explicit conditioning event and a proof.
minor comments (5)
- [Section 1, Related works] The statement that the Bonferroni adjustment factor 'scales exponentially with n, specifically reaching 2^n' is inaccurate; the standard correction for n hypotheses is alpha/n.
- [Appendix A.3 and throughout] There are several typos: 'parameterired' should be 'parameterized', 'modesl' should be 'models', and 'performace' should be 'performance'.
- [Appendix A.1, proof of Lemma 1] Conditioning on the continuous variable Q_X = Q_obs and integrating over Q_obs with a density is informal; a measure-theoretic conditioning argument as in Lee et al. (2016) should be cited or sketched.
- [Section 3.2, Eq. (11)-(12)] The notation Z is used both for the truncation region and for the random variable after Eq. (12); this is confusing and should be disambiguated.
- [Section 4.1, Figures 3-6] The FPR and TPR results are reported as point values without error bars or standard errors; given the paper's exactness claims, some uncertainty quantification would strengthen the empirical support.
Circularity Check
No significant circularity: SI-CLAD's validity argument is a standard selective-inference conditional p-value, and the only relevant self-citation (Duy and Takeuchi, 2022) is not load-bearing for the proof.
full rationale
The central derivation is self-contained relative to the external Lee et al. (2016) selective inference framework. Lemma 1 is the standard probability integral transform for a two-sided p-value conditional on the selection event; the paper defines p_selective as the tail probability over exactly the conditioning event {O_X = O_obs, Q_X = Q_obs}, and the equality P(p_selective <= alpha) = alpha follows from the conditional uniform distribution, not from a renaming of the conclusion. Lemma 2 and Equation (14) characterize the selection event on the parametrized line; Lemma 3 states the quadratic-inequality computation of the over-conditioning region. The reference to Duy and Takeuchi (2022) supplies a computational line-search idea, but the validity argument does not import correctness from that reference: Algorithm 1 is specified in the paper, and the p-value formula (12) stands or falls with Lemma 3's characterization. The Discussion's admission that hyperparameters are analyst-chosen is a limitation about data-driven tuning, not a circular input. The technical issue in Lemma 3 (for sigma_ij = -1 the written inequality is vacuous, making Z_oc a superset of the true region) is a correctness defect in the proof of exact FPR control, not a case where an output is equivalent to an input by construction; it should be resolved by fixing the inequality, not by circularity analysis.
Assumptions & free parameters
free parameters (5)
- z_min
- z_max
- delta =
0.001 (example)
- eps
- MinPts
assumptions (5)
- domain assumption The observed data follow X = μ + ε with ε ~ N(0, Σ), and Σ is known or estimable from independent data.
- domain assumption DBSCAN uses the Euclidean distance metric for eps-neighborhood queries.
- domain assumption The null hypothesis defined in Eq. (3), comparing a detected point to the mean of points outside the detected set, is the correct notion of 'not being an anomaly'.
- standard math The standard selective-inference result of Lee et al. (2016), that conditioning on the selection event yields a valid p-value, is accepted.
- ad hoc to paper The line search over [z_min, z_max] covers the entire truncation region Z.
Cite this review
Pith. "Pith review of Statistical Inference for Clustering-based Anomaly Detection." pith.science (2026). https://pith.science/paper/FRJBPACG
@misc{pith2026250418633,
  author       = {Pith},
  title        = {Pith review of: Statistical Inference for Clustering-based Anomaly Detection},
  year         = {2026},
  howpublished = {\url{https://pith.science/paper/FRJBPACG}},
  note         = {Machine review of arXiv:2504.18633}
}
abstract
Unsupervised anomaly detection (AD) is a fundamental problem in machine learning and statistics. A popular approach to unsupervised AD is clustering-based detection. However, this method lacks the ability to guarantee the reliability of the detected anomalies. In this paper, we propose SI-CLAD (Statistical Inference for CLustering-based Anomaly Detection), a novel statistical framework for testing the clustering-based AD results. The key strength of SI-CLAD lies in its ability to rigorously control the probability of falsely identifying anomalies, maintaining it below a pre-specified significance level $\alpha$ (e.g., $\alpha = 0.05$). By analyzing the selection mechanism inherent in clustering-based AD and leveraging the Selective Inference (SI) framework, we prove that false detection control is attainable. Moreover, we introduce a strategy to boost the true detection rate, enhancing the overall performance of SI-CLAD. Extensive experiments on synthetic and real-world datasets provide strong empirical support for our theoretical findings, showcasing the superior performance of the proposed method.
Figures


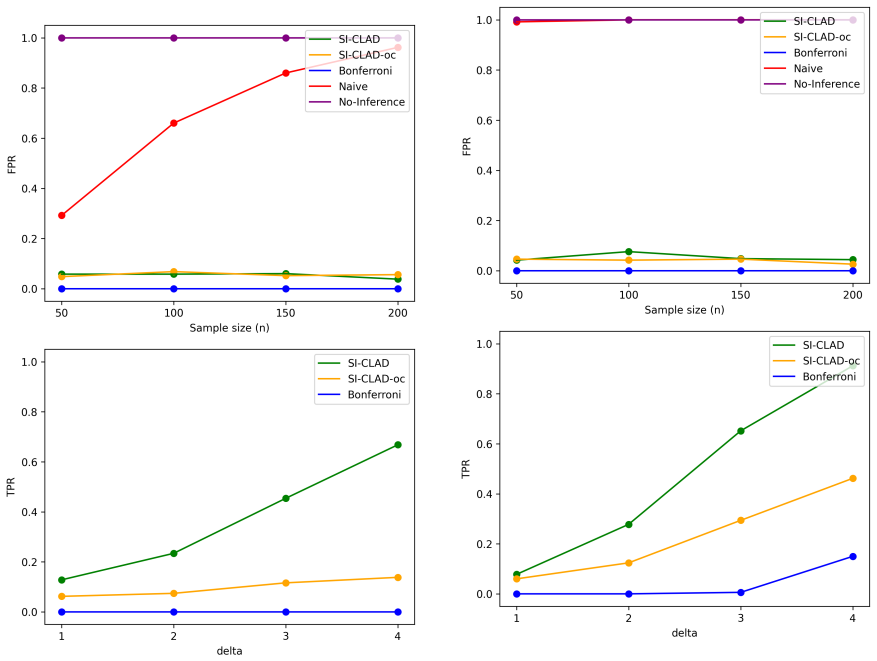
Figures from the paper (3 more)


Reference graph
Works this paper leans on
-
[1]
C. C. Aggarwal. An introduction to outlier analysis. Springer, 2017 a
work page 2017
-
[2]
C. C. Aggarwal. Outlier Analysis. Springer, 2017 b
work page 2017
- [3]
-
[4]
M. Carrat \`u , V. Gallo, S. D. Iacono, P. Sommella, A. Bartolini, F. Grasso, L. Ciani, and G. Patrizi. A novel methodology for unsupervised anomaly detection in industrial electrical systems. IEEE Transactions on Instrumentation and Measurement, 72: 0 1--12, 2023
work page 2023
- [5]
-
[6]
S. Chen and J. Bien. Valid inference corrected for outlier removal. Journal of Computational and Graphical Statistics, pages 1--12, 2019
work page 2019
-
[7]
S. Chen and J. Bien. Valid inference corrected for outlier removal. Journal of Computational and Graphical Statistics, 29 0 (2): 0 323--334, 2020
work page 2020
- [8]
Show all 39 references
-
[9]
V. N. L. Duy and I. Takeuchi. More powerful conditional selective inference for generalized lasso by parametric programming. The Journal of Machine Learning Research, 23 0 (1): 0 13544--13580, 2022
2022
-
[10]
V. N. L. Duy, H. Toda, R. Sugiyama, and I. Takeuchi. Computing valid p-value for optimal changepoint by selective inference using dynamic programming. In Advances in Neural Information Processing Systems, volume 33, pages 11356--11367, 2020
2020
-
[11]
V. N. L. Duy, S. Iwazaki, and I. Takeuchi. Quantifying statistical significance of neural network-based image segmentation by selective inference. Advances in neural information processing systems, 35: 0 31627--31639, 2022
2022
-
[12]
Ester, H.-P
M. Ester, H.-P. Kriegel, J. Sander, X. Xu, et al. A density-based algorithm for discovering clusters in large spatial databases with noise. In kdd, volume 96, pages 226--231, 1996
1996
-
[13]
Fithian, D
W. Fithian, D. Sun, and J. Taylor. Optimal inference after model selection. arXiv preprint arXiv:1410.2597, 2014
2014 arXiv
-
[14]
L. L. Gao, J. Bien, and D. Witten. Selective inference for hierarchical clustering. Journal of the American Statistical Association, pages 1--11, 2022
2022
-
[15]
S. Hyun, K. Lin, M. G'Sell, and R. J. Tibshirani. Post-selection inference for changepoint detection algorithms with application to copy number variation data. arXiv preprint arXiv:1812.03644, 2018
2018 arXiv
-
[16]
Inoue, Y
S. Inoue, Y. Umezu, S. Tsubota, and I. Takeuchi. Post clustering inference for heterogeneous data. IEICE Technical Report; IEICE Tech. Rep., 117 0 (293): 0 69--76, 2017
2017
-
[17]
Jewell, P
S. Jewell, P. Fearnhead, and D. Witten. Testing for a change in mean after changepoint detection. Journal of the Royal Statistical Society Series B: Statistical Methodology, 84 0 (4): 0 1082--1104, 2022
2022
-
[18]
Kriegeskorte, W
N. Kriegeskorte, W. K. Simmons, P. S. Bellgowan, and C. I. Baker. Circular analysis in systems neuroscience: the dangers of double dipping. Nature neuroscience, 12 0 (5): 0 535--540, 2009
2009
-
[19]
J. D. Lee, Y. Sun, and J. E. Taylor. Evaluating the statistical significance of biclusters. Advances in neural information processing systems, 28: 0 1324--1332, 2015
2015
-
[20]
J. D. Lee, D. L. Sun, Y. Sun, J. E. Taylor, et al. Exact post-selection inference, with application to the lasso. The Annals of Statistics, 44 0 (3): 0 907--927, 2016
2016
-
[21]
J. Li, H. Izakian, W. Pedrycz, and I. Jamal. Clustering-based anomaly detection in multivariate time series data. Applied Soft Computing, 100: 0 106919, 2021
2021
-
[22]
Niihori, T
M. Niihori, T. Katsuoka, T. Shiraishi, S. Nishino, and I. Takeuchi. Statistically significant k nnad by selective inference. arXiv preprint arXiv:2502.12978, 2025
2025
-
[23]
L. H. Phong, H. N. Luat, and V. N. L. Duy. Controllable ransac-based anomaly detection via hypothesis testing. arXiv preprint arXiv:2410.15133, 2024
2024 arXiv
-
[24]
R. C. Ripan, I. H. Sarker, S. M. M. Hossain, M. M. Anwar, R. Nowrozy, M. M. Hoque, and M. H. Furhad. A data-driven heart disease prediction model through k-means clustering-based anomaly detection. SN Computer Science, 2 0 (2): 0 112, 2021
2021
-
[25]
Shiraishi, D
T. Shiraishi, D. Miwa, T. Katsuoka, V. N. L. Duy, K. Taji, and I. Takeuchi. Statistical test for attention map in vision transformer. arXiv preprint arXiv:2401.08169, 2024
2024 arXiv
-
[26]
Sugiyama, V
K. Sugiyama, V. N. Le Duy, and I. Takeuchi. More powerful and general selective inference for stepwise feature selection using homotopy method. In International Conference on Machine Learning, pages 9891--9901. PMLR, 2021 a
2021
-
[27]
Sugiyama, H
R. Sugiyama, H. Toda, V. N. L. Duy, Y. Inatsu, and I. Takeuchi. Valid and exact statistical inference for multi-dimensional multiple change-points by selective inference. arXiv preprint arXiv:2110.08989, 2021 b
2021 arXiv
-
[28]
Syarif, A
I. Syarif, A. Prugel-Bennett, and G. Wills. Unsupervised clustering approach for network anomaly detection. In Networked Digital Technologies: 4th International Conference, NDT 2012, Dubai, UAE, April 24-26, 2012. Proceedings, Part I 4, pages 135--145. Springer, 2012
2012
-
[29]
Tanizaki, N
K. Tanizaki, N. Hashimoto, Y. Inatsu, H. Hontani, and I. Takeuchi. Computing valid p-values for image segmentation by selective inference. In Proceedings of the IEEE/CVF Conference on Computer Vision and Pattern Recognition, pages 9553--9562, 2020
2020
-
[30]
C.-W. Ten, J. Hong, and C.-C. Liu. Anomaly detection for cybersecurity of the substations. IEEE Transactions on Smart Grid, 2 0 (4): 0 865--873, 2011
2011
-
[31]
R. J. Tibshirani, J. Taylor, R. Lockhart, and R. Tibshirani. Exact post-selection inference for sequential regression procedures. Journal of the American Statistical Association, 111 0 (514): 0 600--620, 2016
2016
-
[32]
Tsukurimichi, Y
T. Tsukurimichi, Y. Inatsu, V. N. L. Duy, and I. Takeuchi. Conditional selective inference for robust regression and outlier detection using piecewise-linear homotopy continuation. arXiv preprint arXiv:2104.10840, 2021
2021 arXiv
-
[33]
Tsukurimichi, Y
T. Tsukurimichi, Y. Inatsu, V. N. L. Duy, and I. Takeuchi. Conditional selective inference for robust regression and outlier detection using piecewise-linear homotopy continuation. Annals of the Institute of Statistical Mathematics, 74 0 (6): 0 1197--1228, 2022
2022
-
[34]
A. Ukil, S. Bandyoapdhyay, C. Puri, and A. Pal. Iot healthcare analytics: The importance of anomaly detection. In 2016 IEEE 30th international conference on advanced information networking and applications (AINA), pages 994--997. IEEE, 2016
2016
-
[35]
Umezu and I
Y. Umezu and I. Takeuchi. Selective inference for change point detection in multi-dimensional sequences. arXiv preprint arXiv:1706.00514, 2017
2017 arXiv
-
[36]
F. Yang, R. F. Barber, P. Jain, and J. Lafferty. Selective inference for group-sparse linear models. In Advances in Neural Information Processing Systems, pages 2469--2477, 2016
2016
-
[37]
@esa ( ) , n @biblabelnum##1 ##1
\@ifclassloaded aguplus natbib The aguplus class already includes natbib coding, so you should not add it explicitly Type <Return> for now, but then later remove the command natbib from the document \@ifclassloaded nlinproc natbib The nlinproc class already includes natbib cod...
-
[38]
@stdbsttrue NAT@ctr \@lbibitem[ NAT@ctr ] \@lbibitem[#1]#2 \@extra@b@citeb \@ifundefined br@#2\@extra@b@citeb \@namedef br@#2 \@nameuse br@#2\@extra@b@citeb \@ifundefined b@#2\@extra@b@citeb @num @parse #2 [ @natanchorstart #2\@extra@b@citeb \@biblabel @num @natanchorend] @ifc...
-
[39]
@open @close @open @close and [1] URL: #1 \@ifundefined chapter * \@mkboth \@ifundefined NAT@sectionbib * \@mkboth * \@mkboth\@gobbletwo \@ifclassloaded amsart * \@ifclassloaded amsbook * \@ifundefined bib@heading @heading NAT@ctr thebibliography [1] @ \@biblabel NAT@ctr \@bib...
2008
Reviewed August 16, 2026 · model on record in the stance chip above.
Discussion (0). Continue with ORCID to comment.