REVIEW 5 major objections 5 minor 24 references
Deep Learning vs. Black-Scholes: Option Pricing Performance on Brazilian Petrobras Stocks
T0 review · 5 major / 5 minor · reviewed 2026-08-16 · deepseek-v4-flash
Pith's one-line read Residual network cuts option-price error by a third on Petrobras calls
desk verdict The paper's headline 64.3% MAE reduction is contradicted by its own Table 3 (actual reduction: 35.7%), and the hybrid loss trains part of the network on the Black-Scholes baseline it is later compared against. read the letter →
The pith
A machine-rendered reading of the paper's core claim, the machinery that carries it, and where it could break.
The reading
What carries the argument
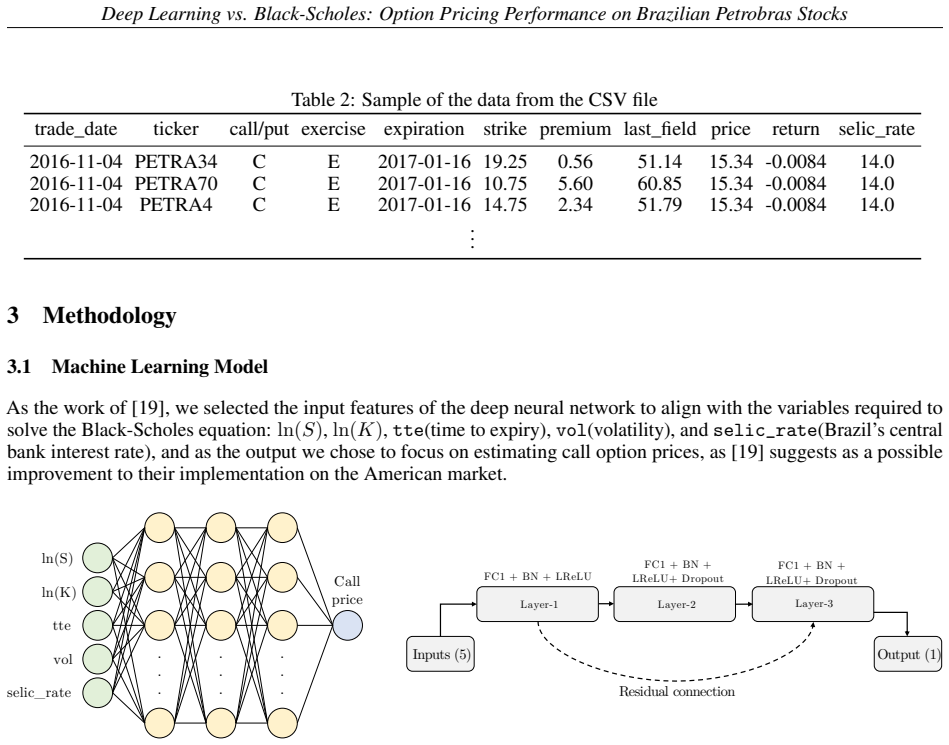
The load-bearing mechanism is a residual fully connected network with a skip connection between the first and second hidden layers, trained under a hybrid loss $\ell_i = \gamma_i (p_i - m_i)^2 + (1 - \gamma_i)(p_i - bs_i)^2$, where the binary mask $\gamma_i$ is 1 when the market premium exceeds 0.1 BRL and 0 otherwise. The five inputs mirror the Black-Scholes variables: $\ln(S)$, $\ln(K)$, time to expiry, annualized 21-day rolling volatility, and the SELIC rate. The residual connection and the loss's fallback to Black-Scholes values are what let the model stay anchored to theory where market quotes are unreliable while still fitting the observed price surface.
What would settle it
A reader can check the arithmetic directly: Table 3 gives $1.3047/2.0295 = 0.643$, so the reported 64.3% reduction should be about 35.7%; the stronger test is to re-run the comparison after re-parsing the B3 files with an independent parser and a second price source, since a date or price mismatch would change both the network's training targets and the Black-Scholes comparison.
Extended reading notes
Core claim
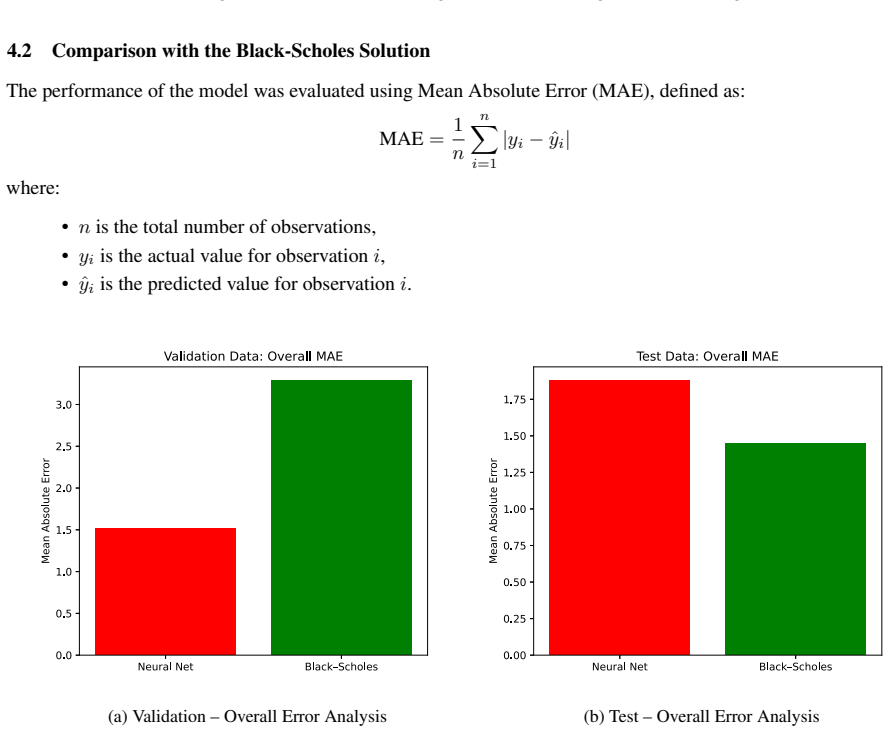
The central claim, stated on the authors' terms, is that a residual fully connected network with five inputs—$\ln(S)$, $\ln(K)$, time to expiration, annualized 21-day rolling volatility, and the SELIC rate—prices Petrobras call options in the 3–19 BRL range with lower mean absolute error than Black-Scholes on a three-month held-out test set from November 2024 to January 2025. The reported mean absolute errors are 1.3047 for the network and 2.0295 for Black-Scholes across that band, and the network also has lower error within each expiration bucket of one, two, and three months. The authors attribute the result to a hybrid loss that fits market prices when the quoted premium is above 0.1 BRL and falls back to Black-Scholes values otherwise, together with the residual shortcut between hidden layers. They also find that the network does not share Black-Scholes's tendency to lose accuracy as expiration lengthens. A caveat visible inside the paper: the abstract's 64.3% reduction number does not match Table 3, whose values imply the deep learning error is 64.3% of the Black-Scholes error—a 35.7% reduction.
Load-bearing premise
The load-bearing premise is that every scraped B3 record is parsed and matched to the correct trade date, stock price, volatility, and interest rate, with no check against a second source.
Editorial extensions
If this is right
- For Petrobras options priced between 3 and 19 BRL, the network's mean absolute error is about one-third lower than Black-Scholes's on the 2024–2025 test window.
- The network's error is lowest at three months to expiration, the reverse of the Black-Scholes pattern in this dataset, where error grows with time to expiration.
- Options around 5 BRL that Black-Scholes systematically undervalues are priced closer by the network, suggesting the model captures a market feature the formula misses.
- Outside the 3–19 BRL band the network overestimates prices, so the claimed advantage is range-specific rather than global.
- Because the loss uses Black-Scholes prices whenever the market quote is below the reliability threshold, the network's output is partly a blend of empirical and theoretical pricing, not a purely data-driven price.
Reading between the lines
- The 64.3% figure in the abstract looks like a ratio inversion; correcting it to roughly 35.7% makes the headline more modest but does not erase the consistent per-expiration advantage reported in Table 3.
- The result is tied to one bespoke scraping pipeline with no second-source validation; re-establishing the same comparison with an independent parser and a second price provider would show whether the edge survives.
- The hybrid loss means the network is partly trained on Black-Scholes values, so part of its apparent advantage may come from inheriting the formula's structure rather than from learning market dynamics alone.
- A natural extension, already suggested by the authors, is specialized models per price range; an equally natural check is to test the same architecture on other Brazilian underlyings or later time windows, which would separate the effect of the residual connection from the effect of the loss design.
Signed reviews
Editorial analysis
A structured set of objections, weighed in public.
Referee Report
Summary. The paper compares a deep residual network trained on eight years of Brazilian B3 option data with the Black-Scholes formula for pricing Petrobras European call options. The authors scrape option data from B3, combine it with PETR4 stock prices, rolling volatility, and SELIC rates, and train a five-input network with a hybrid loss that uses market prices when the premium exceeds 0.1 BRL and Black-Scholes prices otherwise. They report a 64.3% reduction in mean absolute error over Black-Scholes in the 3-19 BRL price range on a test set from November 2024 to January 2025, and discuss performance by expiration category and ticker.
Significance. If substantiated, the result would be a useful case study showing that a modestly sized residual network can beat Black-Scholes in a specific price band for a liquid emerging-market underlying, with practical implications for pricing low-priced options. The paper's strengths are its detailed description of the data-scraping pipeline, the explicit reporting of MAE by expiration category, and the use of a consumer-grade GPU. However, the headline performance claim is arithmetically inconsistent with the paper's own Table 3, the 3-19 BRL range is selected post hoc, and there is no statistical uncertainty quantification, so the significance as written is not established.
major comments (5)
- [Abstract; §4.3; §5] The claimed '64.3% reduction in MAE' is contradicted by Table 3. Table 3 reports DL MAE 1.3047 and BS MAE 2.0295 in the 3-19 BRL range; the reduction is (2.0295 - 1.3047) / 2.0295 = 35.7%, not 64.3%. The 64.3% figure is the ratio DL/BS, i.e., the deep learning error as a percentage of the Black-Scholes error. Please correct the abstract, §4.3, and §5, and restate the magnitude of the improvement consistently with Table 3.
- [§4.2; Fig. 5] The 3-19 BRL band appears to be selected after inspecting test-set performance, with no pre-specified rule or correction for multiple comparisons. The paper does not report how many test samples fall in this band, how sensitive the result is to the band boundaries, or confidence intervals for the MAE difference. Without this, the reported improvement cannot be distinguished from selection over price bins. Please report sample sizes, a pre-registered or at least a priori defined range, and uncertainty estimates.
- [§3.2] The hybrid loss sets γ_i = 0 for samples with market premium at most 0.1 BRL, training the network to reproduce Black-Scholes prices for exactly the samples that are then used to compare the network against Black-Scholes in the overall test set. This makes the full-sample comparison partially circular. Although the 3-19 BRL band likely uses only market-labeled samples, the paper should quantify how many test samples in each reported comparison were trained with the Black-Scholes target and re-run the comparison excluding them.
- [§2.2-2.3] The data foundation is built entirely from bespoke web scraping and file parsing with no validation against a second source. Errors in parsing the .ex files, matching option records to PETR4 prices, or applying the 'closest preceding date' rule would corrupt both the training labels and the Black-Scholes inputs. Please validate a random sample of records against an independent data provider and report the error rate, and describe the de-duplication and cleaning rules in sufficient detail for replication.
- [§4.1; Fig. 2] The text states that Fig. 2 'is not the original loss graph from that process' but 'serves as a representative example.' A result figure should display the actual recorded loss curves; presenting a representative or schematic version without a clear statement as such is misleading and prevents readers from assessing the hyperparameter search. Please provide the actual Optuna curves or remove the figure.
minor comments (5)
- [§1] The phrase 'Nobel prize for Economy' should be 'Nobel Memorial Prize in Economic Sciences.'
- [Fig. 3] The x-axis labels in Fig. 3 are garbled ('4 510152025') and the axis is not clearly labeled; please replot the figure.
- [Table 2] The column headers 'last_field' and 'return' are undefined; please define them in the caption or in the text.
- [§2.1; §4.3] The abstract and §5 repeat '43.41% of all Petrobras option transactions' without defining the denominator; specify exactly how this percentage is computed, and use a round number or report the exact count.
- [§2.3] The description of the rolling volatility calculation should state explicitly that the 21-day window ends on the trade date and that no future information is used; otherwise readers cannot assess look-ahead bias.
Circularity Check
No significant circularity: the deep-learning versus Black-Scholes comparison is an out-of-sample empirical benchmark, although the abstract's 64.3% reduction figure is arithmetically inconsistent with Table 3.
full rationale
The paper's central claim is an empirical comparison, not a derivation: a residual network is trained on B3 market premiums (with a hybrid loss that uses Black-Scholes targets only when the market premium is at most 0.1 BRL) and is then evaluated on a time-held-out test set against the Black-Scholes formula, with market premiums as ground truth. Nothing in this setup makes the reported improvement equivalent to its inputs by construction. For the 3-19 BRL band that carries the headline result, the mask gamma_i is 1 whenever the market premium exceeds 0.1 BRL, so the training target is the market price itself; Black-Scholes enters the loss only as a fallback for low-premium samples, which if anything would pull the network toward the baseline and make the reported out-performance harder rather than easier to obtain. The paper's other load-bearing choices, including the input features, residual connections, and the hybrid loss, are adopted from external prior work or are standard regression and architecture choices, not from the authors' own prior results; there are no self-citations, no imported uniqueness theorems, and no fitted parameter renamed as a prediction. The 64.3% figure quoted in the abstract and Section 4.3 is not a circularity but an internal arithmetic error: Table 3 reports DL MAE 1.3047 and Black-Scholes MAE 2.0295, which gives a 35.7% reduction, while 64.3% is the ratio DL/BS. The selection of the 3-19 BRL range after inspecting test-set plots is a data-snooping concern, not a construction-level circularity. No step in the paper reduces by definition to its own inputs.
Assumptions & free parameters
free parameters (5)
- Historical volatility window =
21 trading days; annualization factor sqrt(252)
- Market-price reliability threshold (gamma) =
0.1 BRL
- Reporting price range [3,19] BRL =
3 to 19 BRL
- Expiration filter =
1, 2, and 3 months to expiry
- Optuna hyperparameters =
learning rate 5.74e-5, hidden size 256, dropout 0.2414, weight decay 1.93e-4
assumptions (5)
- domain assumption The scraped B3 option files accurately capture Petrobras European call contracts and their premiums, strikes, and expirations.
- domain assumption The temporal train/validation/test split provides an independent evaluation of generalization.
- ad hoc to paper Black-Scholes without dividends is an appropriate benchmark for Petrobras options.
- ad hoc to paper Market premiums below 0.1 BRL are unreliable, so Black-Scholes prices are acceptable training targets for those samples.
- standard math The Black-Scholes closed-form formula and standard normal CDF are accepted background mathematics.
Cite this review
Pith. "Pith review of Deep Learning vs. Black-Scholes: Option Pricing Performance on Brazilian Petrobras Stocks." pith.science (2026). https://pith.science/paper/XTBZ3EVZ
@misc{pith2026250420088,
  author       = {Pith},
  title        = {Pith review of: Deep Learning vs. Black-Scholes: Option Pricing Performance on Brazilian Petrobras Stocks},
  year         = {2026},
  howpublished = {\url{https://pith.science/paper/XTBZ3EVZ}},
  note         = {Machine review of arXiv:2504.20088}
}
read the original abstract
This paper explores the use of deep residual networks for pricing European options on Petrobras, one of the world's largest oil and gas producers, and compares its performance with the Black-Scholes (BS) model. Using eight years of historical data from B3 (Brazilian Stock Exchange) collected via web scraping, a deep learning model was trained using a custom built hybrid loss function that incorporates market data and analytical pricing. The data for training and testing were drawn between the period spanning November 2016 to January 2025, using an 80-20 train-test split. The test set consisted of data from the final three months: November, December, and January 2025. The deep residual network model achieved a 64.3\% reduction in the mean absolute error for the 3-19 BRL (Brazilian Real) range when compared to the Black-Scholes model on the test set. Furthermore, unlike the Black-Scholes solution, which tends to decrease its accuracy for longer periods of time, the deep learning model performed accurately for longer expiration periods. These findings highlight the potential of deep learning in financial modeling, with future work focusing on specialized models for different price ranges.
Figures


Figures from the paper (4 more)


Reference graph
Works this paper leans on
-
[1]
Louis Bachelier. Théorie de la spéculation. PhD thesis, École Normale Supérieure de Paris, Paris, 1900
work page 1900
-
[2]
The pricing of options and corporate liabilities
Fischer Black and Myron Scholes. The pricing of options and corporate liabilities. Journal of political economy, 81(3):637–654, 1973. 10 Deep Learning vs. Black-Scholes: Option Pricing Performance on Brazilian Petrobras Stocks
work page 1973
-
[3]
Theory of rational option pricing
Robert C Merton et al. Theory of rational option pricing. 1971
work page 1971
-
[4]
Market and industry factors in stock price behavior
Benjamin F King. Market and industry factors in stock price behavior. the Journal of Business, 39(1):139–190, 1966
work page 1966
-
[5]
A non-random walk down wall street
Andrew W Lo and A Craig MacKinlay. A non-random walk down wall street. In A Non-Random Walk Down Wall Street. Princeton University Press, 2011
work page 2011
-
[6]
The valuation of american put options
Michael J Brennan and Eduardo S Schwartz. The valuation of american put options. The Journal of Finance, 32(2):449–462, 1977
work page 1977
-
[7]
Jiequn Han, Arnulf Jentzen, and E Weinan. Deep neural network framework based on backward stochastic differential equations for pricing and hedging american options in high dimensions. Quantitative Finance, 18(10):1635–1654, 2018
work page 2018
-
[8]
Sebastian Becker, Patrick Cheridito, and Arnulf Jentzen. Deep optimal stopping. Journal of Machine Learning Research, 20(74):1–25, 2019
work page 2019
Show all 24 references
-
[9]
Stable multilevel deep neural networks for option pricing and xvas using forward-backward stochastic differential equations
Jean-Pierre Fouque and Xiaofeng Zhang. Stable multilevel deep neural networks for option pricing and xvas using forward-backward stochastic differential equations. Mathematical Finance, 32:789–813, 2022
2022
-
[10]
A nonparametric approach to pricing and hedging derivative securities via learning networks
James M Hutchinson, Andrew W Lo, and Tomaso Poggio. A nonparametric approach to pricing and hedging derivative securities via learning networks. The journal of Finance, 49(3):851–889, 1994
1994
-
[11]
A neural network model for estimating option prices
Mary Malliaris and Linda Salchenberger. A neural network model for estimating option prices. Applied Intelligence, 3:193–206, 1993
1993
-
[12]
Pricing and hedging derivative securities with neural networks and a homogeneity hint
René Garcia and Ramazan Gençay. Pricing and hedging derivative securities with neural networks and a homogeneity hint. Journal of Econometrics, 94(1-2):93–115, 2000
2000
-
[13]
Option pricing based on the residual neural network
Lirong Gan and Wei-han Liu. Option pricing based on the residual neural network. Computational Economics, 63(4):1327–1347, 2024
2024
-
[14]
Option pricing model combining ensemble learning methods and network learning structure
Miao Wang, Yunfeng Zhang, Chao Qin, Peipei Liu, and Qiuyue Zhang. Option pricing model combining ensemble learning methods and network learning structure. Mathematical Problems in Engineering, 2022(1):2590940, 2022
2022
-
[15]
Neural networks for option pricing and hedging: a literature review
Johannes Ruf and Weiguan Wang. Neural networks for option pricing and hedging: a literature review. arXiv preprint arXiv:1911.05620, 2019
1911 arXiv
-
[16]
Deep learning artificial neural network for pricing multi-asset european options
Jian Zhou and Yuhong Wang. Deep learning artificial neural network for pricing multi-asset european options. Journal of Computational Finance, 26(4):45–72, 2023
2023
-
[17]
Accelerated american option pricing with deep neural networks
Li Chen and Fei Liu. Accelerated american option pricing with deep neural networks. Quantitative Finance, 23:1120–1135, 2023
2023
-
[18]
Neural network learning of black-scholes equation for option pricing, 2024
Daniel de Souza Santos and Tiago Alessandro Espínola Ferreira. Neural network learning of black-scholes equation for option pricing, 2024
2024
-
[19]
Cs230: Deep learning - option pricing with deep learning, 2019
Alexander Ke and Andrew Yang. Cs230: Deep learning - option pricing with deep learning, 2019
2019
-
[20]
A deep learning approach for option pricing in emerging markets
Baris Yilmaz and Cihan Kaya. A deep learning approach for option pricing in emerging markets. Emerging Markets Review, 47:100758, 2021
2021
-
[21]
Deep residual learning for image recognition
Kaiming He, Xiangyu Zhang, Shaoqing Ren, and Jian Sun. Deep residual learning for image recognition. In Proceedings of the IEEE Conference on Computer Vision and Pattern Recognition, pages 770–778, 2016
2016
-
[22]
Batch normalization: Accelerating deep network training by reducing internal covariate shift
Sergey Ioffe and Christian Szegedy. Batch normalization: Accelerating deep network training by reducing internal covariate shift. In Proceedings of the 32nd International Conference on Machine Learning (ICML), pages 448–456, 2015
2015
-
[23]
Kingma and Jimmy Ba
Diederik P. Kingma and Jimmy Ba. Adam: A method for stochastic optimization. In International Conference on Learning Representations (ICLR), 2015
2015
-
[24]
Optuna: A next-generation hyperparameter optimization framework
Takuya Akiba, Shotaro Sano, Toshihiko Yanase, Takeru Ohta, and Masanori Koyama. Optuna: A next-generation hyperparameter optimization framework. In Proceedings of the 25th ACM SIGKDD International Conference on Knowledge Discovery and Data Mining, pages 2623–2631. ACM, 2019. 11
2019
Reviewed August 16, 2026 · model on record in the stance chip above.
Discussion (0). Continue with ORCID to comment.