Multi-site modelling and reconstruction of past extreme skew surges along the French Atlantic coast
Pith reviewed 2026-05-22 16:44 UTC · model grok-4.3
The pith
A novel threshold selection method together with multivariate generalized Pareto modeling and angle-based regression reconstructs historical extreme skew surges at limited-data stations from long-record neighbors.
A machine-rendered reading of the paper's core claim, the machinery that carries it, and where it could break.
Core claim
The central claim is that a new threshold choice for multivariate extremes, the generative properties of the multivariate generalized Pareto distribution, and an angle-only extreme regression together permit accurate reconstruction of past extreme skew surge time series at data-sparse coastal stations by transferring information from nearby long-record stations.
What carries the argument
The multivariate generalized Pareto distribution for joint extremes, paired with an angle-based extreme regression that uses only the normalized direction of the inputs for point predictions.
If this is right
- Historical extreme skew surge series become available at stations that previously had too few observations for reliable analysis.
- Coastal risk assessments gain from longer and more complete records of joint extremes across the station network.
- Information from over 150 years of data at Brest and Saint-Nazaire can be propagated to other sites along the French Atlantic coast.
- Extremal dependence between stations is explicitly modeled rather than treated as independent.
Where Pith is reading between the lines
- The same reconstruction pipeline could be tested on other coastal networks where some gauges have short histories but neighbors have long ones.
- Adding covariates such as sea-level rise or storm-track changes might extend the method to future-projection settings.
- Validation against any newly recovered archival surge records at the target stations would provide an external check on the reconstructions.
Load-bearing premise
The dependence pattern among extreme skew surges at different stations stays stable enough over time to be captured by the multivariate generalized Pareto distribution and the angle representation.
What would settle it
Direct comparison of the reconstructed extreme values at a short-record station against any independent historical observations or against the physical patterns expected from the nearest long-record stations would show large systematic mismatches.
Figures






read the original abstract
Appropriate modelling of extreme skew surges is crucial, particularly for coastal risk management. Our study focuses on modelling extreme skew surges along the French Atlantic coast, with a particular emphasis on investigating the extremal dependence structure between stations. We employ the peak-over-threshold framework, where a multivariate extreme event is defined whenever at least one location records a large value, though not necessarily all stations simultaneously. A novel method for determining an appropriate level (threshold) above which observations can be classified as extreme is proposed. Two complementary approaches are explored. First, the multivariate generalized Pareto distribution is employed to model extremes, leveraging its properties to derive a generative model that predicts extreme skew surges at one station based on observed extremes at nearby stations. Second, a novel extreme regression framework is assessed for point predictions. This specific regression framework enables accurate point predictions using only the 'angle' of input variables, i.e., input variables divided by their norms. The ultimate objective is to reconstruct historical skew surge time series at stations with limited data. This is achieved by integrating extreme skew surge data from stations with longer records, such as Brest and Saint-Nazaire, which provide over 150 years of observations.
Editorial analysis
A structured set of objections, weighed in public.
Referee Report
Summary. The paper proposes a multi-site framework for extreme skew surges on the French Atlantic coast. It introduces a novel threshold selection method in the peak-over-threshold approach, models joint extremes via the multivariate generalized Pareto distribution (GPD) to enable generative predictions at one station from observed extremes at others, and develops an angle-based extreme regression that performs point predictions using only normalized input directions. The central objective is to reconstruct historical extreme skew surge series at short-record stations by borrowing strength from long-record stations such as Brest and Saint-Nazaire (>150 years).
Significance. If the dependence structure proves stable and the models are properly validated, the generative multivariate GPD and angle-based regression could provide a practical way to extend extreme-event records for coastal risk assessment, leveraging the network of stations with heterogeneous record lengths.
major comments (3)
- [Results / validation sections] No quantitative validation (error metrics, cross-validation scores, or out-of-sample reconstruction accuracy) is reported for either the generative predictions from the multivariate GPD or the angle-based point reconstructions, so the claim of 'accurate reconstruction' remains unverified.
- [Dependence modeling and results] No formal test of temporal stability of the extremal dependence structure is presented (e.g., split-sample fits before/after 1950, trend tests on dependence parameters, or stationarity checks over the 150-year window), which is load-bearing for the historical reconstruction claim.
- [Extreme regression framework] The angle-based regression framework asserts that normalized directions alone suffice for accurate tail predictions, yet no direct comparison is given showing that this representation retains predictive power relative to the full vector input for extreme events.
minor comments (2)
- [Abstract] The abstract describes objectives and methods but supplies no empirical results or performance metrics; adding a brief statement of key findings would improve clarity.
- [Threshold selection method] Clarify the precise algorithmic steps and any tuning parameters of the proposed novel threshold method, and contrast it explicitly with standard diagnostics such as mean residual life plots.
Simulated Author's Rebuttal
We thank the referee for their insightful comments on our manuscript. We address each of the major concerns point by point below, proposing specific revisions to enhance the validation and robustness of our multi-site extreme modeling framework.
read point-by-point responses
-
Referee: [Results / validation sections] No quantitative validation (error metrics, cross-validation scores, or out-of-sample reconstruction accuracy) is reported for either the generative predictions from the multivariate GPD or the angle-based point reconstructions, so the claim of 'accurate reconstruction' remains unverified.
Authors: We agree that quantitative validation is essential to substantiate the reconstruction claims. In the revised manuscript, we will add a dedicated validation subsection including error metrics such as root mean squared error and continuous ranked probability scores for the generative multivariate GPD predictions. Additionally, we will report cross-validation results and out-of-sample accuracy for the angle-based reconstructions at stations with shorter records, using data from long-record stations like Brest. revision: yes
-
Referee: [Dependence modeling and results] No formal test of temporal stability of the extremal dependence structure is presented (e.g., split-sample fits before/after 1950, trend tests on dependence parameters, or stationarity checks over the 150-year window), which is load-bearing for the historical reconstruction claim.
Authors: The referee correctly identifies a key assumption in our historical reconstruction approach. Although the physical drivers of skew surges along the Atlantic coast suggest relative stability, we will incorporate formal tests of temporal stability. This will include split-sample fits comparing dependence parameters before and after 1950, as well as trend analyses on the extremal dependence measures to confirm the validity of extending records over the 150-year period. revision: yes
-
Referee: [Extreme regression framework] The angle-based regression framework asserts that normalized directions alone suffice for accurate tail predictions, yet no direct comparison is given showing that this representation retains predictive power relative to the full vector input for extreme events.
Authors: To strengthen the justification for the angle-based approach, we will include a comparative analysis in the revised paper. Specifically, we will contrast the predictive performance of the normalized direction inputs against the full vector inputs for extreme events, using metrics focused on tail behavior such as the accuracy of predicted exceedance probabilities and conditional expectations. revision: yes
Circularity Check
No significant circularity; derivation is self-contained
full rationale
The paper defines a novel threshold selection procedure and then applies standard multivariate GPD properties to construct a generative model that predicts values at one station conditional on extremes observed at others. The angle-based regression is separately defined as a model that takes only normalized direction vectors as input and is fitted to produce point predictions. Neither step reduces by construction to a quantity that was already defined in terms of the target output; the generative predictions and reconstructions are obtained from fitted parameters whose estimation is independent of the final reconstructed series. No load-bearing uniqueness theorem or ansatz is imported solely via self-citation, and the central reconstruction claim rests on the empirical stability of the fitted dependence structure rather than on a definitional identity.
Axiom & Free-Parameter Ledger
free parameters (1)
- threshold level
axioms (2)
- domain assumption The multivariate generalized Pareto distribution adequately captures the joint tail behavior of skew surges across stations.
- ad hoc to paper The angle (direction) of input variables contains sufficient information for accurate extreme point predictions.
Reference graph
Works this paper leans on
-
[1]
K. Bellinghausen, B. Hünicke, and E. Zorita. Using random forests to predict extreme sea-levels at the Baltic coast at weekly timescales.EGUsphere, 2024:1–52,
work page 2024
-
[2]
C. Chadenas, A. Creach, and D. Mercier. The impact of storm Xynthia in 2010 on coastal flood prevention policy in France.Journal of Coastal Conservation, 18:529–538,
work page 2010
-
[3]
Weak Signals and Heavy Tails: Learning Theory meets Extreme Value Analysis
S. Clémençon and A. Sabourin. Weak signals and heavy tails: Machine-learning meets extreme value theory. arXiv preprint arXiv:2504.06984,
work page internal anchor Pith review Pith/arXiv arXiv
-
[4]
ISSN 1932-6157. A. C. Davison and R. Huser. Statistics of extremes.Annual Review of Statistics and its Application, 2(1): 203–235,
work page 1932
-
[5]
M. P. Wadey, I. D. Haigh, R. J. Nicholls, J. M. Brown, K. Horsburgh, B. Carroll, S. L. Gallop, T. Mason, and E. Bradshaw. A comparison of the 31 January–1 February 1953 and 5–6 December 2013 coastal flood events around the UK.Frontiers in Marine Science, 2:84,
work page 1953
-
[6]
J. Wang, J. A. Church, X. Zhang, and X. Chen. Improved sea level reconstruction from 1900 to 2019.Journal of Climate, 37(24):6453 – 6474,
work page 1900
-
[7]
For conciseness, we assumeI“ t1,...,nuin the main text. Finally, the origin is shifted: we subtract, from each component of the observations, the minimum value recorded overI, i.e., the observations considered in the main paper are pXB,i,XN,i,Yiq:“ pX ori B,i ´mB,Xori N,i ´mN,Y ori i ´mY q, foriPIand wherem B “min iPIXori B,i,m N “min iPIXori N,i andm Y “...
work page 1979
-
[8]
shows the rolling means and standard deviations at each station for the detrended data, visually confirming that the stationarity assumption is reasonable. Table 3: p-values of the ADF test (alternative hypothesis: stationarity) and the KPSS test (alternative hypothesis: non-stationarity) for the time series at the three stations. Bold values indicate str...
work page 2018
-
[9]
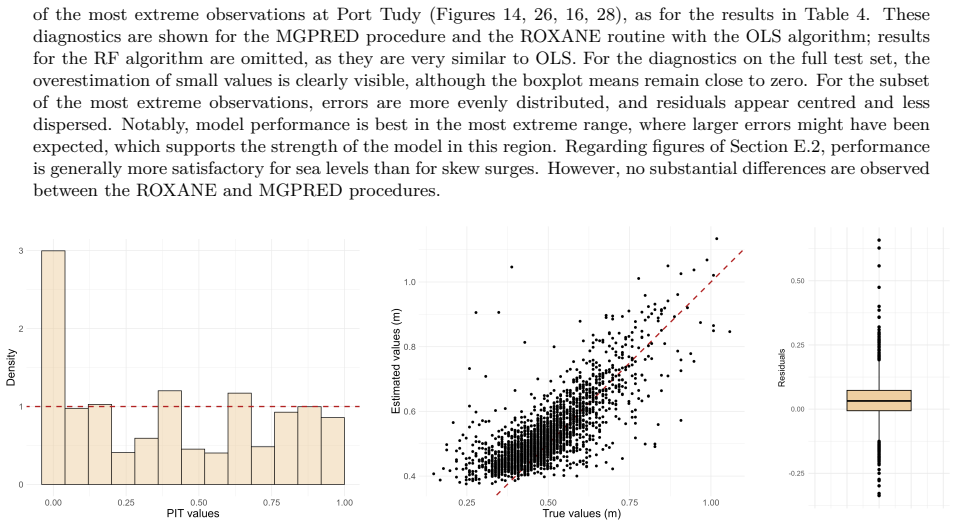
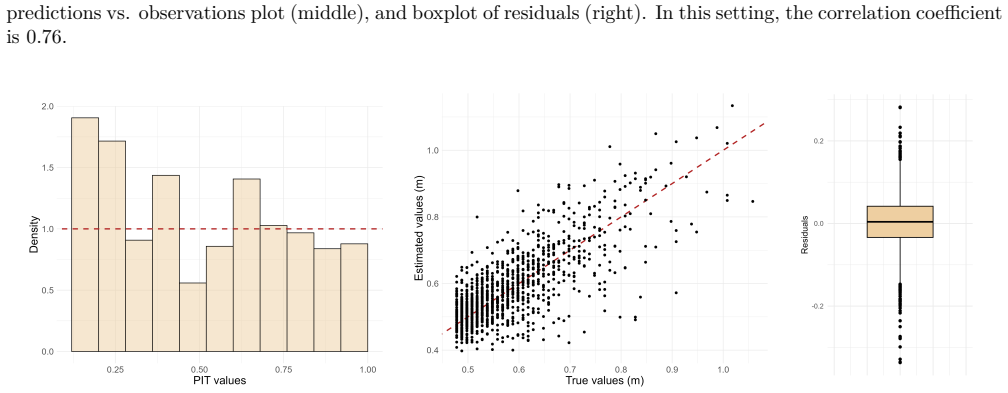
These diagnostics are shown for the MGPRED procedure and the ROXANE routine with the OLS algorithm; results for the RF algorithm are omitted, as they are very similar to OLS. For the diagnostics on the full test set, the overestimation of small values is clearly visible, although the boxplot means remain close to zero. For the subset of the most extreme o...
work page 1999
-
[10]
Refer to Sections 5, B and E.1 for details about the figures
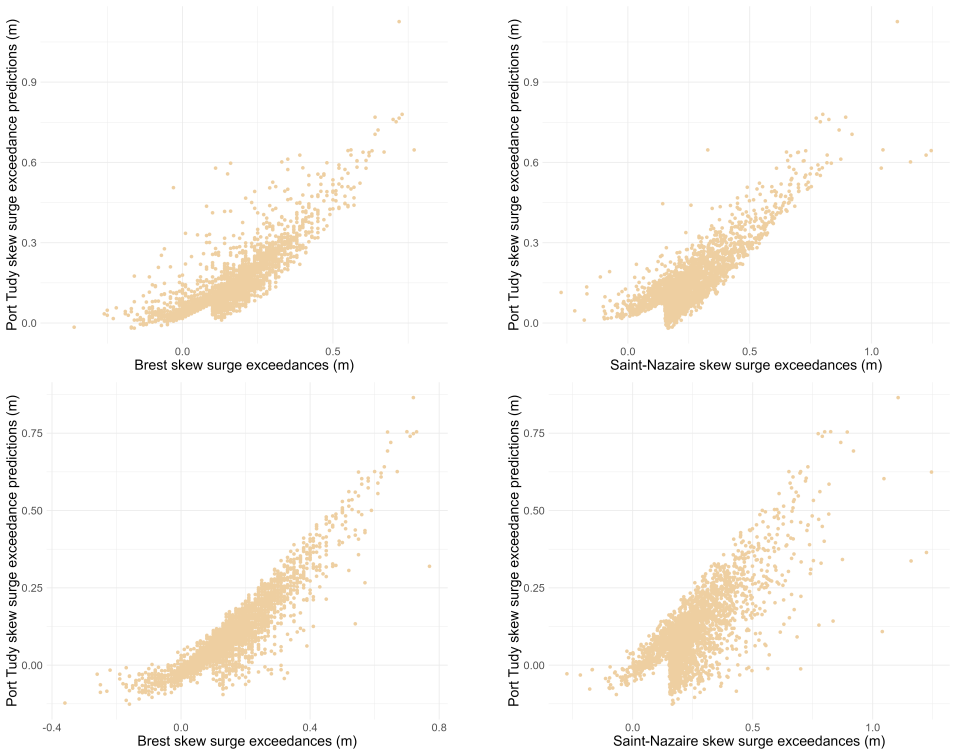
After thresholding, the final training set consists of 2,465 sea level exceedances, while final test set consists of 2,315 sea level exceedances. Refer to Sections 5, B and E.1 for details about the figures. E.2.1 Stationarity tests Table 5: p-values of the ADF test (alternative hypothesis: stationarity) and the KPSS test (alternative hypothesis: non-stat...
work page 2000
-
[11]
Figure 21: Histograms of sea level exceedances above the threshold specified in Table 7 at the three stations Brest (left), Saint-Nazaire (middle) and Port Tudy (right), from 01/12/2000 to 31/12/2023. The darkblue curves represent the fitted EGP densities above the thresholds, with parameters specified in Table
work page 2000
-
[12]
The green curves represent the fitted GP densities. Table 7: Point estimates of the parameters of the fitted EGP distribution for sea level exceedances at the three stations. The chosen thresholds, determined using via Algorithm 1, are shown in thetrows. The data used for inference are from the training set ranging from 01/12/2000 to 31/12/2023. Parameter...
work page 2000
-
[13]
39 Figure 32: QQ-plots comparing observed sea level (left) and skew surge (right) exceedances of the Concarneau test set (x-axis), ranging from 28/06/1999 to 31/12/2010, to predicted data (y-axis) from the algorithms of Sections 4.2 and 4.3. The plots show results from the ROXANE procedure with RF regression (top row), ROXANE procedure with OLS regression...
work page 1999
-
[14]
42 Figure 34: QQ-plots comparing observed sea level (left) and skew surge (right) exceedances of the Le Crouesty test set (x-axis), ranging from 14/03/1996 to 31/12/2014, to predicted data (y-axis) from the algorithms of Sections 4.2 and 4.3. The plots show results from the ROXANE procedure with RF regression (top row), ROXANE procedure with OLS regressio...
work page 1996
discussion (0)
Sign in with ORCID, Apple, or X to comment. Anyone can read and Pith papers without signing in.