REVIEW 2 major objections 5 minor 135 references
A Survey Of Model Fits to Brown Dwarf Spectra Through the L-T Sequence
T0 review · 2 major / 5 minor · reviewed 2026-08-16 · deepseek-v4-flash
Pith's one-line read Clouds shape near-infrared brown dwarf spectra more than disequilibrium chemistry, and silicate clouds persist through late T types.
desk verdict A careful, large-sample model-fit survey that is a useful benchmark, but the headline claim about clouds vs. disequilibrium chemistry is stronger than the grids can support. read the letter →
The pith
A machine-rendered reading of the paper's core claim, the machinery that carries it, and where it could break.
The reading
What carries the argument
The fitting machinery is the $G_K$ statistic of Cushing et al. (2008), minimized with Nelder-Mead optimization over forward-model grids: cloud-free equilibrium Bobcat, cloud-free disequilibrium Cholla, and cloudy equilibrium Diamondback models from Sonora, plus Phoenix models with parameterized clouds and mixing. The load-bearing comparison is simply which grid wins the fit: Diamondback wins nearly every object, and that win carries the cloud-versus-disequilibrium conclusion. Composite two-model spectra are used to test binarity for poorly fit objects.
What would settle it
Fit the same 301 spectra with models or retrievals that allow clouds and disequilibrium chemistry to vary together; if cloud-free disequilibrium models match late-T near-infrared spectra as well as cloudy equilibrium models do, the cloud-dominance claim would collapse. A cleaner test: mid-infrared spectra of the same late-T objects that show strong disequilibrium markers such as CO or NH3 while near-infrared cloud opacity is absent would contradict the paper's picture.
Extended reading notes
Core claim
The paper argues that across 301 L0-T8 brown dwarfs, cloudy equilibrium atmosphere models (Sonora Diamondback) fit near-infrared spectra better than cloud-free disequilibrium models (Cholla) almost without exception, all the way until the Diamondback temperature grid ends at 900 K. The authors read this as evidence that clouds imprint the near-infrared spectrum more strongly than disequilibrium chemistry does, and that silicate clouds remain high enough to affect near-infrared light through late T types even though mid-infrared silicate emission vanishes after L8. The paper also reports that best-fit temperatures plateau near 1400 K across the L/T transition, cloud sedimentation efficiency increases and cloud decks thin and sink with later types, and surface gravity is poorly constrained by near-infrared fits; it further classifies deviant spectra into four morphology families, two of which are likely binary systems.
Load-bearing premise
The conclusion assumes the grid comparison isolates cloud effects from mixing effects, but no grid includes both clouds and disequilibrium chemistry simultaneously, and the Cholla grid only covers 500-1300 K, so the relative importance of the two is inferred rather than directly tested.
Editorial extensions
If this is right
- If clouds dominate, then near-infrared spectra alone cannot be used to measure disequilibrium chemistry or precise surface gravities without first modeling cloud opacity.
- Silicate clouds in late T dwarfs should produce detectable near-infrared opacity that mid-infrared surveys miss, so combined near- and mid-infrared fits will be needed to locate cloud bases.
- The L/T temperature plateau and the blueward J-K swing are consistent with cloud clearing and methane condensation happening at the same stage.
- Best-fit cloud parameters imply a continuous evolution from thick small-grain cloud decks in L dwarfs to thin deep large-grain clouds in T dwarfs, not an abrupt loss of clouds.
- Spectral families with flat or double-peaked H bands are likely unresolved L+T binaries, so binary fraction estimates from photometry may miss these systems.
Reading between the lines
- A model grid that varies clouds and vertical mixing simultaneously might reassign some late-T objects to disequilibrium chemistry, narrowing but not necessarily overturning the cloud-dominance claim.
- If the cloud-dominance result holds, abundance retrievals of T dwarfs from near-infrared spectra should include cloud priors, otherwise methane and water abundances could be biased.
- The rising $f_{\mathrm{sed}}$ with later type predicts that silicate cloud opacity should be visible in JWST mid-infrared spectra of early-to-mid T dwarfs, a testable extension of the paper's near-infrared result.
- The $\log(g)$-metallicity degeneracy on collision-induced absorption offers a path to explain why atmospheric and evolutionary masses disagree; joint fitting of gravity-sensitive and metallicity-sensitive bands could break it.
Signed reviews
Editorial analysis
A structured set of objections, weighed in public.
Referee Report
Summary. The paper fits archival near-infrared SpeX spectra of 301 brown dwarfs (L0-T8) with the Sonora (Bobcat, Cholla, Diamondback) and Phoenix (Brock et al.) forward-model grids. Using the best-fit model parameters as physical estimates, the authors survey how effective temperature, surface gravity, metallicity, cloud properties, and vertical mixing vary through the L-T sequence, and benchmark their Teff and log g values against the evolutionary-model results of Sanghi et al. (2023). The main headline claim is that clouds have a more significant impact on near-infrared spectra than disequilibrium chemistry, and that silicate clouds influence the near-infrared through the late T types. The paper also identifies four spectral 'families' (triangular H-band, plateaued H-band, double-peaked H-band, and blue early T dwarfs) and discusses binarity and cloud-clearing as explanations.
Significance. If the headline claim holds, the paper would establish that near-infrared brown dwarf spectra are primarily shaped by cloud opacity rather than disequilibrium carbon chemistry, and that silicate cloud layers persist deeper into the T sequence than mid-infrared silicate emission features suggest. The survey's strengths are its large sample size, the use of an external evolutionary benchmark for Teff, the transparent treatment of grid-resolution limitations, and the public availability of fit products and heat maps on Zenodo. The paper is also candid about key limitations, including the absence of a Sonora grid that combines clouds and disequilibrium chemistry and the poor constraint on log g. However, the central cloud-versus-disequilibrium ranking and the 'clouds through late T' claim require additional analysis or substantial softening before they are fully supported.
major comments (2)
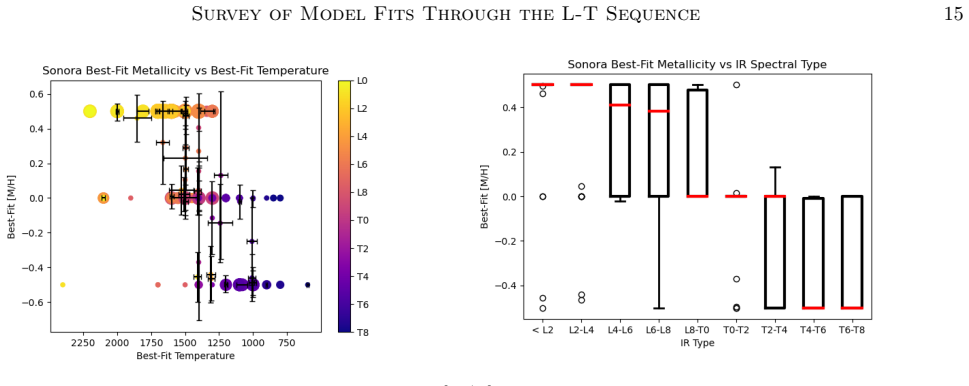
- [§5.1, §5.6, Table 1] The headline claim that clouds have a more significant impact on near-infrared spectra than disequilibrium chemistry is not cleanly supported by the model-selection comparison presented here. Diamondback models include clouds but assume chemical equilibrium, while Cholla models include disequilibrium chemistry but are cloudless; the two grids also differ in metallicity options and temperature coverage. A preference for Diamondback could therefore reflect greater grid flexibility rather than the physical dominance of cloud opacity. The manuscript acknowledges this in §5.6, but the abstract and Conclusion item 1 state the ranking without that caveat. The paper should either reframe the claim as 'the currently available cloudy equilibrium grids fit these spectra better than the currently available cloudless disequilibrium grids,' or add a controlled comparison. One viable path is to use the Phoenix grid described in §3.2, which does include both cloud parameters and log Kzz, and compare models at fixed cloud parameters while varying Kzz and vice versa; another is to use the fsed='nc' (no-cloud) option within Diamondback as an in-grid equilibrium control. Until such a comparison is shown, the relative-impact conclusion is underdetermined.
- [§5.5, Fig. 10, Conclusion item 6] The inference that silicate clouds influence the near-infrared spectrum through the late T types is weakened by the Diamondback temperature floor at 900 K. The persistence of fsed=8 into the mid- and late-T bins is cited in §5.5 as evidence that silicate clouds remain high enough to affect the near-infrared, but for any object whose best-fit temperature is at or below 900 K, no cloudy model is available in the Sonora grid. The apparent fsed=8 preference in late-T bins could thus be a boundary effect of the grid rather than evidence of cloud opacity. Please report the best-fit temperatures associated with the fsed=8 late-T points, state how many objects are fit at the 900 K grid edge, and either restrict the cloud-persistence claim to the temperature range actually covered by the cloudy models or present a test that does not rely on a grid boundary.
minor comments (5)
- [Abstract and §2.1] The sample size is given as '~300' in the abstract, 301 in §2.1, and 305 in the metadata abstract; please make these consistent throughout.
- [§5.5] The text says 'Both the Diamondback and Phoenix fits show an increase in mean grain size through the T-types,' but Diamondback's cloud parameter is fsed, which is only interpreted as a grain-size proxy. Please phrase this as 'increasing fsed, interpreted as larger grains' to avoid implying that grain size is a direct fitted parameter in Diamondback.
- [§6, Tables 2-8] The family membership is described as visually identified after quantitative sorting, but the final membership criteria are not fully reproducible from the R2 values alone. Please state explicitly that the quantitative metrics were used as sorting aids and that final membership required by-eye confirmation.
- [References] Several reference entries contain formatting artifacts (for example, 'I&;' in the Brown et al. and Prusti et al. entries, and accented characters rendered as 'Su´ arez'); please use a reference manager or otherwise clean these entries in the final version.
- [Fig. 1] The caption states that data points are color-coded by infrared spectral type, but the draft does not show a color bar or legend; please ensure the final figure includes one.
Circularity Check
No significant circularity: the central claims are model-selection and parameter-estimation results with an explicitly acknowledged grid limitation, not inputs renamed as predictions.
full rationale
The paper is an empirical model-fitting survey rather than a derivation from first principles, and I find no step in which a claimed result is equivalent to its inputs by construction. The headline claim that clouds matter more than disequilibrium chemistry is a model-selection outcome: Diamondback (cloudy, equilibrium) models outrank Cholla (cloud-free, disequilibrium) models in the fits, and the authors explicitly flag the central confound in Section 5.6: 'Neither the Sonora nor the Phoenix model sets have a complete cloudy, disequilibrium chemistry grid at this time.' That is a validity limitation, not circularity, because the preference for Diamondback is not guaranteed by the definition of either grid and the paper does not claim to have performed a controlled experiment separating clouds from chemistry. The silicate-clouds-through-late-T claim is likewise an interpretation of fitted cloud parameters (fsed, a0, Pc) that the paper consistently labels as best-fit estimates, and the fsed trend is compared with an external study (Stephens et al. 2009) rather than presented as an independent prediction. Teff results are benchmarked against the independent evolutionary-model values of Sanghi et al. (2023), supplying an external check that is not fitted from the same grid. The only self-citation (Stephens et al. 2009, co-authored by D. Stephens) is used for agreement with the fsed trend and is not load-bearing for the central claim. No equation is shown to reduce to another equation, and no fitted parameter is renamed as a prediction. Hence no significant circularity.
Assumptions & free parameters
free parameters (2)
- Best-fit model parameters (Teff, log g, [M/H], fsed, log Kzz, cloud grain size and Pc) =
Varied per object; reported in figures and tables
- Spectrum normalization scale factor Ck =
Optimized per object and model
assumptions (4)
- domain assumption Sonora and Phoenix forward model grids are accurate enough that best-fit parameters approximate physical properties.
- domain assumption SANGHI23 evolutionary-model parameters provide a valid external benchmark.
- domain assumption Not interpolating between model grid points is safer than interpolating.
- domain assumption The GK statistic with wi=1 and resampled errors gives meaningful relative model comparisons.
Cite this review
Pith. "Pith review of A Survey Of Model Fits to Brown Dwarf Spectra Through the L-T Sequence." pith.science (2026). https://pith.science/paper/EDMTHJUR
@misc{pith2026250500978,
  author       = {Pith},
  title        = {Pith review of: A Survey Of Model Fits to Brown Dwarf Spectra Through the L-T Sequence},
  year         = {2026},
  howpublished = {\url{https://pith.science/paper/EDMTHJUR}},
  note         = {Machine review of arXiv:2505.00978}
}
read the original abstract
We fit archival near-infrared spectra of 305 brown dwarfs with atmosphere models from the Sonora and Phoenix groups. Using the parameters of the best-fit models as estimates for the physical properties of the brown dwarfs in our sample, we have performed a survey of how brown dwarf atmospheres evolve with spectral type and temperature. We present the fit results and observed trends. We find that clouds have a more significant impact on near infrared spectra than disequilibrium chemistry, and that silicate clouds influence the near infrared spectrum through the late T types. We note where current atmosphere models are able to replicate the data and where the models and data conflict. We also categorize objects with similar spectral morphologies into families and discuss possible causes for their unique spectral traits. We identify two spectral families with morphologies that are likely indicative of binarity.
Figures


Figures from the paper (20 more)




Reference graph
Works this paper leans on
-
[1]
Ackerman, A. S., & Marley, M. S. 2001, The Astrophysical Journal, 556, 872–884, doi: 10.1086/321540
doi:10.1086/321540 2001
-
[2]
2011, AJ, 141, 203, doi: 10.1088/0004-6256/141/6/203
Albert, L., Artigau, ´E., Delorme, P., et al. 2011, AJ, 141, 203, doi: 10.1088/0004-6256/141/6/203
-
[3]
Allard, F., Hauschildt, P. H., Alexander, D. R., Tamanai, A., & Schweitzer, A. 2001, The Astrophysical Journal, 556, 357–372, doi: 10.1086/321547
doi:10.1086/321547 2001
-
[4]
Allard, F., Homeier, D., & Freytag, B. 2012, Philosophical Transactions of the Royal Society A: Mathematical, Physical and Engineering Sciences, 370, 2765–2777, doi: 10.1098/rsta.2011.0269
arXiv 2012
-
[5]
Allers, K. N., & Liu, M. C. 2013, ApJ, 772, 79, doi: 10.1088/0004-637X/772/2/79
-
[6]
Allers, K. N., Jaffe, D. T., Luhman, K. L., et al. 2007, The Astrophysical Journal, 657, 511–520, doi: 10.1086/510845
doi:10.1086/510845 2007
-
[7]
2015, A&A, 577, A42, doi: 10.1051/0004-6361/201425481 Bardalez Gagliuffi, D
Baraffe, I., Homeier, D., Allard, F., & Chabrier, G. 2015, A&A, 577, A42, doi: 10.1051/0004-6361/201425481 Bardalez Gagliuffi, D. C., Gelino, C. R., & Burgasser, A. J. 2015, AJ, 150, 163, doi: 10.1088/0004-6256/150/5/163 Bardalez Gagliuffi, D. C., Burgasser, A. J., Gelino, C. R., et al. 2014, ApJ, 794, 143, doi: 10.1088/0004-637X/794/2/143 Bardalez Gagliu...
-
[8]
2011, The Astrophysical Journal, 733, 65, doi: 10.1088/0004-637x/733/1/65
Marois, C. 2011, The Astrophysical Journal, 733, 65, doi: 10.1088/0004-637x/733/1/65
Show all 135 references
-
[9]
Best, W. M. J., Liu, M. C., Magnier, E. A., & Dupuy, T. J. 2020, The Astronomical Journal, 159, 257, doi: 10.3847/1538-3881/ab84f4
2020 doi
-
[10]
Best, W. M. J., Liu, M. C., Magnier, E. A., & Dupuy, T. J. 2021, AJ, 161, 42, doi: 10.3847/1538-3881/abc893
2021 doi
-
[11]
M., & Stone, J
Brock, L., Barman, T., Konopacky, Q. M., & Stone, J. M. 2021, The Astrophysical Journal, 914, 124, doi: 10.3847/1538-4357/abfc46
2021 doi
-
[12]
Brown, A. G. A., Vallenari, A., Prusti, T., et al. 2021, Astronomy I&; Astrophysics, 650, C3, doi: 10.1051/0004-6361/202039657e
2021 doi
-
[13]
2008, Physics Today
Burgasser, A. 2008, Physics Today
2008
-
[14]
Burgasser, A. J. 2007, ApJ, 659, 655, doi: 10.1086/511027
2007 doi
-
[15]
Burgasser, A. J. 2014, The SpeX Prism Library: 1000+
2014
-
[16]
https://arxiv.org/abs/1406.4887
Low-resolution, Near-infrared Spectra of Ultracool M, L, T and Y Dwarfs. https://arxiv.org/abs/1406.4887
-
[17]
J., Bardalez-Gagliuffi, D
Burgasser, A. J., Bardalez-Gagliuffi, D. C., & Gizis, J. E. 2011, AJ, 141, 70, doi: 10.1088/0004-6256/141/3/70
2011 doi
-
[18]
J., Cruz, K
Burgasser, A. J., Cruz, K. L., Cushing, M., et al. 2010, ApJ, 710, 1142, doi: 10.1088/0004-637X/710/2/1142
2010 doi
-
[19]
J., Dhital, S., & West, A
Burgasser, A. J., Dhital, S., & West, A. A. 2009, AJ, 138, 1563, doi: 10.1088/0004-6256/138/6/1563 34 Turner et al
2009 doi
-
[20]
D., & Golimowski, D
Kirkpatrick, J. D., & Golimowski, D. A. 2006, ApJ, 637, 1067, doi: 10.1086/498563
2006 doi
-
[21]
J., Kirkpatrick, J
Burgasser, A. J., Kirkpatrick, J. D., & Brown, M. E. 2001, The Classification of T Dwarfs. https://arxiv.org/abs/astro-ph/0101243
2001 arXiv
-
[22]
J., Kirkpatrick, J
Burgasser, A. J., Kirkpatrick, J. D., Cruz, K. L., et al. 2006, The Astrophysical Journal Supplement Series, 166, 585, doi: 10.1086/506327
2006 doi
-
[23]
J., Kirkpatrick, J
Burgasser, A. J., Kirkpatrick, J. D., Liebert, J., & Burrows, A. 2003a, ApJ, 594, 510, doi: 10.1086/376756
-
[24]
Dupuy, T. J. 2008a, ApJ, 681, 579, doi: 10.1086/588379
-
[25]
J., Looper, D
Burgasser, A. J., Looper, D. L., Kirkpatrick, J. D., Cruz, K. L., & Swift, B. J. 2008b, ApJ, 674, 451, doi: 10.1086/524726
-
[26]
J., Looper, D
Burgasser, A. J., Looper, D. L., Kirkpatrick, J. D., & Liu, M. C. 2007, ApJ, 658, 557, doi: 10.1086/511518
2007 doi
-
[27]
J., Marley, M
Burgasser, A. J., Marley, M. S., Ackerman, A. S., et al. 2002, The Astrophysical Journal, 571, L151–L154, doi: 10.1086/341343
2002 doi
-
[28]
J., & McElwain, M
Burgasser, A. J., & McElwain, M. W. 2006, AJ, 131, 1007, doi: 10.1086/499042
2006 doi
-
[29]
J., McElwain, M
Burgasser, A. J., McElwain, M. W., & Kirkpatrick, J. D. 2003b, AJ, 126, 2487, doi: 10.1086/378608
-
[30]
J., McElwain, M
Burgasser, A. J., McElwain, M. W., Kirkpatrick, J. D., et al. 2004, AJ, 127, 2856, doi: 10.1086/383549
2004 doi
-
[31]
K., Gonzales, E
Burningham, B., Faherty, J. K., Gonzales, E. C., et al. 2021, Monthly Notices of the Royal Astronomical Society, 506, 1944–1961, doi: 10.1093/mnras/stab1361
2021 doi
-
[32]
K., et al
Chiu, K., Fan, X., Leggett, S. K., et al. 2006, AJ, 131, 2722, doi: 10.1086/501431
2006 doi
-
[33]
L., Burgasser, A
Cruz, K. L., Burgasser, A. J., Reid, I. N., & Liebert, J. 2004, ApJL, 604, L61, doi: 10.1086/383415
2004 doi
-
[34]
L., Kirkpatrick, J
Cruz, K. L., Kirkpatrick, J. D., & Burgasser, A. J. 2009, The Astronomical Journal, 137, 3345–3357, doi: 10.1088/0004-6256/137/2/3345
2009 doi
-
[35]
L., N´ u˜ nez, A., Burgasser, A
Cruz, K. L., N´ u˜ nez, A., Burgasser, A. J., et al. 2018, AJ, 155, 34, doi: 10.3847/1538-3881/aa9d8a
2018 doi
-
[36]
Lowrance, P. J. 2003, AJ, 126, 2421, doi: 10.1086/378607
2003 doi
-
[37]
L., Reid, I
Cruz, K. L., Reid, I. N., Kirkpatrick, J. D., et al. 2007, AJ, 133, 439, doi: 10.1086/510132
2007 doi
-
[38]
2008, The Astrophysical Journal, 678, 1372–1395, doi: 10.1086/526489
Cushing, M., Marley, M., Saumon, D., et al. 2008, The Astrophysical Journal, 678, 1372–1395, doi: 10.1086/526489
2008 doi
-
[39]
C., Rayner, J
Cushing, M. C., Rayner, J. T., & Vacca, W. D. 2005, ApJ, 623, 1115, doi: 10.1086/428040
2005 doi
-
[40]
C., Roellig, T
Cushing, M. C., Roellig, T. L., Marley, M. S., et al. 2006, ApJ, 648, 614, doi: 10.1086/505637
2006 doi
-
[41]
Green, G. M. 2015, The Astrophysical Journal, 812, 128, doi: 10.1088/0004-637X/812/2/128
2015 doi
-
[42]
C., Harris, H
Dahn, C. C., Harris, H. C., Vrba, F. J., et al. 2002, AJ, 124, 1170, doi: 10.1086/341646
2002 doi
-
[43]
J., & Liu, M
Dupuy, T. J., & Liu, M. C. 2012, ApJS, 201, 19, doi: 10.1088/0067-0049/201/2/19 —. 2017, ApJS, 231, 15, doi: 10.3847/1538-4365/aa5e4c
2012 doi
-
[44]
K., Burgasser, A
Faherty, J. K., Burgasser, A. J., West, A. A., et al. 2010, AJ, 139, 176, doi: 10.1088/0004-6256/139/1/176
2010 doi
-
[46]
K., Rice, E
Faherty, J. K., Rice, E. L., Cruz, K. L., Mamajek, E. E., & N´ u˜ nez, A. 2012, The Astronomical Journal, 145, 2, doi: 10.1088/0004-6256/145/1/2
2012 doi
-
[47]
K., Burgasser, A
Faherty, J. K., Burgasser, A. J., Walter, F. M., et al. 2012, ApJ, 752, 56, doi: 10.1088/0004-637X/752/1/56
2012 doi
-
[48]
K., Riedel, A
Faherty, J. K., Riedel, A. R., Cruz, K. L., et al. 2016, The Astrophysical Journal Supplement Series, 225, 10, doi: 10.3847/0067-0049/225/1/10
2016 doi
-
[49]
R., Strauss, M
Fan, X., Knapp, G. R., Strauss, M. A., et al. 2000, AJ, 119, 928, doi: 10.1086/301224 Gagn´ e, J., Faherty, J. K., Cruz, K. L., et al. 2015, ApJS, 219, 33, doi: 10.1088/0067-0049/219/2/33 Gaia Collaboration, Prusti, T., de Bruijne, J. H. J., et al. 2016, A&A, 595, A1, doi: 10....
2000 doi
-
[50]
Gauza, B., B´ ejar, V. J. S., P´ erez-Garrido, A., et al. 2019, MNRAS, 487, 1149, doi: 10.1093/mnras/stz1284
2019 doi
-
[51]
R., Knapp, G
Geballe, T. R., Knapp, G. R., Leggett, S. K., et al. 2002, The Astrophysical Journal, 564, 466, doi: 10.1086/324078
2002 doi
-
[52]
R., & Burgasser, A
Gelino, C. R., & Burgasser, A. J. 2010, AJ, 140, 110, doi: 10.1088/0004-6256/140/1/110
2010 doi
-
[53]
Gizis, J. E. 2002, ApJ, 575, 484, doi: 10.1086/341259
2002 doi
-
[54]
E., Kirkpatrick, J
Gizis, J. E., Kirkpatrick, J. D., & Wilson, J. C. 2001, AJ, 121, 2185, doi: 10.1086/319937
2001 doi
-
[55]
E., Monet, D
Gizis, J. E., Monet, D. G., Reid, I. N., et al. 2000, AJ, 120, 1085, doi: 10.1086/301456
2000 doi
-
[56]
L., Covey, K
Hawley, S. L., Covey, K. R., Knapp, G. R., et al. 2002, AJ, 123, 3409, doi: 10.1086/340697
2002 doi
-
[57]
A., Liu, M
Hurt, S. A., Liu, M. C., Zhang, Z., et al. 2024, ApJ, 961, 121, doi: 10.3847/1538-4357/ad0b12
2024 doi
-
[58]
Karalidi, T., Marley, M., Fortney, J., et al. 2021a, Sonora Cholla: A Grid of Cloud-free, Solar Metallicity Models in Chemical Disequilibrium for the JWST Era, Zenodo, doi: 10.5281/ZENODO.4450269 Survey of Model Fits Through the L-T Sequence 35
-
[59]
J., et al
Karalidi, T., Marley, M., Fortney, J. J., et al. 2021b, The Astrophysical Journal, 923, 269, doi: 10.3847/1538-4357/ac3140
-
[60]
R., Delfosse, X., Mart´ ın, E
Kendall, T. R., Delfosse, X., Mart´ ın, E. L., & Forveille, T. 2004, A&A, 416, L17, doi: 10.1051/0004-6361:20040046
2004 doi
-
[61]
D., Barman, T
Kirkpatrick, J. D., Barman, T. S., Burgasser, A. J., et al. 2006, The Astrophysical Journal, 639, 1120–1128, doi: 10.1086/499622
2006 doi
-
[62]
D., Dahn, C
Kirkpatrick, J. D., Dahn, C. C., Monet, D. G., et al. 2001, AJ, 121, 3235, doi: 10.1086/321085
2001 doi
-
[63]
D., Reid, I
Kirkpatrick, J. D., Reid, I. N., Liebert, J., et al. 1999, The Astrophysical Journal, 519, 802, doi: 10.1086/307414
1999 doi
-
[64]
D., Reid, I
Kirkpatrick, J. D., Reid, I. N., Liebert, J., et al. 2000, AJ, 120, 447, doi: 10.1086/301427
2000 doi
-
[65]
D., Cruz, K
Kirkpatrick, J. D., Cruz, K. L., Barman, T. S., et al. 2008, The Astrophysical Journal, 689, 1295–1326, doi: 10.1086/592768
2008 doi
-
[66]
D., Looper, D
Kirkpatrick, J. D., Looper, D. L., Burgasser, A. J., et al. 2010, ApJS, 190, 100, doi: 10.1088/0067-0049/190/1/100
2010 doi
-
[67]
D., Gelino, C
Kirkpatrick, J. D., Gelino, C. R., Faherty, J. K., et al. 2021, The Astrophysical Journal Supplement Series, 253, 7, doi: 10.3847/1538-4365/abd107
2021 doi
-
[68]
R., Leggett, S
Knapp, G. R., Leggett, S. K., Fan, X., et al. 2004, AJ, 127, 3553, doi: 10.1086/420707
2004 doi
-
[69]
2013, MNRAS, 428, 2824, doi: 10.1093/mnras/sts208
Koen, C. 2013, MNRAS, 428, 2824, doi: 10.1093/mnras/sts208
2013 doi
-
[70]
Liebert, J., & Burgasser, A. J. 2007, ApJ, 655, 522, doi: 10.1086/509882
2007 doi
-
[71]
Liebert, J., & Gizis, J. E. 2006, PASP, 118, 659, doi: 10.1086/503333
2006 doi
-
[72]
D., Cruz, K
Liebert, J., Kirkpatrick, J. D., Cruz, K. L., et al. 2003, AJ, 125, 343, doi: 10.1086/345514
2003 doi
-
[73]
C., Dupuy, T
Liu, M. C., Dupuy, T. J., & Allers, K. N. 2016, ApJ, 833, 96, doi: 10.3847/1538-4357/833/1/96
2016 doi
-
[74]
C., Magnier, E
Liu, M. C., Magnier, E. A., Deacon, N. R., et al. 2013, ApJL, 777, L20, doi: 10.1088/2041-8205/777/2/L20
2013 doi
-
[75]
2004, Science, 303, 323–324, doi: 10.1126/science.1092865
Lodders, K. 2004, Science, 303, 323–324, doi: 10.1126/science.1092865
2004 doi
-
[76]
Kirkpatrick, J. D. 2008a, ApJ, 685, 1183, doi: 10.1086/590382
-
[77]
L., Kirkpatrick, J
Looper, D. L., Kirkpatrick, J. D., & Burgasser, A. J. 2007, AJ, 134, 1162, doi: 10.1086/520645
2007 doi
-
[78]
L., Kirkpatrick, J
Looper, D. L., Kirkpatrick, J. D., Cutri, R. M., et al. 2008b, ApJ, 686, 528, doi: 10.1086/591025
-
[79]
P., Burgasser, A
Lueber, A., Kitzmann, D., Bowler, B. P., Burgasser, A. J., & Heng, K. 2022, The Astrophysical Journal, 930, 136, doi: 10.3847/1538-4357/ac63b9
2022 doi
-
[80]
L., Patten, B
Luhman, K. L., Patten, B. M., Marengo, M., et al. 2007, ApJ, 654, 570, doi: 10.1086/509073
2007 doi
-
[81]
2019, AJ, 157, 101, doi: 10.3847/1538-3881/aaf88f
Manjavacas, E., Apai, D., Zhou, Y., et al. 2019, AJ, 157, 101, doi: 10.3847/1538-3881/aaf88f
2019 doi
-
[82]
2021a, Sonora Bobcat: cloud-free, substellar atmosphere models, spectra, photometry, evolution, and chemistry, Zenodo, doi: 10.5281/ZENODO.5063476
Marley, M., Saumon, D., Morley, C., et al. 2021a, Sonora Bobcat: cloud-free, substellar atmosphere models, spectra, photometry, evolution, and chemistry, Zenodo, doi: 10.5281/ZENODO.5063476
-
[83]
S., Saumon, D., & Goldblatt, C
Marley, M. S., Saumon, D., & Goldblatt, C. 2010, The Astrophysical Journal, 723, L117–L121, doi: 10.1088/2041-8205/723/1/l117
2010 doi
-
[84]
S., Seager, S., Saumon, D., et al
Marley, M. S., Seager, S., Saumon, D., et al. 2002, The Astrophysical Journal, 568, 335–342, doi: 10.1086/338800
2002 doi
-
[85]
S., Saumon, D., Visscher, C., et al
Marley, M. S., Saumon, D., Visscher, C., et al. 2021b, The Astrophysical Journal, 920, 85, doi: 10.3847/1538-4357/ac141d
-
[86]
H., Smart, R
Marocco, F., Andrei, A. H., Smart, R. L., et al. 2013, AJ, 146, 161, doi: 10.1088/0004-6256/146/6/161
2013 doi
-
[87]
Marocco, F., Jones, H. R. A., Day-Jones, A. C., et al. 2015, MNRAS, 449, 3651, doi: 10.1093/mnras/stv530
2015 doi
- [88]
-
[89]
M., Muirhead, P
McCarthy, A. M., Muirhead, P. S., Tamburo, P., et al. 2024b, ApJ, 965, 83, doi: 10.3847/1538-4357/ad2c76
-
[90]
W., & Burgasser, A
McElwain, M. W., & Burgasser, A. J. 2006, AJ, 132, 2074, doi: 10.1086/508199
2006 doi
-
[91]
2012, ApJ, 746, 23, doi: 10.1088/0004-637X/746/1/23
McLean, M., Berger, E., & Reiners, A. 2012, ApJ, 746, 23, doi: 10.1088/0004-637X/746/1/23
2012 doi
-
[92]
2008, ApJ, 676, 1281, doi: 10.1086/524721
Looper, D. 2008, ApJ, 676, 1281, doi: 10.1086/524721
2008 doi
-
[93]
E., Skemer, A
Miles, B. E., Skemer, A. J. I., Morley, C. V., et al. 2020, The Astronomical Journal, 160, 63, doi: 10.3847/1538-3881/ab9114
2020 doi
-
[94]
V., Fortney, J
Morley, C. V., Fortney, J. J., Marley, M. S., et al. 2012, The Astrophysical Journal, 756, 172, doi: 10.1088/0004-637x/756/2/172
2012 doi
-
[95]
V., Mukherjee, S., Marley, M
Morley, C. V., Mukherjee, S., Marley, M. S., et al. 2024, The Sonora Substellar Atmosphere Models. III. Diamondback: Atmospheric Properties, Spectra, and Evolution for Warm Cloudy Substellar Objects. https://arxiv.org/abs/2402.00758
2024 arXiv
-
[96]
E., Fortney, J
Mukherjee, S., Batalha, N. E., Fortney, J. J., & Marley, M. S. 2023a, The Astrophysical Journal, 942, 71, doi: 10.3847/1538-4357/ac9f48
-
[97]
J., Batalha, N
Mukherjee, S., Fortney, J. J., Batalha, N. E., et al. 2022, The Astrophysical Journal, 938, 107, doi: 10.3847/1538-4357/ac8dfb 36 Turner et al
2022 doi
-
[98]
2023b, The Sonora Substellar Atmosphere Models
Mukherjee, S., Fortney, J., Morley, C., et al. 2023b, The Sonora Substellar Atmosphere Models. IV. Elf Owl: Atmospheric Mixing and Chemical Disequilibrium with Varying Metallicity and C/O Ratios (L- type Models), Zenodo, doi: 10.5281/ZENODO.10385987
-
[99]
J., Morley, C
Mukherjee, S., Fortney, J. J., Morley, C. V., et al. 2024, The Astrophysical Journal, 963, 73, doi: 10.3847/1538-4357/ad18c2
2024 doi
-
[100]
S., Geballe, T
Noll, K. S., Geballe, T. R., & Marley, M. S. 1997, The Astrophysical Journal, 489, L87, doi: 10.1086/310954
1997 doi
-
[101]
S., Mart´ ın, E
Phan-Bao, N., Bessell, M. S., Mart´ ın, E. L., et al. 2008, MNRAS, 383, 831, doi: 10.1111/j.1365-2966.2007.12564.x
2008
-
[102]
W., Tremblin, P., Baraffe, I., et al
Phillips, M. W., Tremblin, P., Baraffe, I., et al. 2020a, A&A, 637, A38, doi: 10.1051/0004-6361/201937381 —. 2020b, A&A, 637, A38, doi: 10.1051/0004-6361/201937381
-
[103]
S., Hallinan, G., Kirkpatrick, J
Pineda, J. S., Hallinan, G., Kirkpatrick, J. D., et al. 2016, ApJ, 826, 73, doi: 10.3847/0004-637X/826/1/73
2016 doi
-
[104]
Prusti, T., de Bruijne, J. H. J., Brown, A. G. A., et al. 2016, Astronomy I&; Astrophysics, 595, A1, doi: 10.1051/0004-6361/201629272
2016 doi
-
[105]
2014, The Astrophysical Journal, 793, 75, doi: 10.1088/0004-637x/793/2/75
Radigan, J., Lafreni` ere, D., Jayawardhana, R., & Artigau, E. 2014, The Astrophysical Journal, 793, 75, doi: 10.1088/0004-637x/793/2/75
2014 doi
-
[106]
T., Toomey, D
Rayner, J. T., Toomey, D. W., Onaka, P. M., et al. 2003, Publications of the Astronomical Society of the Pacific, 115, 362, doi: 10.1086/367745
2003 doi
-
[107]
N., Cruz, K
Reid, I. N., Cruz, K. L., Kirkpatrick, J. D., et al. 2008, AJ, 136, 1290, doi: 10.1088/0004-6256/136/3/1290
2008 doi
-
[108]
N., Lewitus, E., Burgasser, A
Reid, I. N., Lewitus, E., Burgasser, A. J., & Cruz, K. L. 2006, ApJ, 639, 1114, doi: 10.1086/499484
2006 doi
-
[109]
2008, ApJ, 684, 1390, doi: 10.1086/590073
Reiners, A., & Basri, G. 2008, ApJ, 684, 1390, doi: 10.1086/590073
2008 doi
-
[110]
C., Best, W
Sanghi, A., Liu, M. C., Best, W. M., et al. 2023, The Hawaii Infrared Parallax Program. VI. The Fundamental Properties of 1000+ Ultracool Dwarfs and Planetary-mass Objects Using Optical to Mid-IR SEDs and Comparison to BT-Settl and ATMO 2020 Model Atmospheres. https://arxiv.or...
2023 arXiv
-
[111]
Saumon, D., & Marley, M. S. 2008, The Astrophysical Journal, 689, 1327–1344, doi: 10.1086/592734
2008 doi
-
[112]
Freedman, R. S. 2012, The Astrophysical Journal, 750, 74, doi: 10.1088/0004-637x/750/1/74
2012 doi
-
[113]
J., West, A
Schmidt, S. J., West, A. A., Burgasser, A. J., Bochanski, J. J., & Hawley, S. L. 2010a, AJ, 139, 1045, doi: 10.1088/0004-6256/139/3/1045
-
[114]
J., West, A
Schmidt, S. J., West, A. A., Hawley, S. L., & Pineda, J. S. 2010b, AJ, 139, 1808, doi: 10.1088/0004-6256/139/5/1808
-
[115]
C., Cushing, M
Schneider, A. C., Cushing, M. C., Kirkpatrick, J. D., et al. 2014, AJ, 147, 34, doi: 10.1088/0004-6256/147/2/34
2014 doi
-
[116]
C., Burgasser, A
Schneider, A. C., Burgasser, A. J., Bruursema, J., et al. 2023, The Astrophysical Journal Letters, 943, L16, doi: 10.3847/2041-8213/acb0cd
2023 doi
-
[117]
D., & Meusinger, H
Scholz, R. D., & Meusinger, H. 2002, MNRAS, 336, L49, doi: 10.1046/j.1365-8711.2002.05998.x
2002
-
[118]
S., & Cushing, M
Sheppard, S. S., & Cushing, M. C. 2009, AJ, 137, 304, doi: 10.1088/0004-6256/137/1/304
2009 doi
-
[119]
2007, PhD thesis, University of Arizona
Siegler, N. 2007, PhD thesis, University of Arizona
2007
-
[120]
F., Cutri, R
Skrutskie, M. F., Cutri, R. M., Stiening, R., et al. 2006, AJ, 131, 1163, doi: 10.1086/498708
2006 doi
-
[121]
L., Tinney, C
Smart, R. L., Tinney, C. G., Bucciarelli, B., et al. 2013, MNRAS, 433, 2054, doi: 10.1093/mnras/stt876
2013 doi
-
[122]
L., Bucciarelli, B., Jones, H
Smart, R. L., Bucciarelli, B., Jones, H. R. A., et al. 2018, MNRAS, 481, 3548, doi: 10.1093/mnras/sty2520
2018 doi
-
[123]
2012, The Astrophysical Journal, 760, 151, doi: 10.1088/0004-637x/760/2/151
Sorahana, S., & Yamamura, I. 2012, The Astrophysical Journal, 760, 151, doi: 10.1088/0004-637x/760/2/151
2012 doi
-
[124]
C., Leggett, S
Stephens, D. C., Leggett, S. K., Cushing, M. C., et al. 2009, The Astrophysical Journal, 702, 154–170, doi: 10.1088/0004-637x/702/1/154
2009 doi
-
[125]
2009, in American Institute of Physics Conference Series, Vol
Henning, T. 2009, in American Institute of Physics Conference Series, Vol. 1094, 15th Cambridge Workshop on Cool Stars, Stellar Systems, and the Sun, ed. E. Stempels (AIP), 561–564, doi: 10.1063/1.3099174 Su´ arez, G., & Metchev, S. 2022, MNRAS, 513, 5701, doi: 10.1093/mnras/s...
2009 doi
-
[126]
G., Burgasser, A
Tinney, C. G., Burgasser, A. J., & Kirkpatrick, J. D. 2003, AJ, 126, 975, doi: 10.1086/376481
2003 doi
-
[127]
G., Faherty, J
Tinney, C. G., Faherty, J. K., Kirkpatrick, J. D., et al. 2014, ApJ, 796, 39, doi: 10.1088/0004-637X/796/1/39
2014 doi
-
[128]
E., et al
Virtanen, P., Gommers, R., Oliphant, T. E., et al. 2020, Nature Methods, 17, 261, doi: 10.1038/s41592-019-0686-2
2020 doi
-
[129]
M., Burningham, B., Faherty, J
Vos, J. M., Burningham, B., Faherty, J. K., et al. 2023, The Astrophysical Journal, 944, 138, doi: 10.3847/1538-4357/acab58
2023 doi
-
[130]
J., Henden, A
Vrba, F. J., Henden, A. A., Luginbuhl, C. B., et al. 2004, AJ, 127, 2948, doi: 10.1086/383554
2004 doi
-
[131]
2000, Astronomy and Astrophysics Supplement Series, 143, 9–22, doi: 10.1051/aas:2000332
Wenger, M., Ochsenbein, F., Egret, D., et al. 2000, Astronomy and Astrophysics Supplement Series, 143, 9–22, doi: 10.1051/aas:2000332
2000 doi
-
[132]
J., Casey, A
Wheeler, A. J., Casey, A. R., & Abruzzo, M. W. 2024, Korg: fitting, model atmosphere interpolation, and Brackett lines. https://arxiv.org/abs/2310.19823
2024 arXiv
-
[133]
C., Kirkpatrick, J
Wilson, J. C., Kirkpatrick, J. D., Gizis, J. E., et al. 2001, AJ, 122, 1989, doi: 10.1086/323134 Survey of Model Fits Through the L-T Sequence 37
2001 doi
-
[134]
C., Miller, N
Wilson, J. C., Miller, N. A., Gizis, J. E., et al. 2003, in Brown Dwarfs, ed. E. Mart´ ın, Vol. 211, 197
2003
-
[135]
C., Marley, M
Zhang, Z., Liu, M. C., Marley, M. S., Line, M. R., & Best, W. M. J. 2021a, ApJ, 921, 95, doi: 10.3847/1538-4357/ac0af7 —. 2021b, ApJ, 916, 53, doi: 10.3847/1538-4357/abf8b2
-
[136]
H., Pokorny, R
Zhang, Z. H., Pokorny, R. S., Jones, H. R. A., et al. 2009, A&A, 497, 619, doi: 10.1051/0004-6361/200810314
2009 doi
Reviewed August 16, 2026 · model on record in the stance chip above.
Discussion (0). Continue with ORCID to comment.