REVIEW 3 major objections 5 minor 46 references
RVSNUpy: A Python Package for Spectroscopic Redshift Measurement Based on Cross-Correlation
T0 review · 3 major / 5 minor · reviewed 2026-08-16 · deepseek-v4-flash
Pith's one-line read The ~40 km/s redshift offset between SDSS and MMT/Hectospec is caused by small velocity offsets in the template spectra, not by the galaxies or the measurement tool.
desk verdict A convincing diagnosis that template offset, not the spectra or the tool, drives the SDSS/Hectospec redshift systematic, but the universal-template absolute calibration is anchored to FSPS and partly self-consistent with SDSS catalog redshifts, so the rest-frame claim is unproven. read the letter →
The pith
A machine-rendered reading of the paper's core claim, the machinery that carries it, and where it could break.
The reading
What carries the argument
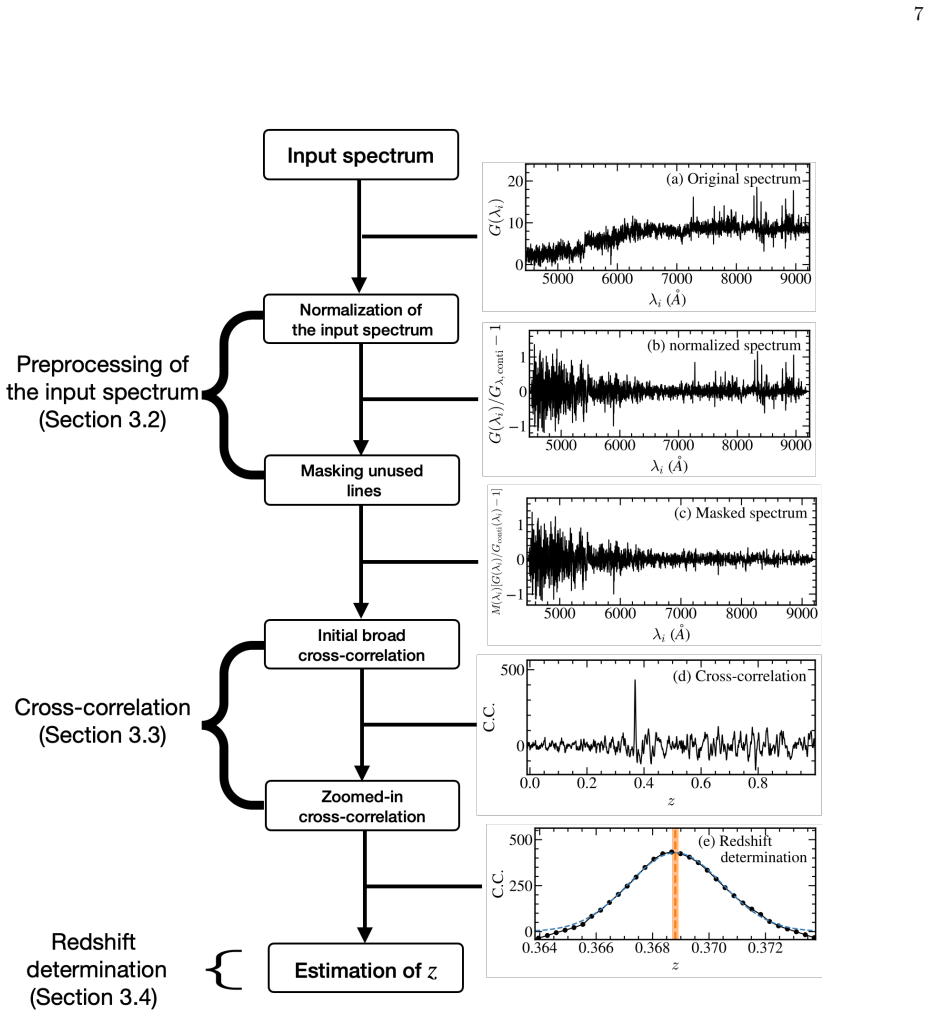
The load-bearing object is the rest-frame template spectrum. RVSNUpy computes $C.C.(z') = \sum_i M_i (\delta G_i/G'_i)^{-2} (G_i/G'_i - 1)(T_i(z')/T'_i(z') - 1)$, an inverse-variance weighted cross-correlation in real space that downweights noisy pixels and yields a Gaussian peak whose mean gives the redshift and whose width, combined with the r-value reliability statistic, gives the uncertainty and a reliability flag. The diagnosis that carries the paper's main claim is the template calibration test: templates themselves are treated as spectra and cross-correlated against the FSPS synthetic rest-frame set, exposing velocity zero-point offsets of 10–70 km/s. The universal template set, three SDSS galaxy templates shifted along the wavelength axis to match FSPS templates, is the instrument that turns the diagnosis into a practical fix, because cross-correlating any input spectrum against that single set removes the spectrograph-dependent offset.
What would settle it
Take a sample of galaxies with spectra from a third, independently calibrated spectrograph plus SDSS or Hectospec data, measure both with RVSNUpy and the same universal templates, and compare with that survey's pipeline redshifts; if a residual zero-point offset appears that tracks the third survey's reduction templates, the template-offset diagnosis is confirmed, but if the same templates still leave a spectrograph-dependent offset, the claim fails. A more direct check is to measure the absolute wavelength zero point of the FSPS templates with laboratory-calibrated arc spectra or precision stellar radial velocities; a nonzero offset would falsify the paper's rest-frame anchor.
Extended reading notes
Core claim
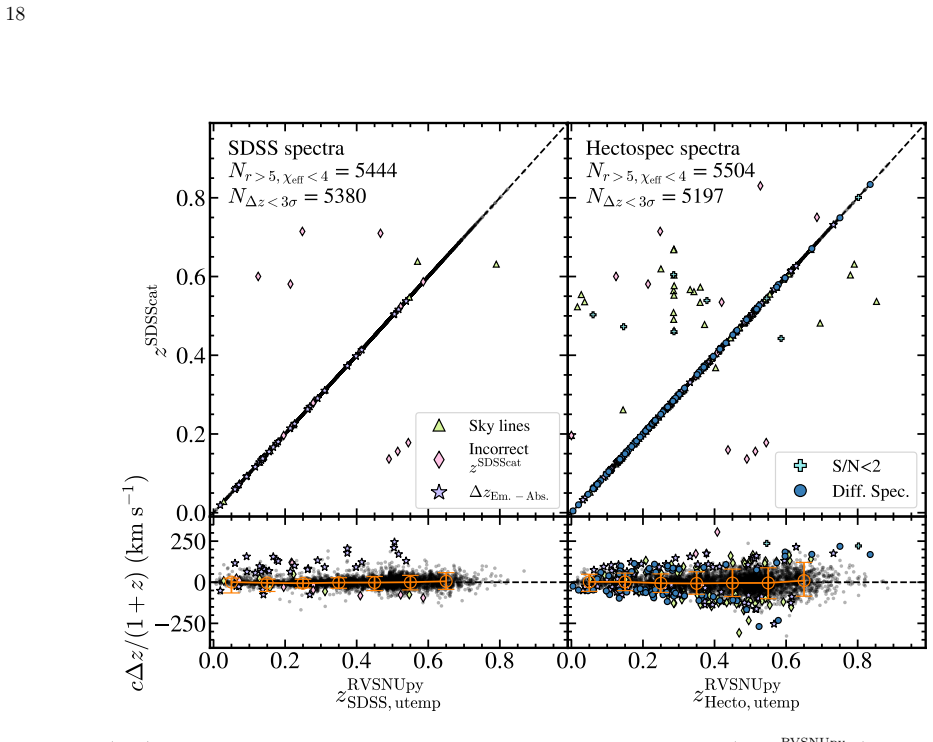
RVSNUpy recovers redshifts by shifting rest-frame template spectra across a logarithmic wavelength grid and computing an inverse-variance weighted cross-correlation, with continua removed by B-spline fits and the peak located by Gaussian fitting. Tested on synthetic single stellar population spectra, it reproduces input redshifts within ~20 km/s, with small systematic offsets that trace template calibration. On the HectoMAP sample, RVSNUpy redshifts from SDSS spectra with SDSS templates agree with SDSS catalog values (10.9 ± 12.6 km/s), while Hectospec spectra with Hectospec templates are offset by −37.3 ± 30.7 km/s, matching the offset reported in earlier HectoMAP work. Direct cross-correlation of the SDSS and Hectospec spectra themselves shows no such offset (−3.2 ± 45.1 km/s), and using FSPS templates on SDSS spectra nearly reproduces the catalog, ruling out the observed spectra and the tool as the source. Cross-correlating templates against FSPS synthetic spectra shows the Hectospec absorption templates are redshifted by tens of km/s relative to the rest frame, while SDSS templates are off by 10–20 km/s; accordingly, a universal set built from SDSS templates shifted to match FSPS yields −2.8 ± 17.3 km/s for SDSS spectra and −3.1 ± 38.6 km/s for Hectospec spectra relative to the SDSS catalog. The paper concludes that template zero-point offsets are the primary source of the inter-survey redshift offset and that one calibrated template set yields homogeneous redshifts across spectrographs.
Load-bearing premise
The universal template calibration assumes the FSPS synthetic spectra define the true rest frame; if the synthetic spectra carry a velocity zero-point offset of their own, the universal templates inherit it and the agreement with SDSS catalog redshifts becomes an internal consistency check rather than an absolute wavelength calibration.
Editorial extensions
If this is right
- Using one rest-frame-calibrated template set removes the ~40 km/s systematic offset between SDSS and MMT/Hectospec redshifts, so surveys can combine redshifts without an inter-survey zero-point correction.
- RVSNUpy with the universal templates reproduces SDSS catalog redshifts to within a few km/s for both SDSS and Hectospec spectra, with most outliers traced to low signal-to-noise, poor sky subtraction, or genuinely different spectra rather than method bias.
- Because the package measures a spectrum in 0.2–0.4 seconds and is model-independent, it is suited to large spectroscopic surveys such as A-SPEC, DESI, 4MOST, and Subaru/PFS.
- A rest-frame-calibrated template library becomes a community reference: any survey that adopts it gains redshifts directly comparable to SDSS's without re-running full spectral fitting.
- Template velocity offsets of 10–70 km/s are detectable by cross-correlating template spectra against synthetic rest-frame spectra, providing a simple quality check before survey data release.
Reading between the lines
- Beyond the paper: the same template-offset test can be applied to any pair of surveys; if the diagnosis is general, an inter-survey offset should reappear whenever overlapping spectra are reduced with differently calibrated template sets, and disappear when a common set is used.
- The universal templates are anchored to FSPS synthetic spectra, so the calibration is only as absolute as FSPS's own velocity zero point; a future absolute wavelength calibration of the synthetic models would upgrade the relative agreement into an absolute rest-frame standard.
- A testable extension: run RVSNUpy with universal templates on spectra from a third spectrograph, such as DESI or Subaru/PFS, and compare with that survey's pipeline redshifts; residual systematics would identify whether template zero-point offsets remain the dominant term at higher spectral resolution.
Signed reviews
Editorial analysis
A structured set of objections, weighed in public.
Referee Report
Summary. The manuscript presents RVSNUpy, an open-source Python package that measures spectroscopic redshifts by inverse-variance-weighted cross-correlation in real space, following Kelson et al. (2003). The mathematical framework, implementation steps, template requirements, and quality metrics (χ2_eff and r-value) are described in detail. The package is tested on FSPS synthetic SSP spectra and on roughly 6000 HectoMAP galaxies with both SDSS and MMT/Hectospec spectra. Using four observed-spectrum/template combinations, the authors show that the approximately 40 km/s SDSS-versus-Hectospec offset follows the template set rather than the observed spectra or the measurement tool. They then construct a 'universal template' set by shifting three empirical SDSS templates in wavelength to match FSPS SSP spectra, and show that RVSNUpy with these templates reproduces SDSS catalog redshifts at -2.8 km/s for SDSS spectra and -3.1 km/s for Hectospec spectra. The paper concludes that template zero-point offsets are the source of the inter-survey offset and that RVSNUpy is suitable for current and future large spectroscopic surveys.
Significance. If the central claim holds, the paper makes a concrete and useful contribution: it identifies the origin of a known redshift offset between SDSS and MMT/Hectospec measurements, provides an open-source tool with a clean four-way elimination experiment in Figure 9, and demonstrates that a common template set removes the largest part of the inter-survey offset. The four-combination test is a good falsifiable design, and the relative conclusion that template zero-point, not observed spectra or tool choice, sets the offset is well supported. The weaker point is the absolute rest-frame calibration: the universal templates are anchored to FSPS synthetic spectra and validated against a catalog measured with FSPS-based templates, so the absolute zero-point is not independently established. This limits the strength of the 'carefully calibrated to the rest frame' and future-survey accuracy claims, but it does not undermine the relative template-offset result.
major comments (3)
- [Section 6.3, Figures 7 and 10] The universal-template rest-frame calibration is anchored by shifting the SDSS templates to match FSPS SSP spectra, and the validation target zSDSScat is itself produced by Redmonster using FSPS-based galaxy templates. The -2.8 km/s agreement between z_SDSS,utemp and zSDSScat is therefore to a substantial degree a self-consistency check: if the FSPS spectra carry a velocity zero-point offset, the universal templates inherit it and the absolute calibration is untested. I request either an independent rest-frame anchor (for example, high signal-to-noise stellar spectra with known radial velocities from Gaia, or telluric/asteroid features) or a clearly qualified claim such as 'calibrated to the FSPS rest-frame convention' in the abstract and Section 6.3. This does not affect the relative conclusion from Figure 9 that template choice sets the inter-survey offset, but it does affect the 'carefully calibrated to the rest frame' and future-survey accuracy statements.
- [Section 6.3, Figure 10] The Hectospec universal-template validation shows a median offset of -3.1 km/s but a 1σ scatter of 38.6 km/s and 307/5504 (5.6%) outliers, while the SDSS comparison shows 17.3 km/s scatter and 1.1% outliers. The outlier census attributes 58% of the Hectospec outliers to 'intrinsic differences between the spectra', which is not a template effect. The paper does not state an a priori quantitative success criterion for the claim that the universal templates yield 'homogeneous redshifts' (for example, a required median offset, scatter, or outlier fraction relative to the quoted uncertainties). I ask for a stated success criterion and an error budget that separates template zero-point contributions, spectral-mismatch contributions, and measurement noise, so that the central performance claim is falsifiable.
- [Section 6.3, construction of universal templates] The procedure for constructing the universal templates is underspecified. The text states that 'we shifted three SDSS templates along the wavelength direction to match the FSPS templates,' but it does not state whether each template was shifted by its own measured offset from Figure 7 or by a common value, how the offsets in Figure 7 were estimated (for example, by Gaussian fitting to a cross-correlation peak), and what uncertainty in the adopted shift is propagated into the final redshift error budget. Because the entire absolute calibration rests on these shifts, the reproducibility and uncertainty of the construction should be documented explicitly.
minor comments (5)
- [Section 2.2, Eqs. (10)-(11)] The propagated uncertainty expression appears to contain duplications: the (δz)_fit term is added both inside and outside the square root, and the partial-derivative terms for h_c.c. and σ_c.c. may be missing cross terms. Please verify the derivation or state the simplifying assumptions used to obtain Eqs. (10) and (11).
- [Section 3.2] The B-spline knot span of 100 Å and the 75% masked-node merging rule are presented without a sensitivity test. Since these are user-set parameters that affect continuum removal, a brief dependence check (for example, knot spans of 50, 100, and 200 Å) would clarify their impact on redshift precision.
- [Sections 4 and 6.2] Please clarify the wavelength system of the FSPS synthetic templates used in the Section 6.2 comparisons and whether they are converted from vacuum to air before computing the offsets in Figure 7. The air-vacuum difference is about 85 km/s near 6000 Å, and an unstated conversion could contaminate the derived template offsets.
- [Throughout] There are several typographical errors, including 'R VSNUpy' in the abstract, 'RSNUpy' in Section 3.4, 'SSDS' and 'teampltes' in Section 6.2, 'habtemp90' vs. 'habetmp90' in Figure 7, and 'skylines' in Figure 12.
- [Section 2.3] The statement that χ2_eff = 4 'roughly corresponds to a 2σ difference' is not generally true without specifying the number of degrees of freedom; please either justify this calibration or rephrase it as a heuristic threshold.
Circularity Check
Template-offset diagnosis is self-contained; universal-template rest-frame calibration is anchored to FSPS and then validated against the FSPS-based SDSS catalog, so the absolute zero-point agreement is partly by construction.
-
self definitional
[Section 6.3 (universal template construction) with Section 6.1 (SDSS catalog reference); Figure 10]
"To calibrate the radial velocity offset of the SDSS templates shown in Figure 7 and 8, we shifted three SDSS templates (i.e., 'Early Type Galaxy', 'Luminous Red Galaxy', and 'Late Type Galaxy') along the wavelength direction to match the FSPS templates. ... The redshifts of SDSS spectra are measured with Redmonster (Hutchinson et al. 2016), a full spectral fitting tool that uses a galaxy template set based on FSPS (Conroy et al. 2009; Conroy & Gunn 2010) synthetic spectra."
The universal-template rest-frame zero-point is defined by construction as the FSPS zero-point: the SDSS templates are shifted along the wavelength direction to match the FSPS templates. The validation redshift zSDSScat is itself produced by Redmonster using FSPS-based galaxy templates, so the reported -2.8 +/- 17.3 km/s agreement between RVSNUpy universal-template redshifts and zSDSScat is primarily a self-consistency check between two FSPS-anchored pipelines. If FSPS spectra carry a velocity zero-point offset, the universal templates inherit it, and the claim that they are 'carefully calibrated to the rest frame' is not independently tested. The paper's separate offset-diagnosis (Figures 4, 5, and 9) does not depend on this FSPS anchor and remains self-contained.
full rationale
The core diagnostic argument of the paper is not circular. The authors show that the ~40 km/s SDSS-versus-Hectospec offset does not come from the observed spectra (Figure 4: cross-correlation between SDSS and Hectospec spectra gives -3.2 +/- 45.1 km/s), does not come from the measurement tool (Figure 5: RVSNUpy with FSPS templates reproduces zSDSScat to 6.8 km/s), and is instead controlled by template choice (Figure 9: using SDSS templates for both spectra removes the offset, while using Hectospec templates reproduces it). This elimination argument is self-contained against the observed spectra and the external SDSS catalog. The weaker element is the construction and validation of the universal templates in Section 6.3. The templates are calibrated by shifting SDSS templates to match FSPS synthetic spectra, and the reference catalog zSDSScat was itself measured with Redmonster using FSPS-based templates. Therefore the excellent agreement of the universal-template redshifts with zSDSScat is partly by construction: it verifies that RVSNUpy cross-correlation reproduces the FSPS/Redmonster zero-point, but it does not independently verify the absolute rest-frame zero-point of FSPS. This is a partial circularity in the absolute-calibration claim, but not in the main relative-offset diagnosis. The paper's self-citations (e.g., Kim et al. 2025 for the package, Sohn et al. 2021 for the offset) are normal and not load-bearing in a way that forces the conclusions.
Assumptions & free parameters
free parameters (3)
- Universal template velocity shifts =
about 10-20 km/s for SDSS templates relative to FSPS
- Quality thresholds r_thres and chi2_thres =
r>5, chi2eff<4
- B-spline knot span =
100 Å
assumptions (5)
- standard math Inverse-variance weighted cross-correlation formulation of Kelson et al. 2003
- standard math Gaussian line profiles imply Gaussian cross-correlation peaks (Tonry & Davis 1979)
- domain assumption FSPS synthetic SSP spectra define the true rest frame
- domain assumption Template velocity offsets measured by template cross-correlation propagate linearly into measured galaxy redshifts
- domain assumption A B-spline with 100 Å knot span removes the continuum without removing line information
Cite this review
Pith. "Pith review of RVSNUpy: A Python Package for Spectroscopic Redshift Measurement Based on Cross-Correlation." pith.science (2026). https://pith.science/paper/AAOPT5OG
@misc{pith2026250501710,
  author       = {Pith},
  title        = {Pith review of: RVSNUpy: A Python Package for Spectroscopic Redshift Measurement Based on Cross-Correlation},
  year         = {2026},
  howpublished = {\url{https://pith.science/paper/AAOPT5OG}},
  note         = {Machine review of arXiv:2505.01710}
}
read the original abstract
We introduce RVSNUpy, a new Python package designed to measure spectroscopic redshifts. Based on inverse-variance weighted cross-correlation, RVSNUpy determines the redshifts by comparing observed spectra with various rest-frame template spectra. We test the performance of RVSNUpy based on ~ 6000 objects in the HectoMAP redshift survey observed with both SDSS and MMT/Hectospec. We demonstrate that a slight redshift offset (~ 40 km/s) between SDSS and MMT/Hectospec measurements reported from previous studies results from the small offsets in the redshift template spectra used for SDSS and Hectospec reductions. We construct the universal set of template spectra, including empirical SDSS template spectra, carefully calibrated to the rest frame. Our test for the HectoMAP objects with duplicated observations shows that RVSNUpy with the universal template spectra yields the homogeneous redshift from the spectra obtained with different spectrographs. We highlight that RVSNUpy is a powerful redshift measurement tool for current and future large-scale spectroscopy surveys, including A-SPEC, DESI, 4MOST, and Subaru/PFS.
Figures


Figures from the paper (9 more)




Reference graph
Works this paper leans on
-
[1]
Abazajian, K. N., Adelman-McCarthy, J. K., Ag¨ ueros, M. A., et al. 2009, ApJS, 182, 543, doi: 10.1088/0067-0049/182/2/543
-
[2]
Adelman-McCarthy, J. K., Ag¨ ueros, M. A., Allam, S. S., et al. 2006, ApJS, 162, 38, doi: 10.1086/497917 —. 2008, ApJS, 175, 297, doi: 10.1086/524984
doi:10.1086/497917 2006
-
[3]
2020, ApJS, 249, 3, doi: 10.3847/1538-4365/ab929e
Ahumada, R., Allende Prieto, C., Almeida, A., et al. 2020, ApJS, 249, 3, doi: 10.3847/1538-4365/ab929e
-
[4]
F., Argudo-Fern´ andez, M., et al
Almeida, A., Anderson, S. F., Argudo-Fern´ andez, M., et al. 2023, ApJS, 267, 44, doi: 10.3847/1538-4365/acda98
-
[5]
Baldry, I. K., Driver, S. P., Loveday, J., et al. 2012, MNRAS, 421, 621, doi: 10.1111/j.1365-2966.2012.20340.x
arXiv 2012
-
[6]
Baldry, I. K., Alpaslan, M., Bauer, A. E., et al. 2014, MNRAS, 441, 2440, doi: 10.1093/mnras/stu727
-
[7]
Baldry, I. K., Liske, J., Brown, M. J. I., et al. 2018, MNRAS, 474, 3875, doi: 10.1093/mnras/stx3042
-
[8]
Deason, A. J. 2018, MNRAS, 478, 611, doi: 10.1093/mnras/sty982
Show all 46 references
-
[9]
L., Fattahi, A., et al
Belokurov, V., Sanders, J. L., Fattahi, A., et al. 2020, MNRAS, 494, 3880, doi: 10.1093/mnras/staa876
2020 doi
-
[10]
2011, MNRAS, 416, 3017, doi: 10.1111/j.1365-2966.2011.19250.x
Beutler, F., Blake, C., Colless, M., et al. 2011, MNRAS, 416, 3017, doi: 10.1111/j.1365-2966.2011.19250.x
2011
-
[11]
K., Bland-Hawthorn, J., et al
Blake, C., Baldry, I. K., Bland-Hawthorn, J., et al. 2013, MNRAS, 436, 3089, doi: 10.1093/mnras/stt1791
2013 doi
-
[12]
F., & Kereˇ s, D
Bonaca, A., Conroy, C., Wetzel, A., Hopkins, P. F., & Kereˇ s, D. 2017, The Astrophysical Journal, 845, 101, doi: 10.3847/1538-4357/aa7d0c
2017 doi
-
[13]
Ciddor, P. E. 1996, ApOpt, 35, 1566, doi: 10.1364/AO.35.001566
1996 doi
-
[14]
2001, MNRAS, 328, 1039, doi: 10.1046/j.1365-8711.2001.04902.x
Colless, M., Dalton, G., Maddox, S., et al. 2001, MNRAS, 328, 1039, doi: 10.1046/j.1365-8711.2001.04902.x
2001
-
[15]
Conroy, C., & Gunn, J. E. 2010, ApJ, 712, 833, doi: 10.1088/0004-637X/712/2/833
2010 doi
-
[16]
E., & White, M
Conroy, C., Gunn, J. E., & White, M. 2009, ApJ, 699, 486, doi: 10.1088/0004-637X/699/1/486
2009 doi
-
[17]
J., Geller, M
Damjanov, I., Zahid, H. J., Geller, M. J., Fabricant, D. G., & Hwang, H. S. 2018, ApJS, 234, 21, doi: 10.3847/1538-4365/aaa01c de Boor, C. 1978, A practical guide to splines (Springer) DESI Collaboration, Adame, A. G., Aguilar, J., et al. 2024a, AJ, 168, 58, doi: 10.3847/1538-...
-
[18]
1995, Curve and surface fitting with splines (Oxford University Press)
Dierckx, P. 1995, Curve and surface fitting with splines (Oxford University Press)
1995
-
[19]
J., Zehavi, I., Hogg, D
Eisenstein, D. J., Zehavi, I., Hogg, D. W., et al. 2005, ApJ, 633, 560, doi: 10.1086/466512 Euclid Collaboration, Scaramella, R., Amiaux, J., et al. 2022, A&A, 662, A112, doi: 10.1051/0004-6361/202141938
2005 doi
-
[20]
2005, PASP, 117, 1411, doi: 10.1086/497385
Fabricant, D., Fata, R., Roll, J., et al. 2005, PASP, 117, 1411, doi: 10.1086/497385
2005 doi
-
[21]
1953, Journal of the Optical Society of America (1917-1983), 43, 271 —
Fellgett, P. 1953, Journal of the Optical Society of America (1917-1983), 43, 271 —. 1955, Optica Acta, 2, 9, doi: 10.1080/713820996
1953 doi
-
[22]
J., Diaferio, A., & Kurtz, M
Geller, M. J., Diaferio, A., & Kurtz, M. J. 2011, AJ, 142, 133, doi: 10.1088/0004-6256/142/4/133
2011 doi
-
[23]
J., & Huchra, J
Geller, M. J., & Huchra, J. P. 1989, Science, 246, 897, doi: 10.1126/science.246.4932.897 22
1989 doi
-
[24]
J., & Hwang, H
Geller, M. J., & Hwang, H. S. 2015, Astronomische Nachrichten, 336, 428, doi: 10.1002/asna.201512182
2015 doi
-
[25]
J., Hwang, H
Geller, M. J., Hwang, H. S., Dell’Antonio, I. P., et al. 2016, ApJS, 224, 11, doi: 10.3847/0067-0049/224/1/11
2016 doi
-
[26]
J., Hwang, H
Geller, M. J., Hwang, H. S., Fabricant, D. G., et al. 2014, ApJS, 213, 35, doi: 10.1088/0067-0049/213/2/35
2014 doi
- [27]
-
[28]
Griffin, R. F. 1967, ApJ, 148, 465, doi: 10.1086/149168
1967 doi
-
[29]
1983, ApJS, 52, 89, doi: 10.1086/190860
Huchra, J., Davis, M., Latham, D., & Tonry, J. 1983, ApJS, 52, 89, doi: 10.1086/190860
1983 doi
-
[30]
L., Mayall, N
Humason, M. L., Mayall, N. U., & Sandage, A. R. 1956, AJ, 61, 97, doi: 10.1086/107297
1956 doi
-
[31]
A., Bolton, A
Hutchinson, T. A., Bolton, A. S., Dawson, K. S., et al. 2016, AJ, 152, 205, doi: 10.3847/0004-6256/152/6/205
2016 doi
-
[32]
S., Geller, M
Hwang, H. S., Geller, M. J., Park, C., et al. 2016, ApJ, 818, 173, doi: 10.3847/0004-637X/818/2/173
2016 doi
-
[33]
2025, RVSNUpy: A Python Package for Spectroscopic Redshift Measurement Based on Cross-Correlation, Zenodo, doi: 10.5281/zenodo.15200376
Kim, T., Jubee, S., & Ho Seong, H. 2025, RVSNUpy: A Python Package for Spectroscopic Redshift Measurement Based on Cross-Correlation, Zenodo, doi: 10.5281/zenodo.15200376
2025 doi
-
[34]
P., Oemler, A., J., & Schechter, P
Kirshner, R. P., Oemler, A., J., & Schechter, P. L. 1978, AJ, 83, 1549, doi: 10.1086/112363
1978 doi
-
[35]
2009, in American Institute of Physics Conference Series, Vol
Koesterke, L. 2009, in American Institute of Physics Conference Series, Vol. 1171, Recent Directions in Astrophysical Quantitative Spectroscopy and Radiation Hydrodynamics, ed. I. Hubeny, J. M. Stone, K. MacGregor, & K. Werner (AIP), 73–84, doi: 10.1063/1.3250090
2009 doi
- [36]
-
[37]
K., Driver, S
Liske, J., Baldry, I. K., Driver, S. P., et al. 2015, MNRAS, 452, 2087, doi: 10.1093/mnras/stv1436
2015 doi
-
[38]
T., Schiavon, R
Mackereth, J. T., Schiavon, R. P., Pfeffer, J., et al. 2019, MNRAS, 482, 3426, doi: 10.1093/mnras/sty2955
2019 doi
-
[39]
M., et al
Maraston, C., Pforr, J., Henriques, B. M., et al. 2013, MNRAS, 435, 2764, doi: 10.1093/mnras/stt1424 M´ esz´ aros, S., Allende Prieto, C., Edvardsson, B., et al. 2012, AJ, 144, 120, doi: 10.1088/0004-6256/144/4/120
2013 doi
- [40]
-
[41]
E., Barclay, T., Barnes, A., et al
Schlieder, J. E., Barclay, T., Barnes, A., et al. 2024, in Society of Photo-Optical Instrumentation Engineers (SPIE) Conference Series, Vol. 13092, Space Telescopes and Instrumentation 2024: Optical, Infrared, and Millimeter Wave, ed. L. E. Coyle, S. Matsuura, & M. D. Perrin, ...
2024 doi
-
[42]
Shannon, C. E. 1949, IEEE Proceedings, 37, 10, doi: 10.1109/JPROC.1998.659497
1949
-
[43]
Simkin, S. M. 1974, A&A, 31, 129
1974
-
[44]
J., Hwang, H
Sohn, J., Geller, M. J., Hwang, H. S., et al. 2021, ApJ, 909, 129, doi: 10.3847/1538-4357/abd9be —. 2023, ApJ, 945, 94, doi: 10.3847/1538-4357/acb925
2021 doi
-
[45]
1979, AJ, 84, 1511, doi: 10.1086/112569
Tonry, J., & Davis, M. 1979, AJ, 84, 1511, doi: 10.1086/112569
1979 doi
-
[46]
Tukey, J. W. 1968, in Spectral Analysis of Time Series, ed. B. Harris (New York: Wiley), 25–46
1968
Reviewed August 16, 2026 · model on record in the stance chip above.
Discussion (0). Continue with ORCID to comment.