REVIEW 4 major objections 5 minor 8 references
Platelet enumeration in dense aggregates
T0 review · 4 major / 5 minor · reviewed 2026-08-16 · deepseek-v4-flash
Pith's one-line read A U-Net variant with a dedicated platelet-aggregate class reaches a 0.969 platelet F1-score, and a local-peak counting method beats pixel-area counting while matching connected-component analysis.
desk verdict A credible segmentation result and a plausible counting idea, but the headline comparison between counting methods has a fixable confound that the authors need to address before this is publishable. read the letter →
The pith
A machine-rendered reading of the paper's core claim, the machinery that carries it, and where it could break.
The reading
What carries the argument
The load-bearing machinery is the U-Net-64S2+ configuration: a U-Net whose first convolutional layer outputs 64 channels and which repeats each down- and up-sampling block only once, trained with a separate class for platelet aggregates instead of lumping all platelets together. Counting is handled by the Peak Cluster Method: DBSCAN with epsilon 1 and minimum samples 1 locates aggregate clusters, a bounding box with a 5-pixel margin crops each cluster from the original intensity image, and local maxima above a fixed threshold of 0.9 are counted as individual platelets. The pixel area method, by contrast, divides the number of platelet pixels by an assumed average platelet size of 3 pixels.
What would settle it
Re-run the Peak Cluster Method on the same aggregate crops while sweeping the peak threshold from 0.85 to 0.95; if the estimated platelet count changes by more than one platelet per aggregate anywhere in that small range, then the reported standard error depends on an unjustified fixed threshold.
Extended reading notes
Core claim
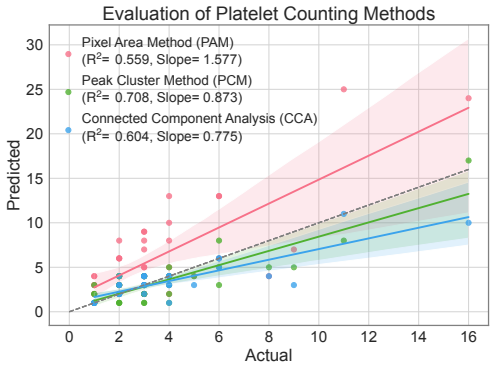
The central claim is that U-Net-64S2+, a U-Net with 64 first-layer output channels and only one convolution-batch-normalization-activation stage per down/up-sampling block, trained with separate classes for single platelets and platelet aggregates, reaches a platelet F1-score of 0.969±0.010. Coupled with that, the proposed Peak Cluster Method counts platelets within aggregates with a standard error of 0.2 and regression slope 0.873 (R2=0.708), which is better than the pixel area method (slope 1.577, R2=0.559) and comparable to connected component analysis (slope 0.775, R2=0.604). The paper positions this as a competitive alternative for dense-aggregate counting, where pixel-area estimates overcount and connected-component counting depends on platelets being well separated.
Load-bearing premise
Every platelet in an aggregate has its own distinct bright center that exceeds the fixed 0.9 intensity threshold in the cropped image, and this threshold is not derived from data or tested for sensitivity.
Editorial extensions
If this is right
- In dense aggregates, pixel-area counting systematically overestimates platelet counts, so clinical pipelines built on that method would need replacement.
- The large F1 jump from 87.4% to 96.9% when adding a platelet-aggregate class suggests class design should explicitly model aggregation state rather than relying on weighted loss functions alone.
- For aggregates larger than four platelets, the Peak Cluster Method's error (standard error 0.4) is lower than connected component analysis's error (standard error 0.9), making peak counting the preferred mask-based enumeration step.
- The one-stage down/up-sampling choice matters more for small objects than increasing network width from 16 to 128 channels.
- The same segmentation-plus-peak-counting recipe is expected to apply to other domains with small objects and their enumeration.
Reading between the lines
- The fixed 0.9 peak threshold is likely to be sensitive to illumination changes across microscopes; an adaptive threshold or a learned peakness estimator would be the natural next test.
- Manual counts used as ground truth have no inter-annotator reliability measure, so a multi-annotator re-labelling study would clarify how much of the reported standard error is annotation noise.
- The same segmentation-plus-peak-counting recipe should transfer to other dense small-object counting tasks, but each new domain would need its own threshold calibration.
Signed reviews
Editorial analysis
A structured set of objections, weighed in public.
Referee Report
Summary. The paper addresses platelet segmentation and counting in dense aggregates from lensless microscopy images. It proposes a U-Net variant (U-Net-64S2+) that uses 1-stage down-/up-sampling blocks and separate semantic classes for single platelets and platelet aggregates, reporting a platelet F1-score of 0.969 ± 0.010 under 10-fold cross-validation (Table I). For counting, the paper proposes the Peak Cluster Method (PCM), which locates platelet aggregates via DBSCAN and counts local intensity maxima above a fixed threshold of 0.9. PCM is compared with the pixel area method (PAM) and connected component analysis (CCA) on a small manually labeled sample, with reported overall standard error 0.2 and regression slope 0.873 (R² = 0.708), claimed to be comparable to CCA and better than PAM (Table II, Fig. 3). The central claims are that the architecture and class design improve segmentation, and that PCM is a viable counting alternative.
Significance. If the stated results hold after addressing the confounds described below, the work would provide a practically useful method for counting platelets in aggregates, and the segmentation comparison across kernel configurations is a useful addition to the small-object segmentation literature. Strengths include the use of real clinical-style microscopy data, 10-fold cross-validation for the segmentation metrics, and a clear side-by-side comparison of three counting strategies. The counting comparison, however, rests on a small manual ground-truth set and on a possibly non-parallel evaluation of CCA, so the central counting claim is not yet firmly established.
major comments (4)
- [Table II, §II.D, §III.C] The comparison between PCM and CCA is not demonstrated to be like-for-like. Table II footnote 2 states that the pixel area method and PCM were evaluated using the U-Net-64S2+ network, but it does not state the mask source for CCA. Section III.C illustrates CCA using Fig. 2(a), which is a U-Net-64S mask, a substantially weaker segmenter (platelet F1 = 0.874 versus 0.969 for U-Net-64S2+). If CCA counts were produced from U-Net-64S masks while PCM used U-Net-64S2+ masks, the reported parity between PCM and CCA could be entirely due to the input mask quality rather than the counting method. The authors must state explicitly which segmentation output was used for each counting method and rerun all three methods on the same masks.
- [§II.D, §III.C] The PCM threshold of 0.9 is fixed by hand with no sensitivity analysis. The platelet count is defined by peaks above this threshold, so the reported SE, CV, slope, and R² all depend directly on this value. It is not stated how the threshold was selected or whether it was tuned on the same manual ground-truth set used for evaluation. The authors should report sensitivity of the counting metrics to the threshold over a plausible range and, if the threshold was chosen on the evaluation data, provide an out-of-sample or cross-validated evaluation.
- [Table II, Fig. 3, §III.C] The counting evaluation is based on a small, single-annotator manual ground truth: per size group, Table II shows only 6–11 samples, with no inter-annotator reliability measure. The regression in Fig. 3 is forced through the origin, and no confidence intervals or per-point residuals are reported. Consequently, the claimed difference in slope between PCM (0.873) and CCA (0.775) may be within sampling noise. The authors should report the number of samples, the annotation protocol, inter-observer agreement if available, and fit statistics that do not assume a zero intercept, or justify the forced-zero regression.
- [Table I, §II.C, §III.A] The contribution of the proposed architecture is confounded by annotation quantity. U-Net-64S2+ is described as trained with 'additional labels for platelet aggregates' relative to U-Net-64S2, which already has a platelet aggregate class. The improvement in platelet F1 from 0.909 to 0.969 may therefore reflect additional training labels rather than the 1-stage block design or class design. The authors should clarify exactly what 'additional labels' means (more images, more annotated aggregate pixels, or an additional class) and, if it is more annotated data, separate the architecture effect from the data effect.
minor comments (5)
- [§II.A] The data description is difficult to parse: 'dimensions of12×RGB images of dimensions3×3K×4K' and 'input data with dimensions16×3K×4K' appear to contain typographical errors or missing multiplication signs; please rephrase for clarity.
- [Abstract and §II.D] The abstract uses 'pixel cluster method' while Section II.D introduces 'peak cluster method (PCM)'; please use a single consistent name.
- [Table II] The coefficient of variation (CV) is reported as dimensionless values such as 2.0, 2.7, and 3.3. Since CV is usually the standard deviation divided by the mean, the computation here (apparently based on absolute errors) should be defined explicitly in the text or table caption.
- [§II.D, §III.C] The average platelet area used for the pixel area method is stated as 3 pixels with no justification; given the small size of platelets in the images, this value materially affects PAM counts and should be justified or subject to sensitivity analysis.
- [Fig. 2] The caption says 'High-resolution images and corresponding segmentation masks' but the panels appear to show masks overlaid or segmented output; please state more precisely what each panel displays.
Circularity Check
No significant circularity: segmentation results are empirical, and the counting-method comparison, while methodologically imperfect, does not reduce to its inputs by construction.
full rationale
I found no circular step in the paper's derivation chain. The segmentation claim is an empirical 10-fold cross-validation result: U-Net-64S2+ reaches platelet F1=0.969±0.010 on a fixed training/validation split, independent of the counting methods. The proposed Peak Cluster Method (PCM) is defined procedurally from aggregate segmentation masks: DBSCAN identifies aggregate clusters, bounding boxes are extracted with a 5-pixel margin, and local maxima above a fixed threshold of 0.9 are counted. This definition does not use the manual ground-truth counts as an input, so the subsequent comparison against manual counts is a genuine evaluation rather than a renaming or a fitted-input prediction. The 0.9 threshold is an unvalidated hyperparameter and the paper reports no sensitivity analysis, but the manuscript never states that the threshold was tuned to the evaluation data, so calling it a fitted parameter would be speculation. Similarly, the connected-component-analysis comparison has a potential confound: Table II's footnote specifies U-Net-64S2+ for PAM and PCM but not for CCA, and Section III.C's CCA example uses a U-Net-64S mask. That is a methodological weakness that could affect the fairness of the comparison, but it is not a definitional or self-referential circularity. No load-bearing self-citation or imported uniqueness theorem appears; reference [3] is only for the imaging device. The central claims are therefore self-contained against external benchmarks rather than equivalent to their inputs by construction.
Assumptions & free parameters
free parameters (5)
- PCM intensity threshold =
0.9
- Average platelet area for PAM =
3 pixels
- DBSCAN epsilon =
1
- DBSCAN min_samples =
1
- Bounding-box margin =
5 pixels
assumptions (5)
- domain assumption Platelets have a bright focal point with higher pixel intensities than surrounding tissue
- domain assumption Manual inspection provides ground-truth platelet counts
- standard math U-Net semantic segmentation is an appropriate model for this task
- domain assumption DBSCAN clustering correctly isolates platelet aggregates in the segmentation mask
- domain assumption The 16-channel super-resolved input format captures the necessary information
Cite this review
Pith. "Pith review of Platelet enumeration in dense aggregates." pith.science (2026). https://pith.science/paper/6SMFPXNH
@misc{pith2026250502751,
  author       = {Pith},
  title        = {Pith review of: Platelet enumeration in dense aggregates},
  year         = {2026},
  howpublished = {\url{https://pith.science/paper/6SMFPXNH}},
  note         = {Machine review of arXiv:2505.02751}
}
read the original abstract
Identifying and counting blood components such as red blood cells, various types of white blood cells, and platelets is a critical task for healthcare practitioners. Deep learning approaches, particularly convolutional neural networks (CNNs) using supervised learning strategies, have shown considerable success for such tasks. However, CNN based architectures such as U-Net, often struggles to accurately identify platelets due to their sizes and high variability of features. To address these challenges, researchers have commonly employed strategies such as class weighted loss functions, which have demonstrated some success. However, this does not address the more significant challenge of platelet variability in size and tendency to form aggregates and associations with other blood components. In this study, we explored an alternative approach by investigating the role of convolutional kernels in mitigating these issues. We also assigned separate classes to singular platelets and platelet aggregates and performed semantic segmentation using various U-Net architectures for identifying platelets. We then evaluated and compared two common methods (pixel area method and connected component analysis) for counting platelets and proposed an alternative approach specialized for single platelets and platelet aggregates. Our experiments provided results that showed significant improvements in the identification of platelets, highlighting the importance of optimizing convolutional operations and class designations. We show that the common practice of pixel area-based counting often over estimate platelet counts, whereas the proposed method presented in this work offers significant improvements. We discuss in detail about these methods from segmentation masks.
Figures


Reference graph
Works this paper leans on
-
[1]
Automated complete blood cell count and malaria pathogen detection using convolution neural network,
A. B. Chowdhury, J. Roberson, A. Hukkoo, S. Bodapati, and D. J. Cappelleri, “Automated complete blood cell count and malaria pathogen detection using convolution neural network,”IEEE Robotics and Automa- tion Letters, vol. 5, no. 2, pp. 1047–1054, 2020
work page 2020
-
[2]
Histopathological image analysis: A review,
M. Gurcan, L. Boucheron, A. Can, A. Madabhushi, N. Rajpoot, and B. Yener, “Histopathological image analysis: A review,”IEEE Reviews in Biomedical Engineering, vol. 2, pp. 147–171, 2009
work page 2009
- [3]
-
[4]
Global status report on blood safety and availability 2021,
WHO, “Global status report on blood safety and availability 2021,” World Health Organization, Report, 2021
work page 2021
-
[5]
O. Ronneberger, P. Fischer, and T. Brox,U-Net: Convolutional Networks for Biomedical Image Segmentation. Springer International Publishing, 2015, pp. 234–241
work page 2015
-
[6]
Machine learning for contour classification in TG-263 noncompliant databases,
D. Livermore, T. Trappenberg, and A. Syme, “Machine learning for contour classification in TG-263 noncompliant databases,”Journal of Applied Clinical Medical Physics, vol. 23, no. 9, p. e13662, 2022
work page 2022
-
[7]
H. Singh and H. Kaur, “A systematic survey on biological cell image segmentation and cell counting techniques in microscopic images using machine learning,”Wireless Personal Communications, vol. 137, no. 2, pp. 813–851, 2024
work page 2024
-
[8]
A density-based algorithm for discovering clusters in large spatial databases with noise,
M. Ester, H.-P. Kriegel, J. Sander, and X. Xu, “A density-based algorithm for discovering clusters in large spatial databases with noise,” inProceed- ings of the Second International Conference on Knowledge Discovery and Data Mining, 1996, pp. 226–231
work page 1996
Reviewed August 16, 2026 · model on record in the stance chip above.
Discussion (0). Continue with ORCID to comment.