REVIEW 3 major objections 4 minor 36 references
Graph Drawing for LLMs: An Empirical Evaluation
T0 review · 3 major / 4 minor · reviewed 2026-08-15 · deepseek-v4-flash
Pith's one-line read The layout paradigm used to draw a graph measurably changes how accurately a multimodal LLM can answer graph questions from the image, with orthogonal drawings best for path-following tasks and human-readable redrawings boosting accuracy.
desk verdict Solid empirical start on layout-as-lever for LLM graph reasoning, but the headline R3 claim rests on an unquantified manual redrawing step, and the promised artifacts aren't public yet. read the letter →
The pith
A machine-rendered reading of the paper's core claim, the machinery that carries it, and where it could break.
The reading
What carries the argument
The carrying object is an experimental framework pairing three input modalities, textual adjacency list, visual drawing, and mixed, with four graph tasks (common neighbor, shortest path, maximum clique, minimum vertex cover), each scored by a hallucination-aware accuracy formula rather than by raw correctness. The visual modality splits into straight-line drawings from the FMMM force-directed algorithm and orthogonal drawings whose edges are chains of horizontal and vertical segments. The prompting techniques are standard, chain-of-thought, and the new SoAL, each with zero-shot and few-shot variants. In a third experiment, straight-line drawings are manually redrawn to improve symmetry and reduce crossings, producing an 'improved' visual modality. These components work together to isolate the effect of layout, prompt, and drawing quality on model accuracy.
What would settle it
Re-run Experiment 3 with automated layout optimization, measuring crossing number and symmetry before and after each change; if accuracy does not rise when the metrics improve, or if gains appear on drawings with unchanged metrics, the R3 claim is falsified.
Extended reading notes
Core claim
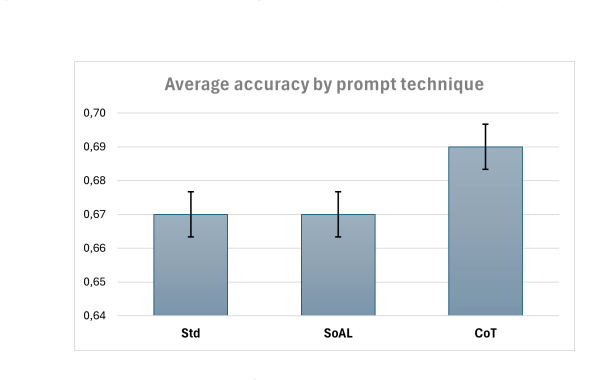
The central empirical claim is that layout paradigm changes an LLM's ability to answer graph queries from an image. The authors state this directly: orthogonal drawings appear superior on tasks where following local connections or paths matters, while straight-line drawings produced by force-directed algorithms support global tasks such as maximum clique or minimum vertex cover. A second load-bearing claim is that improving a drawing's readability by human metrics, namely symmetry and number of edge crossings, raises accuracy on shortest-path questions with both tested models. A third finding is that no prompting technique wins outright: chain-of-thought is generally accurate but costly, and the newly introduced Spell-out Adjacency List (SoAL) prompt, which asks the model to extract the adjacency list from the image before answering, is promising but model-dependent. The paper also introduces hallucination-aware accuracy metrics that weigh whether the nodes, edges, or paths the model names actually exist in the graph.
Load-bearing premise
The load-bearing premise behind the readability result is that the manually redrawn images in Experiment 3 are genuinely better on symmetry and crossing counts; no before-and-after metric values are reported, so the accuracy gain is not cleanly tied to those factors.
Editorial extensions
If this is right
- An AI assistant that receives a graph image should have the layout chosen by task: orthogonal layouts for path-tracing and local queries, straight-line layouts for global structural questions.
- Feeding the model an adjacency list alongside the image generally outperforms either modality alone, and visual-only input is the weakest of the three.
- Drawings optimized for human readability also read better to current LLMs, with no additional token cost, since the accuracy gain in Experiment 3 comes with equal latency.
- Prompt selection is task- and model-specific: chain-of-thought is a strong default, while SoAL matches it on some models, especially on complex tasks, and costs only slightly more tokens.
- Hallucination-aware scoring changes the ranking of answers by penalizing nonexistent edges, so future benchmarks on visual graph reasoning should report structural validity, not just numeric agreement.
Reading between the lines
- If human readability metrics transfer to machine readers, then graph layout algorithms could be tuned directly against an LLM's accuracy, turning the model into a proxy for readability experiments that currently require human subjects.
- The local-versus-global task split suggests a general design principle: the right visual encoding depends on the query type, and other encodings such as edge colors, shapes, bundled edges, and directed arrows could be mapped onto the same split.
- A testable extension would automate the manual redrawing in Experiment 3 by optimizing an explicit crossing and symmetry objective; if accuracy rises monotonically with the measured metric, the causal claim in R3 would be much stronger.
- The visual-only gap over text will likely shrink as vision encoders improve, but the layout effect may persist and could even grow on larger graphs where text input becomes impractical.
Signed reviews
Editorial analysis
A structured set of objections, weighed in public.
Referee Report
Summary. This paper reports an empirical study of two multimodal LLMs (GPT-4o and Claude-3.7-Sonnet) on graph reasoning tasks where the input is an image of a graph drawing. It compares text, visual, and mixed modalities; straight-line versus orthogonal layout paradigms; standard, chain-of-thought, few-shot, and a newly proposed 'Spell-out Adjacency List' (SoAL) prompting technique; and force-directed versus manually 'improved' drawings. The paper's central claims are that the layout paradigm affects LLM accuracy (R1), that prompting technique choice matters with no universally best option (R2), and that improving the human readability of a drawing improves LLM accuracy (R3). The main experimental results are reported through task-specific accuracy metrics designed to be robust to hallucinated edges or vertices.
Significance. The research questions are timely and directly relevant to both the graph drawing and the LLM evaluation communities. The design of hallucination-aware accuracy metrics is a genuine contribution, and the use of two frontier LLMs across a substantial matrix of conditions is a strength. If the claims about layout paradigm and drawing readability are established, the results would provide practical guidance for building visual graph assistants. However, at present the evidence is weakened by an internal inconsistency in the accuracy metric definitions, by the lack of quantified readability controls in the drawing 'improvement' experiment, and by the absence of statistical inference for the small observed differences. The paper also promises public data and code but the footnotes defer their release, which should be resolved.
major comments (3)
- [Section 3.3] The formulas for the hallucination-aware accuracy metrics are inconsistent with the prose definitions of σ. For ShPa, σ is defined as 'the fraction of existing edges in the path outputted by the model,' but the second factor is min{σ/Δ, Δ/σ}; for an output of correct length Δ with half of the edges existing (σ = 0.5), the formula gives min{0.5/Δ, 2Δ}, not 0.5 unless Δ = 1. For MaxC, the factor 2σ/(Δ(Δ−1)) equals 1 when σ = 1 only for Δ = 2, contradicting the claim that a correct clique yields αMaxC = 1. For MinVC, the formula uses (1 − σ/m), which is not 1 − σ if σ is a fraction. If σ is instead intended to be a count of existing edges or uncovered edges, then the prose definitions are wrong. Since every reported accuracy in Tables 1–9 is computed with these formulas, the definitions must be corrected and the tables checked against the intended metric. The examples given in the text only match the count interpretation, so this is a fixable but load-bearing inconsistency.
- [Section 3.3] The key finding for R3, that improving human readability metrics increases LLM accuracy, is not established by the data as reported. Section 3.3.1 states only that I-SlV drawings are obtained by 'manually adjusting' force-directed drawings 'based on human experience and well-accepted metrics such as symmetry and number of edge crossings.' No before-and-after values are reported for symmetry, edge crossings, angular resolution, label legibility, or any other readability metric for the 28 Bench-4 graphs. The observed aggregate improvement (I-SlV 0.58 vs SlV 0.52; I-SlM 0.85 vs SlM 0.82) could therefore be driven by incidental changes in scale, whitespace, label placement, or drawing-specific luck. This concern is amplified by Table 9, where some cells move in the opposite direction, e.g., GPT-4o I-SlM Std-Zero is 0.82 vs 0.84 for SlM. Section 4.2 itself defers a 'more systematic study of what readability metrics have a greater impact,' acknowledging that no metric was isolated. Without a quantified readability comparison or a controlled manipulation of individual metrics, the causal claim in R3 is untestable from the current data.
- [Section 3.1.2] The R1 claim that orthogonal drawings are superior for local/path tasks is based on small aggregate differences without confidence intervals or significance tests. The averaged differences are minute (OrM 0.88 vs SlM 0.87; OrV 0.69 vs SlV 0.67), and several cells in the underlying tables contradict the aggregate direction; for example, GPT-4o on CoNe with Std-Zero gives OrV 0.54 versus SlV 0.60, and Claude-3.7-Sonnet on CoNe with Std-Few gives OrV 0.35 versus SlV 0.35 as a tie. The paper says the pattern is 'confirmed' and 'consistent,' but with 20 graphs per benchmark, no error bars, and no per-condition statistical testing, small differences cannot be distinguished from noise. The authors should report per-graph variability, confidence intervals, or an appropriate statistical test, and should temper the strength of the R1 conclusion accordingly.
minor comments (4)
- [Throughout] The text states that 'All experimental data (including benchmarks, drawings, code, and full prompts) are publicly available,' but footnotes 1 and 6 say 'To be provided after publication or under request.' These statements are contradictory and should be reconciled before publication.
- [Section 3.1.1] There are several typos in the modality definitions: 'Straght-line Visual' and 'Orhtogonal' should be 'Straight-line' and 'Orthogonal', and in Section 3.1.1 the phrase 'This benchmark hae been used' should read 'has been used.'
- [References] Reference [9] contains the stray text 'Cited by: 19,' which appears to be an artifact of a citation manager and should be removed.
- [Section 3.2.2] In the discussion of Experiment 2, the phrase 'follow by SoAL' should be 'followed by SoAL' for grammatical correctness.
Circularity Check
No circularity: the paper's claims are empirical measurements comparing layout paradigms, prompts, and manually redrawn images; no claim reduces to its own inputs by construction.
full rationale
This is an experimental measurement paper, not a derivation. R1 and R2 are supported by direct comparisons of accuracy across fixed modalities and prompting techniques; the metrics (e.g., Jaccard for CoNe, path-fraction for ShPa) are defined independently of the conclusions. R3 is the only candidate for circularity: Section 3.3.1 defines I-SlV drawings as force-directed drawings 'manually adjusting' them 'based on human experience and well-accepted metrics such as symmetry and number of edge crossings'. The paper does not report before/after values of those metrics, so the causal attribution in Section 3.3.2 ('improving the readability of a graph drawing based on human readability metrics increases the LLM's ability') is under-supported as a causal claim. However, that is a measurement/control limitation, not circularity: the treatment variable (manual redrawing) is not defined in terms of the outcome (LLM accuracy), and no fitted parameter is renamed as a prediction. The paper explicitly flags the need for 'a more systematic study of what readability metrics have a greater impact' (Section 4.2), acknowledging the missing isolation. Self-citations such as [8] are background citations for layout paradigms and are not load-bearing for any conclusion. The deferred public repository for code/data is a reproducibility limitation, not circularity. Overall, no step reduces to its inputs by construction.
Assumptions & free parameters
assumptions (4)
- domain assumption The two API models tested are stable, representative multimodal LLMs.
- domain assumption A single force-directed algorithm and a single orthogonal layout implementation represent their respective layout paradigms.
- ad hoc to paper The manually redrawn drawings in Experiment 3 are better on the intended readability metrics.
- domain assumption Benchmarks of 20 and 28 graphs with 6 to 50 vertices are representative enough for the stated conclusions.
Cite this review
Pith. "Pith review of Graph Drawing for LLMs: An Empirical Evaluation." pith.science (2026). https://pith.science/paper/KRGLPL2Z
@misc{pith2026250503678,
  author       = {Pith},
  title        = {Pith review of: Graph Drawing for LLMs: An Empirical Evaluation},
  year         = {2026},
  howpublished = {\url{https://pith.science/paper/KRGLPL2Z}},
  note         = {Machine review of arXiv:2505.03678}
}
read the original abstract
Our work contributes to the fast-growing literature on the use of Large Language Models (LLMs) to perform graph-related tasks. In particular, we focus on usage scenarios that rely on the visual modality, feeding the model with a drawing of the graph under analysis. We investigate how the model's performance is affected by the chosen layout paradigm, the aesthetics of the drawing, and the prompting technique used for the queries. We formulate three corresponding research questions and present the results of a thorough experimental analysis. Our findings reveal that choosing the right layout paradigm and optimizing the readability of the input drawing from a human perspective can significantly improve the performance of the model on the given task. Moreover, selecting the most effective prompting technique is a challenging yet crucial task for achieving optimal performance.
Figures


Figures from the paper (9 more)




Reference graph
Works this paper leans on
-
[1]
G. D. Battista, W. Didimo, M. Patrignani, and M. Pizzonia. Drawing database schemas. Softw. Pract. Exp. , 32(11):1065–1098, 2002. 20 GPT-4o Accuracy α ShPa Total Tokens Std CoT Std CoT Modality Zero Few Zero Few Zero Few Zero Few Visual SlV 0.45 0.41 0.53 0.54 983 2574 1422 3208 I-SlV 0.49 0.54 0.54 0.59 983 2574 1392 3214 Mixed SlM 0.84 0.82 0.95 0.90 12...
work page 2002
-
[2]
G. D. Battista, P. Eades, R. Tamassia, and I. G. Tollis. Graph Drawing: Algorithms for the Visualization of Graphs . Prentice-Hall, 1999
work page 1999
- [3]
-
[4]
Z. Chai, T. Zhang, L. Wu, K. Han, X. Hu, X. Huang, and Y. Yang. GraphLLM: Boosting graph reasoning ability of large language model. CoRR, abs/2310.05845, 2023
arXiv 2023
-
[5]
M. Chimani, C. Gutwenger, M. J¨ unger, G. W. Klau, K. Klein, and P. Mutzel. The open graph drawing framework (OGDF). In R. Tamassia, editor, Handbook on Graph Drawing and Visualization , pages 543–569. Chapman and Hall/CRC, 2013
work page 2013
-
[6]
K. Coolsaet, S. D’hondt, and J. Goedgebeur. House of graphs 2.0: A database of interesting graphs and more. Discret. Appl. Math. , 325:97–107, 2023. Available at https://houseofgraphs.org
work page 2023
-
[7]
D. Das, I. Gupta, J. Srivastava, and D. Kang. Which modality should I use - text, motif, or image? : Understanding graphs with large language models. In K. Duh, H. G´ omez-Adorno, and S. Bethard, editors, Findings of the Association for Computational Linguistics: NAACL 2024, pages 503–519. Association for Computational Linguistics, 2024. 21
work page 2024
- [8]
Show all 36 references
-
[9]
Didimo and G
W. Didimo and G. Liotta. Graph Visualization and Data Mining . 2006. Cited by: 19
2006
-
[10]
Q. Dong, L. Li, D. Dai, C. Zheng, J. Ma, R. Li, H. Xia, J. Xu, Z. Wu, B. Chang, X. Sun, and Z. Sui. A survey on in-context learning. In Y. Al-Onaizan, M. Bansal, and Y. Chen, editors, Proceedings of the 2024 Conference on Empirical Methods in Natural Language Processing, EMNLP...
2024
-
[11]
C. A. Duncan and M. T. Goodrich. Planar orthogonal and polyline drawing algorithms. In R. Tamassia, editor, Handbook on Graph Drawing and Visualization , pages 223–246. Chapman and Hall/CRC, 2013
2013
-
[12]
Eiglsperger, C
M. Eiglsperger, C. Gutwenger, M. Kaufmann, J. Kupke, M. J¨ unger, S. Leipert, K. Klein, P. Mutzel, and M. Siebenhaller. Automatic layout of UML class diagrams in orthogonal style. Inf. Vis. , 3(3):189–208, 2004
2004
-
[13]
Fatemi, J
B. Fatemi, J. Halcrow, and B. Perozzi. Talk like a graph: Encoding graphs for large language models. In The Twelfth International Conference on Learning Representations, ICLR 2024 . OpenReview.net, 2024
2024
-
[14]
Ghoniem, J
M. Ghoniem, J. Fekete, and P. Castagliola. A comparison of the readability of graphs using node-link and matrix-based representations. In M. O. Ward and T. Munzner, editors, 10th IEEE Symposium on Information Visualization (InfoVis 2004) , pages 17–24. IEEE Computer Society, 2004
2004
-
[15]
J. Guo, L. Du, and H. Liu. GPT4Graph: Can large language models understand graph structured data? An empirical evaluation and benchmarking. CoRR, abs/2305.15066, 2023
2023 arXiv
-
[16]
Hachul and M
S. Hachul and M. J¨ unger. Drawing large graphs with a potential-field-based multilevel algorithm. In J. Pach, editor, Graph Drawing, 12th International Symposium, GD 2004 , volume 3383 of LNCS, pages 285–295. Springer, 2004
2004
-
[17]
Hachul and M
S. Hachul and M. J¨ unger. Large-graph layout algorithms at work: An experimental study. J. Graph Algorithms Appl. , 11(2):345–369, 2007
2007
-
[18]
Huang, W
L. Huang, W. Yu, W. Ma, W. Zhong, Z. Feng, H. Wang, Q. Chen, W. Peng, X. Feng, B. Qin, and T. Liu. A survey on hallucination in large language models: Principles, taxonomy, challenges, and open questions. ACM Trans. Inf. Syst. , 43(2), Jan. 2025
2025
-
[19]
Hurst, A
A. Hurst, A. Lerer, A. P. Goucher, A. Perelman, A. Ramesh, A. Clark, A. Ostrow, A. Weli- hinda, A. Hayes, A. Radford, A. Madry, A. Baker-Whitcomb, A. Beutel, A. Borzunov, A. Carney, A. Chow, A. Kirillov, A. Nichol, A. Paino, A. Renzin, A. T. Passos, A. Kir- illov, A. Christaki...
-
[20]
B. Jin, G. Liu, C. Han, M. Jiang, H. Ji, and J. Han. Large language models on graphs: A comprehensive survey. IEEE Trans. Knowl. Data Eng. , 36(12):8622–8642, 2024
2024
-
[21]
Kaufmann and D
M. Kaufmann and D. Wagner, editors. Drawing Graphs, Methods and Models (the book grow out of a Dagstuhl Seminar, April 1999) , volume 2025 of Lecture Notes in Computer Science . Springer, 2001
1999
-
[22]
Z. Luo, X. Song, H. Huang, J. Lian, C. Zhang, J. Jiang, X. Xie, and H. Jin. GraphInstruct: Empowering large language models with graph understanding and reasoning capability. CoRR, abs/2403.04483, 2024
2024
-
[23]
M. Okoe, R. Jianu, and S. G. Kobourov. Node-link or adjacency matrices: Old question, new insights. IEEE Trans. Vis. Comput. Graph. , 25(10):2940–2952, 2019
2019
-
[24]
H. C. Purchase, J. Allder, and D. A. Carrington. Graph layout aesthetics in UML diagrams: User preferences. J. Graph Algorithms Appl. , 6(3):255–279, 2002
2002
-
[25]
H. C. Purchase, R. F. Cohen, and M. I. James. An experimental study of the basis for graph drawing algorithms. ACM J. Exp. Algorithmics , 2:4, 1997
1997
-
[26]
X. Ren, J. Tang, D. Yin, N. V. Chawla, and C. Huang. A survey of large language models for graphs. In R. Baeza-Yates and F. Bonchi, editors, KDD 2024 , pages 6616–6626. ACM, 2024
2024
-
[27]
Sahoo, A
P. Sahoo, A. K. Singh, S. Saha, V. Jain, S. Mondal, and A. Chadha. A systematic sur- vey of prompt engineering in large language models: Techniques and applications. CoRR, abs/2402.07927, 2024
2024 arXiv
-
[28]
J. Tang, Y. Yang, W. Wei, L. Shi, L. Su, S. Cheng, D. Yin, and C. Huang. GraphGPT: Graph instruction tuning for large language models. In G. H. Yang, H. Wang, S. Han, C. Hauff, G. Zuccon, and Y. Zhang, editors, Proceedings of the 47th International ACM SIGIR Conference on Rese...
2024
-
[29]
J. Tang, Q. Zhang, Y. Li, and J. Li. Grapharena: Benchmarking large language models on graph computational problems. CoRR, abs/2407.00379, 2024
2024 arXiv
-
[30]
L. G. Valiant. Universality considerations in VLSI circuits. IEEE Trans. Computers , 30(2):135–140, 1981
1981
-
[31]
Wallinger, D
M. Wallinger, D. Archambault, D. Auber, M. N¨ ollenburg, and J. Peltonen. Edge-path bundling: A less ambiguous edge bundling approach. IEEE Trans. Vis. Comput. Graph. , 28(1):313–323, 2022
2022
-
[32]
J. Wei, X. Wang, D. Schuurmans, M. Bosma, B. Ichter, F. Xia, E. H. Chi, Q. V. Le, and D. Zhou. Chain-of-thought prompting elicits reasoning in large language models. In S. Koyejo, S. Mohamed, A. Agarwal, D. Belgrave, K. Cho, and A. Oh, editors, Advances in Neural Information P...
2022
-
[33]
Y. Wei, S. Fu, W. Jiang, Z. Zhang, Z. Zeng, Q. Wu, J. T. Kwok, and Y. Zhang. GITA: graph to visual and textual integration for vision-language graph reasoning. In A. Globersons, L. Mackey, D. Belgrave, A. Fan, U. Paquet, J. M. Tomczak, and C. Zhang, editors,NeurIPS 2024, 2024
2024
-
[34]
White, S
C. White, S. Dooley, M. Roberts, A. Pal, B. Feuer, S. Jain, R. Shwartz-Ziv, N. Jain, K. Sai- fullah, S. Dey, Shubh-Agrawal, S. S. Sandha, S. V. Naidu, C. Hegde, Y. LeCun, T. Goldstein, W. Neiswanger, and M. Goldblum. Livebench: A challenging, contamination-limited LLM benchmar...
2025
-
[35]
F. Xia, K. Sun, S. Yu, A. Aziz, L. Wan, S. Pan, and H. Liu. Graph learning: A survey. IEEE Trans. Artif. Intell. , 2(2):109–127, 2021
2021
-
[36]
W. X. Zhao, K. Zhou, J. Li, T. Tang, X. Wang, Y. Hou, Y. Min, B. Zhang, J. Zhang, Z. Dong, Y. Du, C. Yang, Y. Chen, Z. Chen, J. Jiang, R. Ren, Y. Li, X. Tang, Z. Liu, P. Liu, J.-Y. Nie, and J.-R. Wen. A survey of large language models. arXiv preprint arXiv:2303.18223 , 2023. 24
2023 arXiv
Reviewed August 15, 2026 · model on record in the stance chip above.
Discussion (0). Continue with ORCID to comment.