REVIEW 4 major objections 6 minor 2 cited by
Geospatial and Temporal Trends in Urban Transportation: A Study of NYC Taxis and Pathao Food Deliveries
T0 review · 4 major / 6 minor · reviewed 2026-08-16 · deepseek-v4-flash
Pith's one-line read A weekly-season SARIMAX model fit to one month of NYC taxi pickups is claimed to forecast daily demand well enough to guide fleet scheduling.
desk verdict A modest EDA case study whose forecast claim outruns its data; the descriptive parts are fine, the SARIMAX evidence is not. read the letter →
The pith
A machine-rendered reading of the paper's core claim, the machinery that carries it, and where it could break.
The reading
What carries the argument
The central object is the SARIMAX model—seasonal autoregressive integrated moving average with exogenous variables—configured with order (1,0,1) and seasonal order (1,0,1,7). The seasonal period of 7 is the mechanism that encodes the weekly cycle in daily pickup counts, and the paper's case rests on that term's ability to reduce forecast error to the reported RMSE values. Supporting machinery includes K-means clustering with 15 clusters on pickup and dropoff coordinates, which identifies geographic high- and low-demand zones, and feature engineering that extracts hour, day, day of week, and trip duration from datetime fields.
What would settle it
Fit the same SARIMAX(1,0,1)(1,0,1,7) model to several months of NYC taxi data with a holdout of at least four weeks, and compare its out-of-sample RMSE with a plain ARIMA(1,0,1) that has no seasonal term; if the seasonal model is not better, or if significant autocorrelation remains at lag 7, the weekly-seasonality claim would not survive.
Extended reading notes
Core claim
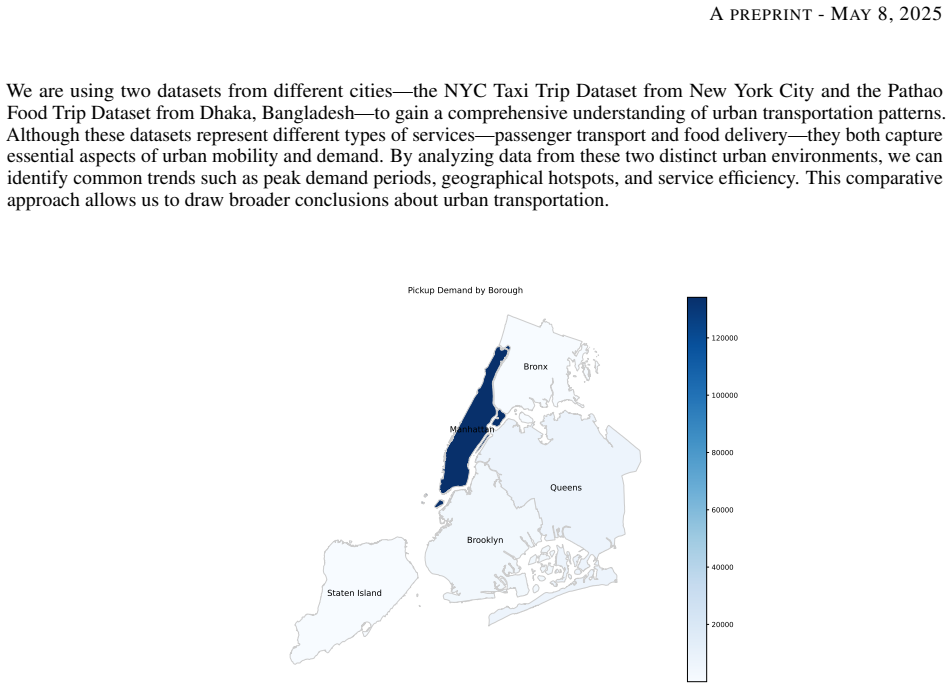
Stated on the paper's own terms, the central discovery is that daily New York City taxi demand in January 2013 carries a weekly seasonal structure that a SARIMAX(1,0,1)(1,0,1,7) model captures: the fitted model yields an in-sample RMSE of 734.944 and an out-of-sample RMSE of 204.1525 on a short test window. The authors take these numbers as evidence that the model 'effectively captured the weekly seasonality' and that it can help operators forecast demand patterns for optimized fleet management and efficient driver scheduling. The companion descriptive findings are that Manhattan dominates pickup volume, Staten Island has the least activity, Queens shows the longest average trip distance and duration, trips lengthen later in the day and on weekends, and Pathao food delivery demand peaks on Friday and Saturday.
Load-bearing premise
The central claim depends on the assumption that one month of daily trip counts—January 2013—contains enough repeated weekly cycles to estimate and test a weekly seasonal model, with a test period of only about six days.
Editorial extensions
If this is right
- Taxi operators who adopt the model can shift drivers toward late-day and weekend hours where pickups and trip lengths rise, and concentrate vehicles in Manhattan while reducing idle capacity in Staten Island.
- Retraining the same SARIMAX configuration on longer NYC taxi histories should produce rolling daily demand forecasts suitable for dispatch planning, if the weekly pattern holds across months.
- Food delivery operators in Dhaka can act on the weekday/weekend demand split by scheduling more riders and preparing popular items on Fridays and Saturdays, even though the Pathao dataset lacks timestamps and coordinates for a full time-series model.
- Positioning idle taxis near the high-demand clusters identified by K-means should cut wait times, provided those clusters remain stable over the weeks the model covers.
Reading between the lines
- A testable extension the paper does not report is a head-to-head comparison with a non-seasonal ARIMA on the same holdout, which would isolate the seasonal term's marginal contribution.
- Aggregating the Pathao records by day of week and hour would test whether the Friday-Saturday ordering peak persists after accounting for how many restaurants are open.
- Repeating the fit on other months of 2013 would show whether the weekly seasonal order and the Manhattan/Queens/Staten Island rankings are stable, which the one-month design does not establish.
Signed reviews
Editorial analysis
A structured set of objections, weighed in public.
Referee Report
Summary. The paper analyzes two urban transportation datasets: NYC Taxi Trip data from January 2013 and Pathao Food Delivery data from Dhaka. It performs exploratory data analysis, borough-level geospatial summaries, K-means clustering of pickup/dropoff coordinates, and a SARIMAX time-series forecast for taxi demand. The descriptive findings are that Manhattan has the highest taxi pickup volume, Staten Island the lowest, taxi trips tend to be longer later in the day and on weekends, and Pathao orders peak on Fridays and Saturdays. The paper also claims that the SARIMAX model effectively captured weekly seasonality with an RMSE of 734.944 and that this can support fleet management and driver scheduling.
Significance. If the forecasting claim were supported, the work would be practically relevant for taxi and food-delivery operators. The descriptive parts are straightforward and generally consistent with the displayed figures, and the authors are honest in Section 7 that the single-month NYC sample limits generalizability. The strengths are the use of real-world data, the clear exploratory summaries, and the explicit acknowledgment of scope limitations. However, the time-series evidence is underpowered: a period-7 seasonal model is fitted to roughly 31 daily observations with a test window shorter than one seasonal cycle, and the headline RMSE is the in-sample value. With additional baselines, proper out-of-sample evaluation, and more cautious claims, this could become a useful applied case study, but the central forecasting claim is not currently established.
major comments (4)
- [§3.1.1, §3.3, §5.3] The central forecasting claim is not supported by the reported experimental setup. The NYC data are restricted to January 2013, about 31 daily observations, and the 80:20 train-test split leaves roughly 6 test points, fewer than one full weekly cycle. A SARIMAX model with seasonal order (1,0,1,7) cannot be validated on a test window shorter than the seasonal period, and estimating seasonal AR and MA terms from roughly 25 training points is statistically fragile. The authors should either use a longer series, validate with multiple seasonal cycles, or explicitly present the single-month result as a methodological illustration rather than as evidence that weekly seasonality has been captured.
- [§5.3] The RMSE reporting does not justify the conclusion drawn. The quoted RMSE of 734.944 is the in-sample value; the out-of-sample value of 204.1525 is reported but not interpreted, and no baseline model, forecast horizon, or confidence interval is provided. In-sample RMSE cannot serve as evidence of forecast skill, and the out-of-sample value needs context such as a seasonal-naive baseline or a non-seasonal ARIMA comparison. Section 5.3 should be rewritten so that the conclusion is drawn only from out-of-sample performance with suitable baselines.
- [§4.4, §5.4] The clustering analysis does not support the claim that K-means identifies high- and low-demand regions. The number of clusters K=15 is chosen without a selection criterion or stability check, and the clustering input is raw latitude and longitude coordinates, not demand counts. The resulting figure likely shows geographic groupings rather than demand hotspots. To support the claim, the authors should combine cluster assignments with trip counts and justify the choice of K or test its robustness.
- [§3.1.2, §5, Abstract] The comparative framing overstates what is actually analyzed. Section 3.1.2 states that the Pathao dataset has no geospatial coordinates and no datetime attribute, so geospatial analysis and time-series forecasting are performed only for the NYC taxi data. The Pathao contribution is limited to exploratory analysis of day-of-week and hour-of-day patterns. The introduction and abstract should be reframed to make this asymmetry explicit, rather than implying that both datasets support the full geospatial and temporal pipeline.
minor comments (6)
- [Title] The title contains an apparent typo: 'A S TUDY' should be 'A STUDY'.
- [§3.3] Section 3.3 says an 80:20 train-test split was performed on both datasets, but no model is evaluated on the Pathao data; clarify that the split applies only to the time-series analysis of the NYC taxi data.
- [§4.3 and Figure 7] The text says the data are de-seasonalized, while Figure 7 is labeled 'De-Trended Time Series'; make the terminology consistent.
- [§5.1] The phrase 'late hours (15th and 23rd hour)' is ambiguous; it should specify 15:00 and 23:00, and the claims about hourly peaks should be tied directly to the corresponding figures.
- [References] Reference [9] appears in the reference list but is not cited in the body of the paper, and several references lack complete venue or pagination details; the bibliography needs cleanup.
- [General] The paper does not include a data availability or reproducibility statement, and no code is provided; adding these would strengthen the contribution.
Circularity Check
No circularity: the SARIMAX forecast uses a train/test split and the weekly-seasonality claim is an empirical modeling choice, not a result forced by construction.
full rationale
The paper's central claims are descriptive data summaries and a SARIMAX forecast. The model order and seasonal order are selected from fitting diagnostics and the weekly periodicity is stated as a property of the data window, not derived from the target conclusion. The in-sample RMSE of 734.944 and out-of-sample RMSE of 204.1525 are reported as evaluation metrics after fitting, and the out-of-sample forecast uses a train/test split, so the prediction is not equivalent to the fitted input by construction. No equations define one result in terms of the claimed prediction, no fitted parameter is renamed as a forecast, and no self-citation is used as load-bearing evidence. The single-month data window and the short out-of-sample horizon raise legitimate statistical concerns about robustness, but those are validity issues, not circularity. Therefore the analysis is self-contained with no significant circular steps.
Assumptions & free parameters
free parameters (3)
- SARIMAX order (p,d,q) =
(1,0,1)
- SARIMAX seasonal order (P,D,Q,s) =
(1,0,1,7)
- Number of K-means clusters K =
15
assumptions (4)
- domain assumption One month (January 2013) of NYC taxi data is sufficient to estimate and validate weekly seasonal demand patterns
- domain assumption The Pathao Food Trip dataset is an acceptable substitute for a Bangladeshi taxi dataset
- ad hoc to paper K-means with K=15 on raw latitude/longitude coordinates yields meaningful high/low demand regions
- domain assumption SARIMAX residual assumptions (stationarity, no autocorrelation) hold after the detrending shown in Figure 7
Cite this review
Pith. "Pith review of Geospatial and Temporal Trends in Urban Transportation: A Study of NYC Taxis and Pathao Food Deliveries." pith.science (2026). https://pith.science/paper/R7LBHOE6
@misc{pith2026250503816,
  author       = {Pith},
  title        = {Pith review of: Geospatial and Temporal Trends in Urban Transportation: A Study of NYC Taxis and Pathao Food Deliveries},
  year         = {2026},
  howpublished = {\url{https://pith.science/paper/R7LBHOE6}},
  note         = {Machine review of arXiv:2505.03816}
}
read the original abstract
Urban transportation plays a vital role in modern city life, affecting how efficiently people and goods move around. This study analyzes transportation patterns using two datasets: the NYC Taxi Trip dataset from New York City and the Pathao Food Trip dataset from Dhaka, Bangladesh. Our goal is to identify key trends in demand, peak times, and important geographical hotspots. We start with Exploratory Data Analysis (EDA) to understand the basic characteristics of the datasets. Next, we perform geospatial analysis to map out high-demand and low-demand regions. We use the SARIMAX model for time series analysis to forecast demand patterns, capturing seasonal and weekly variations. Lastly, we apply clustering techniques to identify significant areas of high and low demand. Our findings provide valuable insights for optimizing fleet management and resource allocation in both passenger transport and food delivery services. These insights can help improve service efficiency, better meet customer needs, and enhance urban transportation systems in diverse urban environments.
Figures


Figures from the paper (4 more)


Forward citations
Cited by 2 Pith papers
-
PatiGonit22K: A Comprehensive Dataset for Solving Complex Bengali MWPs
PatiGonit22K is a new 22,441-problem Bengali math word problem dataset that adds 17,029 multi-operation complex problems to the existing PatiGonit benchmark.
-
GSM-Plus-BN: A Perturbation-Based Benchmark for Bangla Mathematical Reasoning in Large Language Models
The paper releases GSM-Plus-BN, a human-verified Bengali translation of the GSM-Plus perturbed math benchmark, and reports accuracy baselines for six open LLMs under standard and CoT prompting.
Reference graph
Works this paper leans on
-
[1]
Analysis & Prediction of New York City Taxi and Uber Demands
Correa, Diego, and Christian Moyano. "Analysis & Prediction of New York City Taxi and Uber Demands." Journal of Applied Research and Technology 21.5 (2023): 886-898
work page 2023
-
[2]
Temporal geospatial analysis of secondary school students’ examination performance
Abd Kadir, ND Nik, and N. A. Adnan. "Temporal geospatial analysis of secondary school students’ examination performance." IOP Conference Series: Earth and Environmental Science. V ol. 37. No. 1. IOP Publishing, 2016
work page 2016
-
[3]
Xie, Chen, et al. "Revealing spatiotemporal travel demand and community structure characteristics with taxi trip data: A case study of New York City." PLoS one 16.11 (2021): e0259694
work page 2021
-
[4]
Data Exploratory on Taxi Data in New York City
Archie, Christie Natashia, and Shubashini Rathina Velu. "Data Exploratory on Taxi Data in New York City." 2023 International Conference on Integrated Intelligence and Communication Systems (ICIICS). IEEE, 2023
work page 2023
-
[5]
ARIMA model for accurate time series stocks forecasting
Khan, Shakir, and Hela Alghulaiakh. "ARIMA model for accurate time series stocks forecasting." International Journal of Advanced Computer Science and Applications 11.7 (2020)
work page 2020
-
[6]
Time Series Forecasting using LSTM and ARIMA
Albeladi, Khulood, Bassam Zafar, and Ahmed Mueen. "Time Series Forecasting using LSTM and ARIMA." International Journal of Advanced Computer Science and Applications 14.1 (2023): 313-320
work page 2023
-
[7]
Profit prediction using ARIMA, SARIMA and LSTM models in time series forecasting: A comparison
Sirisha, Uppala Meena, Manjula C. Belavagi, and Girija Attigeri. "Profit prediction using ARIMA, SARIMA and LSTM models in time series forecasting: A comparison." IEEE Access 10 (2022): 124715-124727
2022
-
[8]
Forecasting Surabaya–Jakarta Train Passengers with SARIMA model
Astuti, S. W. "Forecasting Surabaya–Jakarta Train Passengers with SARIMA model." IOP Conference Series: Materials Science and Engineering. V ol. 407. No. 1. IOP Publishing, 2018
work page 2018
Show all 15 references
-
[9]
Optimization of Data Mining for Business Intelligence Using Cobweb Clustering Algorithm-A Case Study of Nigeria Network Service Providers’ Data Plan
Nnamani, Kelvin Ndubuisi, Oliver Okechukwu, and Chiamaka Chidimma Agu. "Optimization of Data Mining for Business Intelligence Using Cobweb Clustering Algorithm-A Case Study of Nigeria Network Service Providers’ Data Plan."
-
[10]
Unsupervised K-means clustering algorithm
Sinaga, Kristina P., and Miin-Shen Yang. "Unsupervised K-means clustering algorithm." IEEE access 8 (2020): 80716-80727. 10 A PREPRINT - M AY 8, 2025
2020
-
[11]
Geospatial analysis of the dynamics of climate in Kolkata metropolitan area
Talapatra, Adrita, Arijit Majumder, and Sandipan Das. "Geospatial analysis of the dynamics of climate in Kolkata metropolitan area." Journal of Physics: Conference Series. V ol. 1964. No. 4. IOP Publishing, 2021
1964
-
[12]
Revealing travel patterns and city structure with taxi trip data
Liu, Xi, et al. "Revealing travel patterns and city structure with taxi trip data." Journal of transport Geography 43 (2015): 78-90
2015
-
[13]
New York City taxi trip duration prediction using MLP and XGBoost
Poongodi, M., et al. "New York City taxi trip duration prediction using MLP and XGBoost." International Journal of System Assurance Engineering and Management (2022): 1-12
2022
-
[14]
The service operation of Foodpanda Bangladesh
Boron, Sami Islam. "The service operation of Foodpanda Bangladesh." (2022)
2022
-
[15]
Assessing the usability of ridesharing mobile applications in Bangladesh: an empirical study
Rahman, Md Mokhlesur, et al. "Assessing the usability of ridesharing mobile applications in Bangladesh: an empirical study." 2020 61st International Scientific Conference on Information Technology and Management Science of Riga Technical University (ITMS). IEEE, 2020. 11
2020
Reviewed August 16, 2026 · model on record in the stance chip above.
Discussion (0). Continue with ORCID to comment.