REVIEW 4 major objections 5 minor 31 references
Aliasing Reduction in Neural Amp Modeling by Smoothing Activations
T0 review · 4 major / 5 minor · reviewed 2026-08-15 · deepseek-v4-flash
Pith's one-line read Smoother, horizontally stretched tanh activations reduce aliasing in neural amplifier models while keeping modeling error modest.
desk verdict Solid empirical sweep showing smooth activations reduce aliasing in neural amp models; the ASR metric is promising but unvalidated, and missing test details make the 27% headline provisional. read the letter →
The pith
A machine-rendered reading of the paper's core claim, the machinery that carries it, and where it could break.
The reading
What carries the argument
The load-bearing piece is the newly defined Aliasing-to-Signal Ratio (ASR), computed on the output of a single-tone sine test. The trick is to choose the DFT length $N$ and the fundamental bin $k_0$ coprime (here $N=48{,}017$, a prime, and $f_0=1249$ Hz), so that the set $\{n\cdot k_0 \bmod N\}$ fills every bin exactly once before any bin receives a second component; harmonic energy $E_H$ is read off the known harmonic bins and total spectral energy $E_Y$ from all bins, and $\mathrm{ASR}=(E_Y-E_H)/E_H$ estimates the aliasing fraction. Because no windowing or zero padding is used, each bin samples a single frequency, making the energy subtraction exact for a periodic steady-state response. The second object is the stretched tanh, $\mathrm{CustomTanh}(x)=\tanh(x/\alpha)$, whose larger $\alpha$ flattens the nonlinearity and is shown to lower ASR monotonically while ESR passes through a minimum near $\alpha=0.8$.
What would settle it
Run a listening test comparing CustomTanh $\alpha=1$ and $\alpha=1.8$ on real guitar input; if listeners cannot reliably tell which model is less aliased, or if the ASR ranking reverses when the sine test is repeated at different input amplitudes, the paper's central claim fails.
Extended reading notes
Core claim
The paper's central claim is that smoother activation functions consistently produce less aliasing in TCN-based neural amp models, and that this gain can be purchased with only a modest rise in waveform-matching error. In the paper's own measurements, non-gated CustomTanh with stretch factor $\alpha=1.8$ reaches aliasing components below $-60$ dB, an ASR of $0.001582$ versus $0.002173$ for $\alpha=1$, a 27 percent reduction, at ESR $0.016628$ versus $0.013467$. The authors also find a systematic trade-off: gated activations such as SELU achieve the lowest ESR ($0.010591$) but introduce roughly 6–9 times more aliasing than the best anti-aliasing configurations. The conclusion is that activation-function choice is a viable anti-aliasing lever that requires neither architectural change nor additional computation.
Load-bearing premise
The whole ranking of activations hangs on the assumption that ASR computed from one 1249 Hz sine tone, whose input level is not reported, captures the aliasing artifacts that listeners actually hear in musical signals; the paper itself notes that listening tests are still needed.
Editorial extensions
If this is right
- Swapping the standard tanh for CustomTanh with $\alpha=1.8$ reduces aliasing components below $-60$ dB and cuts ASR by roughly 27 percent at the cost of a small ESR rise, with no change to architecture or compute.
- Among 124 configurations, the ten lowest-ASR models are all ungated, while gated variants dominate the lowest-ESR list, so the ASR-ESR trade-off is systematic rather than specific to one function.
- Increasing the stretch factor $\alpha$ reduces ASR continuously in the tanh family, giving practitioners a dial between aliasing and waveform error; the paper also suggests the possibility of adapting $\alpha$ in real time based on input pitch.
- The same smoothing logic highlights Hardtanh as a near-Pareto option and motivates exploring spline-smoothed, rounded-corner variants, which the paper proposes as future work.
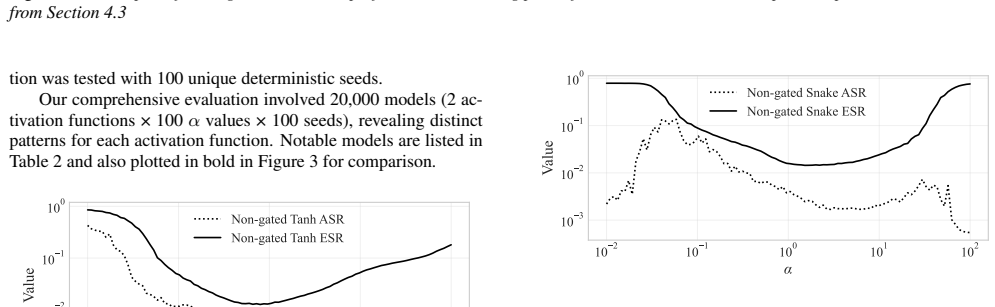
- For the Snake family, ASR and ESR both have local minima near $\alpha=2.9$, so Snake offers a balanced operating point distinct from the stretched-tanh family.
Reading between the lines
- A natural extension the paper does not run: repeat the ASR measurement across input amplitudes and fundamental frequencies; the trade-off curve could flatten or invert, which would decide whether adaptive-$\alpha$ control should be level-aware.
- The paper's gating results suggest an untested lever: because gated variants alias 6–9 times more than ungated ones, the sigmoid gate path itself is a likely aliasing source, and smoothing or removing that nonlinearity could combine low ESR with low ASR.
- ASR is an unweighted spectral-energy ratio; before it is used to tune production models, a perceptually weighted or music-signal version would need validation against the listening tests the paper calls for.
Signed reviews
Editorial analysis
A structured set of objections, weighed in public.
Referee Report
Summary. The paper investigates whether smoother activation functions reduce aliasing artifacts in neural amplifier models built as temporal convolutional networks (TCNs). The authors introduce a new metric, the Aliasing-to-Signal Ratio (ASR), defined as the ratio of non-harmonic spectral energy to harmonic energy in the response to a periodic sine test. They train 12,400 models across 124 activation configurations (62 functions, gated and non-gated, with 100 seeds) and then 20,000 additional models to sweep the stretch/oscillation parameter for CustomTanh and Snake. They report that smoother activations, especially CustomTanh with larger stretch factors, reduce ASR while keeping the Error-to-Signal Ratio (ESR) modest, with a highlighted 27 percent ASR reduction for CustomTanh_1.8 relative to the baseline, accompanied by a modest ESR increase. The paper also includes spectrum and waveform analyses for three CustomTanh variants.
Significance. If the ASR metric is valid and the reported effect is robust, the paper provides a practically useful, architecture-free way to reduce aliasing in a widely used neural amp modeling framework: simply choose a smoother activation function. The experimental scale is a genuine strength: 100 deterministic seeds per configuration, 12,400 plus 20,000 trained models, and alpha-sweep experiments give the main trend empirical support rather than making it an artifact of a single run. The ASR definition is mathematically clean under the stated periodicity and coprimality assumptions, and no parameters are fitted to force the smoothness conclusion. However, the significance of the central quantitative claims currently rests on an unvalidated metric and a sine-test protocol whose key details are unreported; these issues must be addressed for the paper's headline numbers to be credible.
major comments (4)
- [Section 3.2 and Section 4.4] The ASR definition EA = EY - EH counts every DFT bin not at a low-order harmonic as aliasing, which is exact only for the periodic steady-state response to a single sine. The paper states in Section 3.2 that this requires 'any transient response is discarded,' but Section 4.4 reports no input amplitude, no transient-discard length, and no initial-state handling. The 18-layer TCN has a receptive field of 2045 samples (kernel 3 with the dilation pattern in Section 2.4), so a one-second test window that includes the onset will leak energy across all bins and misclassify that leakage as aliasing. Because the same ASR ranks all configurations, this missing detail directly affects the reported ranking and the 27 percent figure; the setup must be specified or the claim limited.
- [Section 3.2 and abstract] The abstract states that ASR 'quantitatively assesses the level of aliasing with high accuracy,' but no validation of the metric is provided. There is no comparison with a synthetic signal whose aliasing content is known exactly, no comparison with an established perceptual or objective aliasing measure, and no listening test (deferred in Section 5). Since the paper's central conclusion is an ASR-based ranking of 124 activation configurations, this is a load-bearing gap. A concrete validation, such as adding known aliasing components to a clean periodic signal and checking whether ASR tracks the added energy monotonically, or correlating ASR with listening-test ratings, would support the claim.
- [Section 4.4 and Table 2] The headline 27 percent reduction (ASR 0.001582 for False_CustomTanh_1.8 versus 0.002173 for False_CustomTanh_1) is measured with a single sine at 1249 Hz and no reported amplitude. Nonlinear aliasing depends strongly on drive level and input frequency; a single point does not establish that the improvement holds across the operating range of a guitar amplifier model. The authors should report an amplitude sweep and at least several fundamental frequencies, or explicitly restrict the claim to the tested condition.
- [Section 4.2.3] The exclusion of ReLUSquared and ReLUSquaredDip from the minimum-ASR analysis because they 'failed to train effectively (ESR about 1)' is a post-hoc criterion that is not stated in the methodology and is applied only to the minimum-ASR half of Table 1. The text acknowledges this, but the minimum-ASR ranking then depends on an unprincipled filter. Either state a rule (e.g., exclude all configurations with average ESR above a threshold) before presenting the table, or report the unfiltered results so readers can see the effect.
minor comments (5)
- [Sections 2.2 and 2.4] Training hyperparameters (optimizer, learning rate, batch size, and the epoch count at early stopping) are not stated; 'replicated from [15]' is insufficient for reproducibility of a study whose quantitative claims rest on 100-seed averages.
- [Section 4.4] The statement that aliasing 'remains below -60 dB' for alpha = 1.8 is based on visual inspection of the right column of Figure 6; the authors should define the quantitative criterion, such as the maximum magnitude of non-harmonic bins below 6 kHz.
- [Figures 3-5] In the submitted PDF, the figure labels and legend text contain garbled font-encoding sequences (e.g., '/uni00000014...'), making the plots unreadable; the final version must render these characters properly.
- [Section 4.1.1] The gated versus non-gated comparison confounds the choice of activation function with the additional sigmoid nonlinearity in the gate; the conclusion that 'gating introduces aliasing' should be qualified as applying to the gated architecture as a whole rather than to the activation alone.
- [Section 4.3] The 'balanced' points (alpha = 1.8 for Tanh, alpha = 2.9 for Snake) are chosen informally; the authors should state the selection rule, such as the lowest ASR subject to an ESR ceiling, to make the choices reproducible.
Circularity Check
No circularity found: the ASR metric is defined from the output spectrum alone, alpha values are enumerated rather than fitted to ASR, and the central smoothness-aliasing claim does not reduce to its inputs.
full rationale
Walking the paper's derivation chain—ASR definition (Sec. 3.2), model training on ESR (Sec. 2.2), alpha enumeration (Secs. 4.1–4.3), and the waveform/spectrum analysis (Sec. 4.4)—I find no step that reduces to its own inputs by construction. ASR is defined purely from the DFT of the model output: EA = EY − EH, so every bin not at a low-order harmonic of the 1249 Hz test tone counts as aliasing energy. This definition contains no reference to activation-function smoothness, stretch factor, gating, or the ESR training objective, so the smoother-means-less-aliasing conclusion is not built into the metric. The alpha sweep is genuinely empirical: alpha values are enumerated (log-spaced 10^-2 to 10^2), 100 seeds per configuration, and no parameter is fitted to ASR; the headline 27% figure is a ratio of two measured averages (0.002173/0.001582) from Table 2, not a fitted prediction. The metric even surfaces an unanticipated result—non-smooth, piecewise-linear False_Hardtanh sits near the Pareto frontier with ASR 0.002246 and ESR 0.012443—which is evidence that ASR does not tautologically reward smoothness. Self-citations by the second author (refs [1], [4]) are background survey and wave-digital-filter material and are not load-bearing for the central claim. The paper's own limitation, that listening tests are needed to perceptually validate the results (Sec. 5), plus the unreported sine-test amplitude and transient-discard details, is a validation and reproducibility gap in ASR, not a circularity: an unvalidated or even biased metric can be wrong without the argument being circular. No fitted-parameter-renamed-as-prediction, no definitional equivalence, and no self-citation chain exist here, so the appropriate finding is no significant circularity.
Assumptions & free parameters
free parameters (4)
- CustomTanh stretch factor alpha (balanced point) =
1.8
- Snake oscillation frequency alpha (balanced point) =
2.9
- Sine-test fundamental frequency f0 =
1249 Hz (k0=1249 at fs=48017)
- Sine-test input amplitude =
not reported
assumptions (5)
- domain assumption The trained network output to a periodic sine is periodic after discarding the transient, so the DFT bin energies are discrete Fourier series samples.
- domain assumption Aliasing originating from harmonics above the Nth harmonic (~60 MHz) is negligible.
- domain assumption The training setup of [15] and the single NAM sample are representative enough to support general conclusions about activation function choice.
- standard math For prime DFT length N and coprime k0, the set {n k0 mod N} for n=0..N-1 covers every residue exactly once.
- domain assumption ESR, taken from [13], is a valid measure of modeling accuracy for the purpose of characterizing the aliasing/accuracy trade-off.
invented entities (1)
-
Aliasing-to-Signal Ratio (ASR)
Cite this review
Pith. "Pith review of Aliasing Reduction in Neural Amp Modeling by Smoothing Activations." pith.science (2026). https://pith.science/paper/GMNVI6VT
@misc{pith2026250504082,
  author       = {Pith},
  title        = {Pith review of: Aliasing Reduction in Neural Amp Modeling by Smoothing Activations},
  year         = {2026},
  howpublished = {\url{https://pith.science/paper/GMNVI6VT}},
  note         = {Machine review of arXiv:2505.04082}
}
read the original abstract
The increasing demand for high-quality digital emulations of analog audio hardware, such as vintage tube guitar amplifiers, led to numerous works on neural network-based black-box modeling, with deep learning architectures like WaveNet showing promising results. However, a key limitation in all of these models was the aliasing artifacts stemming from nonlinear activation functions in neural networks. In this paper, we investigated novel and modified activation functions aimed at mitigating aliasing within neural amplifier models. Supporting this, we introduced a novel metric, the Aliasing-to-Signal Ratio (ASR), which quantitatively assesses the level of aliasing with high accuracy. Measuring also the conventional Error-to-Signal Ratio (ESR), we conducted studies on a range of preexisting and modern activation functions with varying stretch factors. Our findings confirmed that activation functions with smoother curves tend to achieve lower ASR values, indicating a noticeable reduction in aliasing. Notably, this improvement in aliasing reduction was achievable without a substantial increase in ESR, demonstrating the potential for high modeling accuracy with reduced aliasing in neural amp models.
Figures


Figures from the paper (2 more)

Reference graph
Works this paper leans on
-
[1]
INTRODUCTION Over the past few decades, virtual analog modeling of audio cir- cuits has become a very active area of research [1], particularly in guitar amplifiers and effects. Digital clones of analog ampli- fiers and effects pedals enable affordable mass production lead- ing to revolutionary products like solid-state combo amplifiers and multi-effects ...
work page 2025
-
[2]
Aliasing Reduction in Neural Amp Modeling by Smoothing Activations
SETUP For our setup, we replicated the training environment present in [15]. For more detailed explanation of the setup, refer to that paper. 2.1. Model Architecture The model we utilized for training is the variant of WaveNet [12] typically used in the neural amp modeling community [13]. Orig- inal WaveNet was an autoregressive stack of dilated causal co...
work page Pith review arXiv 2025
-
[3]
EV ALUATION METHOD To evaluate the performances of our model, we utilized two met- rics: Error-to-Signal Ratio (ESR) as proposed in [13] and our new Aliasing-to-Signal Ratio (ASR). 3.1. Error-to-Signal Ratio (ESR) The Error-to-Signal Ratio for evaluation is given by: EESR = N −1X n=0 |y[n]− ˆy[n]|2 N −1X n=0 |y[n]|2 = Perror Psignal where Perror is the po...
work page 2025
-
[4]
EXPERIMENTS For running the experiments, we utilized an NVIDIA A100 GPU to speed up the training process. Each model took approximately 1-2 minutes to train, and was efficiently parallelized by training multiple models with multiple GPUs at once. 4.1. Activation Functions For our alias reduction experiments, we decided to test our mod- els with various ac...
work page 2025
-
[5]
CONCLUSIONS This work investigates the relationship between smooth activation functions and aliasing in neural amp modeling, introducing the Aliasing-to-Signal Ratio (ASR) to quantify aliasing artifacts. We found that smoother, ungated activation functions consis- tently produce less aliasing, with the non-gated CustomTanh fam- ily emerging as a particula...
work page 2025
-
[6]
ACKNOWLEDGMENT Thanks to the ReazonSpeech team from Reazon Holdings for pro- viding computational resources!
-
[7]
A review on digital guitar tube amplifier modeling techniques,
J. Pakarinen and D. T. Yeh, “A review on digital guitar tube amplifier modeling techniques,” Com- puter Music Journal , vol. 33, pp. 85–100, 2009, http://www.mitpressjournals.org/doi/pdf/10.1162/comj.2009.33.2.85
-
[8]
Deep learning for black-box modeling of audio effects,
M. A. Martínez Ramírez, E. Benetos, and J. D. Reiss, “Deep learning for black-box modeling of audio effects,” Applied Sciences, vol. 10, no. 2, pp. 638, 2020
work page 2020
Show all 31 references
-
[9]
Välimäki, S
V . Välimäki, S. Bilbao, J. O. Smith, J. S. Abel, J. Pakarinen, and D. Berners, DAFx: Digital Audio Effects , chapter 12: Virtual Analog Effects, pp. 473–522, John Wiley & Sons, Ltd, 2011
2011
-
[10]
Multi effects pedals market report | global fore- cast from 2025 to 2033,
DataIntelo, “Multi effects pedals market report | global fore- cast from 2025 to 2033,” 2024
2025
-
[11]
Wave digital simulation of a vacuum-tube amplifier,
M. Karjalainen and J. Pakarinen, “Wave digital simulation of a vacuum-tube amplifier,” in 2006 IEEE International Con- ference on Acoustics Speech and Signal Processing Proceed- ings, 2006, vol. 5, pp. V–V
2006
-
[12]
The Fender Bassman 5F6-A family of preamplifier circuits—a wave digital filter case study,
W. R. Dunkel, M. Rest, K. J. Werner, M. J. Olsen, and J. O. Smith III, “The Fender Bassman 5F6-A family of preamplifier circuits—a wave digital filter case study,” in DAFx-16, Sept. 2016
2016
-
[13]
Wave digital mod- eling of circuits with multiple one-port nonlinearities based on Lipschitz-bounded neural networks,
O. Massi, E. Manino, and A. Bernardini, “Wave digital mod- eling of circuits with multiple one-port nonlinearities based on Lipschitz-bounded neural networks,” in DAFx-24, Sept. 2024
2024
-
[14]
Discrete-time models for non-linear audio systems,
J. Schattschneider and U. Zölzer, “Discrete-time models for non-linear audio systems,” in DAFx-99, Dec. 1999
1999
-
[15]
Table 2: Comparison of Best Performing Models with Baselines
was published (which used an Apple iMac with a 2.8GHz Intel Core i5 processor), it is now more affordable to increase the model order (channel dimension, convolution kernel length, and or number of convolution layers, etc.) for better ESR performance. Table 2: Comparison of Be...
-
[16]
Real-time modeling of audio distortion circuits with deep learning,
E.-P. Damskägg, L. Juvela, and V . Välimäki, “Real-time modeling of audio distortion circuits with deep learning,” in DAFx-19, Sept. 2019
2019
-
[17]
Unsupervised estimation of nonlinear au- dio effects: Comparing diffusion-based and adversarial ap- proaches,
E. Moliner, M. Švento, A. Wright, L. Juvela, P. Rajmic, and V . Välimäki, “Unsupervised estimation of nonlinear au- dio effects: Comparing diffusion-based and adversarial ap- proaches,” 2025, arXiv:2504.04751 [eess.AS]
2025
-
[18]
A vacuum-tube guitar am- plifier model using a recurrent neural network,
J. Covert and D. L. Livingston, “A vacuum-tube guitar am- plifier model using a recurrent neural network,” in2013 Pro- ceedings of IEEE Southeastcon , 2013, pp. 1–5
2013
-
[19]
A vacuum-tube guitar amplifier model using long/short-term memory networks,
Z. Zhang, E. Olbrych, J. Bruchalski, T. J. McCormick, and D. L. Livingston, “A vacuum-tube guitar amplifier model using long/short-term memory networks,” in SoutheastCon 2018, 2018, pp. 1–5
2018
-
[20]
WaveNet: A generative model for raw audio,
A. van den Oord, S. Dieleman, H. Zen, K. Simonyan, O. Vinyals, A. Graves, N. Kalchbrenner, A. Senior, and K. Kavukcuoglu, “WaveNet: A generative model for raw audio,” 2016, arXiv:1609.03499 [cs.SD]
2016 arXiv
-
[21]
Deep learning for tube amplifier emulation,
E.-P. Damskägg, L. Juvela, E. Thuillier, and V . Välimäki, “Deep learning for tube amplifier emulation,” 2018, arXiv:1811.00334 [eess.AS]
2018 arXiv
-
[22]
Real-time black-box modelling with recurrent neural networks,
A. Wright, E.-P. Damskägg, and V . Välimäki, “Real-time black-box modelling with recurrent neural networks,” in DAFx-19, Sept. 2019
2019
-
[23]
Real-time guitar amplifier emulation with deep learning,
A. Wright, E.-P. Damskägg, L. Juvela, and V . Välimäki, “Real-time guitar amplifier emulation with deep learning,” Applied Sciences, vol. 10, no. 3, 2020
2020
-
[25]
Conditional image gen- eration with pixelcnn decoders,
A. van den Oord, N. Kalchbrenner, O. Vinyals, L. Espeholt, A. Graves, and K. Kavukcuoglu, “Conditional image gen- eration with pixelcnn decoders,” 2016, arXiv:1606.05328 [cs.CV]
2016 arXiv
-
[26]
A wavenet for speech denoising,
D. Rethage, J. Pons, and X. Serra, “A wavenet for speech denoising,” 2018, arXiv:1706.07162 [cs.SD]
2018 arXiv
-
[27]
High-fidelity audio compression with improved RVQ- GAN,
R. Kumar, P. Seetharaman, A. Luebs, I. Kumar, and K. Ku- mar, “High-fidelity audio compression with improved RVQ- GAN,” 2023, arXiv:2306.06546 [cs.SD]
2023 arXiv
-
[28]
ReLU 2 wins: Discover- ing efficient activation functions for sparse LLMs,
Z. Zhang, Y . Song, G. Yu, X. Han, Y . Lin, C. Xiao, C. Song, Z. Liu, Z. Mi, and M. Sun, “ReLU 2 wins: Discover- ing efficient activation functions for sparse LLMs,” 2024, arXiv:2402.03804 [cs.LG]
2024 arXiv
-
[29]
Searching for activation functions,
P. Ramachandran, B. Zoph, and Q. V . Le, “Searching for activation functions,” 2017, arXiv:1710.05941 [cs.NE]
2017 arXiv
-
[30]
Real-time modeling of audio distortion circuits with deep learning,
E.-P. Damskägg, L. Juvela, and V . Välimäki, “Real-time modeling of audio distortion circuits with deep learning,” in SMC 2019, May 2019, pp. 332–339
2019
-
[31]
On kernel design for regu- larized volterra series identification of Wiener–Hammerstein systems,
Y . Xu, B. Mu, and T. Chen, “On kernel design for regu- larized volterra series identification of Wiener–Hammerstein systems,” preprint, May 2025, arXiv:2505.20747 [eess.SY]. DAFx.8
2025 arXiv
-
[128]
Given the significant advances in computing power since
as demonstrated in [15], trading more processing speed for quality. Given the significant advances in computing power since
Reviewed August 15, 2026 · model on record in the stance chip above.
Discussion (0). Continue with ORCID to comment.