REVIEW 4 major objections 5 minor 53 references
CAST: Time-Varying Treatment Effects with Application to Chemotherapy and Radiotherapy on Head and Neck Squamous Cell Carcinoma
T0 review · 4 major / 5 minor · reviewed 2026-08-15 · deepseek-v4-flash
Pith's one-line read Chemotherapy produces a non-monotonic, time-varying survival benefit in head and neck cancer, peaking 50-65 months after treatment.
desk verdict Plausible pattern but overclaimed: CAST's peak-and-decline trajectory is not statistically established, yet the application is worth a serious referee. read the letter →
The pith
A machine-rendered reading of the paper's core claim, the machinery that carries it, and where it could break.
The reading
What carries the argument
The central object is the time-varying conditional average treatment effect, $\tau(x,t)=\mathbb{E}[Y(1,t)-Y(0,t)\mid X=x]$, the expected difference in survival outcome at time $t$ under chemotherapy versus no chemotherapy for a patient with covariates $x$. CAST estimates this at horizons of 12 to 120 months using causal survival forests with Nelson-Aalen estimation and doubly robust propensity adjustment, then combines an inverse-variance-weighted quadratic fit, which yields interpretable peak time and half-life parameters, with a cross-validated smoothing spline, which detects inflection points. Propensity score trimming enforces overlap, and dummy-outcome and synthetic-confounder tests are used to check that the trajectory does not arise from noise.
What would settle it
Use a randomized or fully confounder-measured cohort and re-estimate the same trajectory after adding performance status, comorbidity, diet, and genetic risk to the propensity model. If the 3-year and 5-year survival gains shrink toward zero or the peak moves outside the 50-65 month window, the claim that CAST's trajectory reflects the true causal effect is falsified.
Extended reading notes
Core claim
The central claim is that chemotherapy in HNSCC produces a time-dependent causal survival benefit that is largest in the early-to-mid years after treatment, peaks near 50-65 months, and then gradually declines, and that this trajectory is a property of the data-generating process rather than an artifact of curve fitting. CAST estimates the conditional average treatment effect as a function of time, $\tau(x,t)$, by training causal survival forests separately at ten horizons and then fitting inverse-variance weighted curves through those estimates. The paper reports that both the quadratic and spline versions agree on the timing of the peak, and that the same non-monotonic shape appears in survival probability and restricted mean survival time differences. It further claims that individual-level effect distributions show a long right tail of high responders and a smaller subset with near-zero or negative benefit, with HPV status and smoking pack-years as the main drivers of heterogeneity.
Load-bearing premise
The load-bearing premise is that, after conditioning on measured covariates, who receives chemotherapy is independent of potential survival outcomes; if unmeasured factors such as performance status, diet, lifestyle, or genetic risk influence both treatment and survival, the estimated benefit trajectory is not identified.
Editorial extensions
If this is right
- Clinicians can time surveillance and adjunct therapy around the 50-65 month window where chemotherapy's survival benefit is largest.
- Fixed-horizon analyses of the same data would give horizon-dependent answers; CAST's continuous trajectory explains why choosing 3-year versus 5-year endpoints changes the apparent benefit.
- The peak-and-decline shape supports adaptive treatment strategies: after roughly five years, additional chemotherapy is unlikely to add survival benefit and may only add toxicity.
- If the framework transfers, any censored survival dataset with a binary treatment can be re-analyzed to produce effect trajectories instead of isolated time-point estimates.
Reading between the lines
- If the trajectory is real, then clinical trials and meta-analyses that report only a single fixed-horizon effect may misstate chemotherapy's value; re-analyzing existing trial data with horizon-specific survival curves would give a direct test of the peak timing.
- The observed dependence of the peak on tumor repopulation and late toxicity could be tested by applying CAST to datasets with different radiotherapy fractionation schedules: the peak time should shift with biologically effective dose if the mechanism is causal.
- Because the framework assumes no unmeasured confounding, the heterogeneity findings should be treated as hypothesis-generating; an external cohort with performance status and comorbidity would separate true response heterogeneity from selection-driven noise.
Signed reviews
Editorial analysis
A structured set of objections, weighed in public.
Referee Report
Summary. The paper introduces CAST, a framework for estimating time-varying treatment effects in survival data by fitting a quadratic curve or a smoothing spline to horizon-specific causal survival forest estimates of the survival-probability (SP) and restricted-mean-survival-time (RMST) treatment effects. The method is applied to the RADCURE observational cohort of 2,651 head-and-neck squamous cell carcinoma patients to estimate the effect of chemotherapy on survival over 12 to 120 months. The central reported finding is that chemotherapy benefit is non-monotonic, rising to a peak between 50 and 65 months and then declining. The authors also present refutation tests, SHAP-based heterogeneity analyses, propensity-score trimming, and a theoretical appendix claiming consistency and identifiability of the estimators. Source code and data are provided.
Significance. If the trajectory claim were properly established, the paper would make a useful contribution by emphasizing that summary effect measures at single horizons can conceal meaningful temporal dynamics, and by providing a practical workflow for smoothing horizon-specific causal survival forest estimates. The open-source code, the explicit validation suite (dummy-outcome, synthetic-confounder, and negative-control tests), and the application to a real clinical cohort are strengths that make the framework reproducible and testable. However, the manuscript currently does not supply the inferential machinery needed to support the headline rise, peak, decline shape and the 50-65 month peak timing: the analysis is descriptive rather than confirmatory, and the uncertainty of the smoothed trajectory is understated by the independence assumption in the weighting scheme.
major comments (4)
- [Section 5, Table 2, Figure 2] The headline non-monotonicity is not tested against the uncertainty in the horizon-specific estimates. The apparent peak at 48 months (SP ATE 0.178 with SE 0.072) is not statistically distinguishable from the later-horizon estimates such as 120 months (0.100 with SE 0.063; raw difference 0.078, approximate SE 0.096, not significant at the 5% level). The paper reports no test of non-monotonicity, no confidence interval for t_peak, and no simultaneous confidence band for tau(t). The dummy-outcome refutations validate each horizon-level estimator under the null, but they do not validate the continuous shape. Please add a joint inferential procedure (for example a bootstrap over patients that preserves the cross-horizon correlation, or a multivariate Wald-type test against a monotone alternative) and, if the evidence is insufficient, present the trajectory as a descriptive summary rather than an established feature of the data-generating process.
- [Section 3.2, Eqs. (2)-(3), Algorithm 1] The weighted least-squares and spline fits use weights w(t)=1/sigma^2(t), which treat the ten horizon-specific ATE estimates as independent. Because all horizons are estimated from the same patients in the held-out test set, the estimates are correlated, and inverse-variance weighting without the covariance terms will understate the uncertainty of the fitted curve, of t_peak, and of the half-life. Please estimate or account for the cross-horizon covariance (e.g., by patient-level bootstrap or by a joint estimating-equation approach) and recompute the summary metrics and their uncertainties.
- [Appendix A.2, A.5, Theorem 3] The theoretical guarantees are weaker than the main text suggests. Theorem 1 assumes consistency of the causal survival forests (Assumption A5) rather than establishing the required regularity conditions, and Theorem 3 only proves consistency of the estimated peak time under the assumption that the true trajectory is exactly quadratic with beta_2 less than zero. The appendix does not address model misspecification, does not give a rate of convergence, and does not provide a confidence interval for the peak. Please state clearly which results are imported from the causal survival forest literature, supply the needed conditions, or downgrade the claims to propositions conditional on those imported results.
- [Section 6, Appendix B Table 1, Appendix C.4] Unmeasured confounding is a first-order threat to the causal claims, and the sensitivity analysis currently does not quantify it in a way calibrated to the observed data. The authors acknowledge in the Limitations paragraph that diet, lifestyle, and genetic risk are not included, and Appendix B Table 1 shows strong covariate imbalance between treatment groups (mean TNM stage 1.73 in controls versus 3.46 in treated patients; HPV positivity 0.68 versus 0.51). The synthetic-confounder experiments report shifts for correlations r=0.1, 0.3, 0.5, but they do not relate these strengths to the observed imbalance or to the magnitude of confounding that would be needed to explain away the trajectory. Please add a quantified bias analysis (e.g., E-values or a calibrated confounding model) for the main peak-and-decline claim.
minor comments (5)
- [Appendix B, Table 1] The caption reads Summary statistics of the simulated dataset, but the surrounding text describes the observed RADCURE cohort; moreover, the 48-month survival values of 0.0% and 0.1% are inconsistent with the 22.2% of patients still at risk at year 6 stated in Section 6. Please clarify whether this table is observed data or a simulation and correct the apparent inconsistency.
- [Section 5, Table 2] The text reports a 5-year SP gain of 15.0 plus or minus 6.7 percentage points, whereas Table 2 lists 0.168 with SE 0.071 at 60 months; please reconcile the numbers.
- [Appendix C.3] The text refers to Figures 4 and 5 for the distribution plots, but the panels appear to be Figures 7 and 8; the cross-references need correction.
- [Section 5 and Appendix C.2] The main text says younger age and HPV positivity are associated with greater benefit, while the Appendix C.2 Figure 4 caption says Older age is linked to greater chemotherapy benefit; these statements are contradictory and should be aligned.
- [Abstract and Section 3] The phrase continuous functions of time following treatment overstates the method: the underlying causal survival forest estimates are still computed at ten discrete horizons, and the continuity comes from the post hoc quadratic or spline fit. Please phrase the contribution precisely to avoid promising fully continuous causal estimation.
Circularity Check
No circularity: the continuous trajectory is an explicit smoothing summary of the discrete ATE estimates, not an independent prediction.
full rationale
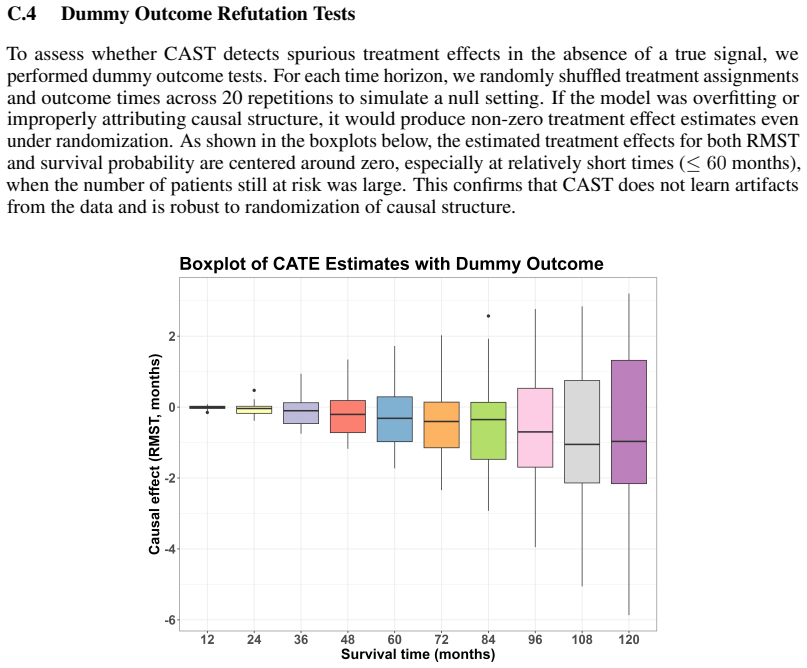
The paper's central claim about the rise, peak, and decline of chemotherapy benefit is obtained by fitting Eq. (2) and Eq. (3) to the ten horizon-specific ATE estimates reported in Table 2. This is not circular because the paper explicitly frames those fits as summaries of the point estimates (Algorithm 1 takes the horizon ATEs and standard errors as inputs), and the raw estimates already show a non-monotonic pattern (SP ATE 0.099 at 12 months, 0.178 at 48 months, 0.100 at 120 months). The peak timing is read off the fitted curve, but no claim is made that the continuous trajectory is independently predicted from the modeling assumptions; it is the defined output of an estimation algorithm. The self-citations to Shuryak et al. are used for BED calculation and radiobiological context, not as a uniqueness theorem or as the source of the causal trajectory. Appendix A.5's peak-time consistency theorem assumes the quadratic form rather than deriving it, which is an unverified model assumption and a robustness concern, but not a circular reduction. The absence of joint inference or simultaneous confidence bands for the trajectory is a statistical correctness issue, not circularity. Therefore no circular step meets the quoted-evidence standard required by the review protocol.
Assumptions & free parameters
free parameters (5)
- Quadratic coefficients beta_0, beta_1, beta_2 =
Not reported in main text; Appendix C.3 promised
- Spline smoothing parameter lambda =
Selected via cross-validation (not reported)
- Propensity score trimming bounds =
0.1 to 0.9 main; sensitivity at 0.01 to 0.10
- Forest size =
5,000 trees
- Horizon grid =
12, 24, ..., 120 months
assumptions (6)
- domain assumption Unconfoundedness / no unmeasured confounding (A1)
- domain assumption Positivity / overlap (A2), enforced by trimming
- standard math Consistency (A3) and non-interference
- domain assumption Non-informative censoring (A4)
- domain assumption Consistency of causal survival forests (A5)
- ad hoc to paper Quadratic functional form for the parametric trajectory
Cite this review
Pith. "Pith review of CAST: Time-Varying Treatment Effects with Application to Chemotherapy and Radiotherapy on Head and Neck Squamous Cell Carcinoma." pith.science (2026). https://pith.science/paper/ZSJ674HS
@misc{pith2026250506367,
  author       = {Pith},
  title        = {Pith review of: CAST: Time-Varying Treatment Effects with Application to Chemotherapy and Radiotherapy on Head and Neck Squamous Cell Carcinoma},
  year         = {2026},
  howpublished = {\url{https://pith.science/paper/ZSJ674HS}},
  note         = {Machine review of arXiv:2505.06367}
}
read the original abstract
Causal machine learning (CML) enables individualized estimation of treatment effects, offering critical advantages over traditional correlation-based methods. However, existing approaches for medical survival data with censoring such as causal survival forests estimate effects at fixed time points, limiting their ability to capture dynamic changes over time. We introduce Causal Analysis for Survival Trajectories (CAST), a novel framework that models treatment effects as continuous functions of time following treatment. By combining parametric and non-parametric methods, CAST overcomes the limitations of discrete time-point analysis to estimate continuous effect trajectories. Using the RADCURE dataset [1] of 2,651 patients with head and neck squamous cell carcinoma (HNSCC) as a clinically relevant example, CAST models how chemotherapy and radiotherapy effects evolve over time at the population and individual levels. By capturing the temporal dynamics of treatment response, CAST reveals how treatment effects rise, peak, and decline over the follow-up period, helping clinicians determine when and for whom treatment benefits are maximized. This framework advances the application of CML to personalized care in HNSCC and other life-threatening medical conditions. Source code/data available at: https://github.com/CAST-FW/HNSCC
Figures


Figures from the paper (9 more)




Reference graph
Works this paper leans on
-
[1]
M. L. Welch, S. Kim, A. Hope, S. H. Huang, Z. Lu, J. Marsilla, M. Kazmierski, K. Rey- McIntyre, T. Patel, B. O’Sullivan, J. Waldron, J. Kwan, J. Su, L. Soltan Ghoraie, H. B. Chan, K. Yip, M. Giuliani, Neck Site Group Princess Margaret Head, S. Bratman, and T. Tadic. Computed tomography images from large head and neck cohort (radcure) (version 4). The Canc...
- [2]
- [3]
-
[4]
K. Shiba and K. Inoue. Harnessing causal forests for epidemiologic research: key considerations. American Journal of Epidemiology, 193(6):813–818, June 2024. doi: 10.1093/aje/kwae003
-
[5]
A. Venkatasubramaniam, B. A. Mateen, B. M. Shields, A. T. Hattersley, A. G. Jones, S. J. V ollmer, and J. M. Dennis. Comparison of causal forest and regression-based approaches to evaluate treatment effect heterogeneity: an application for type 2 diabetes precision medicine. BMC Medical Informatics and Decision Making , 23(1):110, June 2023. doi: 10.1186/...
-
[6]
G. Solana-Lavalle, M. D. Cusimano, T. Steeves, R. Rosas-Romero, and P. N. Tyrrell. Causal forest machine learning analysis of parkinson’s disease in resting-state functional magnetic res- onance imaging. Tomography, 10(6):894–911, June 2024. doi: 10.3390/tomography10060068
-
[7]
Kosorok, Erik Sverdrup, Stefan Wager, and Ruoqing Zhu
Yifan Cui, Michael R. Kosorok, Erik Sverdrup, Stefan Wager, and Ruoqing Zhu. Estimating heterogeneous treatment effects with right-censored data via causal survival forests. Journal of the Royal Statistical Society: Series B, 85(2):380–403, 2023. doi: 10.1093/jrsssb/qkac020
-
[8]
C. V oinot, C. Berenfeld, I. Mayer, B. Sebastien, and J. Josse. Causal survival analysis, estimation of the average treatment effect (ate): Practical recommendations. arXiv preprint, January 2025. doi: 10.48550/arXiv.2501.05836
Show all 53 references
- [9]
-
[10]
Shuryak, E
I. Shuryak, E. Wang, and D. J. Brenner. Understanding the impact of radiotherapy fractionation on overall survival in a large head and neck squamous cell carcinoma dataset: A comprehensive approach combining mechanistic and machine learning models. Frontiers in Oncology, 14: 1...
2024
-
[11]
L. Hu, J. Ji, H. Joshi, E. R. Scott, and F. Li. Estimating the causal effects of multiple intermittent treatments with application to covid-19. Statistics in Medicine, 42(3):345–362, January 2023. doi: 10.1002/sim.9425
2023 doi
-
[12]
S. Miller. Causal forest estimation of heterogeneous and time-varying environmental policy effects. Journal of Environmental Economics and Management , 103:102337, 2020. doi: 10.1016/j.jeem.2020.102337
2020
-
[13]
Huang, N
Z. Huang, N. A. Mayr, M. Gao, S. S. Lo, J. Z. Wang, G. Jia, and W. T. C. Yuh. The onset time of tumor repopulation for cervical cancer: first evidence from clinical data. International Journal of Radiation Oncology*Biology*Physics, 84(2):478–484, October 2012. doi: 10.1016/j.i...
2012 doi
-
[14]
Petersen and F
C. Petersen and F. Würschmidt. Late toxicity of radiotherapy: a problem or a challenge for the radiation oncologist? Breast Care (Basel), 6(5):369–374, October 2011. doi: 10.1159/ 000334220
2011
-
[15]
Shuryak, E
I. Shuryak, E. J. Hall, and D. J. Brenner. Dose dependence of accelerated repopulation in head and neck cancer: Supporting evidence and clinical implications. Radiotherapy and Oncology, 127(1):20–26, April 2018. doi: 10.1016/j.radonc.2018.02.015. 11
2018 doi
-
[16]
D. E. Johnson, B. Burtness, C. R. Leemans, V . W. Y . Lui, J. E. Bauman, and J. R. Grandis. Head and neck squamous cell carcinoma. Nature Reviews Disease Primers, 6(92):1–22, November
-
[17]
Barsouk, J
A. Barsouk, J. S. Aluru, P. Rawla, K. Saginala, and A. Barsouk. Epidemiology, risk factors, and prevention of head and neck squamous cell carcinoma. Medical Sciences, 11(2):42, June 2023. doi: 10.3390/medsci11020042
2023 doi
-
[18]
M. E. Sabatini and S. Chiocca. Human papillomavirus as a driver of head and neck cancers. British Journal of Cancer, 122(3):306–314, February 2020. doi: 10.1038/s41416-019-0602-7
2020 doi
-
[19]
D. C. Beachler and G. D’Souza. Nuances in the changing epidemiology of head and neck cancer. Oncology (Williston Park), 24(10):924–926, September 2010. PMID: 21138173
2010
-
[20]
G. M. P. van Kempen, R. J. Baatenburg de Jong, and R. J. H. Borra. Hpv and head and neck cancers: Towards early diagnosis and prevention. Oral Oncology, 128:105214, September 2022. doi: 10.1016/j.oraloncology.2022.105214
2022
-
[21]
Mackeprang, K
P.-H. Mackeprang, K. Bryjova, A. E. Heusel, D. Henzen, M. Scricciolo, and O. Elicin. Consid- eration of image guidance in patterns of failure analyses of intensity-modulated radiotherapy for head and neck cancer: a systematic review. Radiation Oncology, 19(1):30, March 2024. d...
2024 doi
-
[22]
C. Kut, H. Quon, and X. S. Chen. Emerging radiotherapy technologies for head and neck squamous cell carcinoma: challenges and opportunities in the era of immunotherapy. Cancers (Basel), 16(24):4150, December 2024. doi: 10.3390/cancers16244150
2024 doi
-
[23]
S. R. Rathod, S. Gupta, S. Ghosh-Laskar, V . Murthy, A. Budrukkar, J. Agarwal, and K. Kannan. Quality-of-life (qol) outcomes in patients with head and neck squamous cell carcinoma treated with intensity-modulated radiation therapy (imrt) compared to three-dimensional conformal...
2013 doi
-
[24]
Viganò, F
A. Viganò, F. De Felice, N. A. Iacovelli, D. Alterio, R. Ingargiola, A. Casbarra, N. Facchinetti, O. Oneta, A. Bacigalupo, E. Tornari, S. Ursino, F. Paiar, O. Caspiani, A. Di Rito, D. Musio, P. Bossi, P. Steca, B. A. Jereczek-Fossa, L. Caso, N. Palena, A. Greco, and E. Orlandi...
2023
-
[25]
R. Yang, A. C. Freeman-Cook, H. C. Kurnik, and D. C. Kirouac. Dissecting variability in responses to cancer chemotherapy through systems pharmacology. Clinical Pharmacology & Therapeutics, 88(1):34–38, July 2010. doi: 10.1038/clpt.2010.96
2010 doi
-
[26]
How long does it take chemotherapy to shrink tumors? Cancerwise, MD Ander- son Cancer Center , 2024
Janet Tu. How long does it take chemotherapy to shrink tumors? Cancerwise, MD Ander- son Cancer Center , 2024. https://www.mdanderson.org/cancerwise/how-long-does-it-take- chemotherapy-to-shrink-tumors.h00-159696756.html
2024
-
[27]
Coping with chemotherapy
UCSF Health. Coping with chemotherapy. Patient Education, UCSF Health , 2025. https://www.ucsfhealth.org/education/coping-with-chemotherapy
2025
-
[28]
Y . Sun, Z. Wang, S. Qiu, and R. Wang. Therapeutic strategies of different hpv status in head and neck squamous cell carcinoma. International Journal of Biological Sciences, 17(4):1104–1118, March 2021. doi: 10.7150/ijbs.58077
2021 doi
-
[29]
K. K. Ang, J. Harris, R. Wheeler, R. Weber, D. I. Rosenthal, P. M. Nguyen-Tan, et al. Human papillomavirus and survival of patients with oropharyngeal cancer. New England Journal of Medicine, 363(1):24–35, July 2010. doi: 10.1056/NEJMoa0912217
2010 doi
-
[30]
Y . Wu, Y . Wang, J. Liu, Y . Wang, Y . Li, Y . Hu, H. Qiu, Z. Liang, Y . Wei, and H. Zhong. Hpv- positive status is a favorable prognostic factor in non-nasopharyngeal head and neck squamous cell carcinoma patients: a population-based study. Frontiers in Oncology, 11:765, Oct...
2021 doi
-
[31]
Jiang, Y
N. Jiang, Y . Wu, and C. Li. Limitations of using cox proportional hazards model in car- diovascular research. Cardiovascular Diabetology, 23(219), June 2024. doi: 10.1186/ s12933-024-02302-2
2024
-
[32]
L. Xu, S. Jiang, T. Li, and Y . Xu. Limitations of the cox proportional hazards model and alternative approaches in metachronous recurrence research. Gastric Cancer, 27(6):1348–1349, November 2024. doi: 10.1007/s10120-024-01554-x
2024 doi
-
[33]
S. Saha. Survival analysis with bayesian additive regression trees and its application. https://huskiecommons.lib.niu.edu/allgraduate-thesesdissertations/5158/, 2017. Northern Illi- nois University Thesis
2017
-
[34]
F. Zhai, S. Mu, Y . Song, M. Zhang, C. Zhang, and Z. Lv. A random survival forest model for predicting residual and recurrent high-grade cervical intraepithelial neoplasia in premenopausal women. International Journal of Women’s Health, 16:1775–1787, October 2024. doi: 10.2147...
2024
-
[35]
Matsuo, S
K. Matsuo, S. Purushotham, B. Jiang, R. S. Mandelbaum, T. Takiuchi, Y . Liu, and L. D. Roman. Survival outcome prediction in cervical cancer: Cox models vs deep-learning model. American Journal of Obstetrics and Gynecology , 220(4):381.e1–381.e14, April 2019. doi: 10.1016/j.aj...
2019 doi
-
[36]
Zhang, N
Y . Zhang, N. Kreif, V . S. Gc, and A. Manca. Machine learning methods to estimate individual- ized treatment effects for use in health technology assessment. Medical Decision Making, 44 (7):756–769, October 2024. doi: 10.1177/0272989X241263356
2024 doi
- [37]
-
[38]
S. R. Künzel, J. S. Sekhon, P. J. Bickel, and B. Yu. Metalearners for estimating heterogeneous treatment effects using machine learning. Proceedings of the National Academy of Sciences of the United States of America, 116(10):4156–4165, 2019. doi: 10.1073/pnas.1804597116
2019 doi
-
[39]
L. Wen, J. G. Young, J. M. Robins, and M. A. Hernán. Parametric g-formula implementations for causal survival analyses. Biometrics, 77(2):740–753, June 2021. doi: 10.1111/biom.13321
2021 doi
-
[40]
D. Lee, S. Yang, and X. Wang. Doubly robust estimators for generalizing treatment effects on survival outcomes from randomized controlled trials to a target population. Journal of Causal Inference, 10(1):415–440, December 2022. doi: 10.1515/jci-2022-0004
2022 doi
-
[41]
Treatment heterogeneity with right-censored outcomes using grf
Erik Sverdrup and Stefan Wager. Treatment heterogeneity with right-censored outcomes using grf. ASA Lifetime Data Science Newsletter, 2024. arXiv:2312.02482
2024 arXiv
- [42]
- [43]
-
[44]
W. J. Allard and L. W. M. M. Terstappen. Ccr 20th anniversary commentary: Paving the way for circulating tumor cells. Clinical Cancer Research, 21(13):2883–2885, July 2015. doi: 10.1158/1078-0432.CCR-14-2559
2015 doi
-
[45]
J. A. Langendijk, P. Doornaert, I. M. Verdonck de Leeuw, C. R. Leemans, N. K. Aaronson, and B. J. Slotman. Impact of late treatment-related toxicity on quality of life among patients with head and neck cancer treated with radiotherapy. Journal of Clinical Oncology, 26(22): 377...
2008 doi
-
[46]
A. F. Brouwer, R. Meza, M. C. Eisenberg, C. H. Chapman, M. C. He, S. B. Chinn, A. M. Mondul, M. Banerjee, M. Ryser, and J. M. Taylor. Time-varying survival effects for squamous cell carcinomas at oropharyngeal and nonoropharyngeal head and neck sites in the united states, 1973...
1973 doi
-
[47]
E. K. Roberts, L. Luo, A. M. Mondul, M. Banerjee, C. M. Veenstra, A. B. Mariotto, M. J. Schipper, K. He, J. M. G. Taylor, and A. F. Brouwer. Time-varying associations of patient and tumor characteristics with cancer survival: an analysis of seer data across 14 cancer sites, 20...
2004
-
[48]
Chernozhukov, D
V . Chernozhukov, D. Chetverikov, M. Demirer, E. Duflo, C. Hansen, W. Newey, and J. Robins. Double/debiased machine learning for treatment and structural parameters. Econometrics Journal, 21(1):C1–C68, January 2018. doi: 10.1093/ectj/uty017
2018 doi
-
[49]
Wager and S
S. Wager and S. Athey. Estimation and inference of heterogeneous treatment effects using random forests. Journal of the American Statistical Association, 113(523):1228–1242, July
-
[50]
Athey, J
S. Athey, J. Tibshirani, and S. Wager. Generalized random forests. Annals of Statistics, 47(2): 1148–1178, April 2019. doi: 10.1214/18-AOS1709
2019 doi
-
[51]
Shuryak, E
I. Shuryak, E. J. Hall, and D. J. Brenner. Optimized hypofractionation can markedly improve tumor control and decrease late effects for head and neck cancer. International Journal of Radiation Oncology, Biology, Physics, 104(2):272–278, June 2019. doi: 10.1016/j.ijrobp.2019. 0...
2019 doi
-
[2018]
doi: 10.1080/01621459.2017.1319839
2017
-
[2020]
doi: 10.1038/s41572-020-00224-3
Reviewed August 15, 2026 · model on record in the stance chip above.
Discussion (0). Continue with ORCID to comment.