REVIEW 4 major objections 6 minor 68 references
IrrMap: A Large-Scale Comprehensive Dataset for Irrigation Method Mapping
T0 review · 4 major / 6 minor · reviewed 2026-08-15 · deepseek-v4-flash
Pith's one-line read A new dataset of 1.1 million satellite patches maps drip, sprinkler, and flood irrigation across the western U.S.
desk verdict A genuinely novel dataset resource for irrigation method mapping that deserves peer review, but the label fidelity is unvalidated and the internal numbers need a cleanup. read the letter →
The pith
A machine-rendered reading of the paper's core claim, the machinery that carries it, and where it could break.
The reading
What carries the argument
The central object is the IrrMap dataset: $224\times224$ GeoTIFF patches in a unified WGS-84 grid, each containing LandSat and Sentinel spectral bands, an irrigation mask (other/flood/sprinkler/drip), a 21-class crop mask, a binary land mask, and twelve computed vegetation indices. The mechanism that carries the argument is the label-integration and quality-filtering pipeline: it reprojects four independent state datasets to one coordinate system, maps heterogeneous original labels such as 'center pivot' and 'traveling gun' onto three irrigation classes, deletes ambiguous multi-method labels, and reduces 25.6 TB of raw imagery to 6.2 TB of clean patches after both automated and manual quality checks. This pipeline is what makes the new task of irrigation-method prediction feasible at scale.
What would settle it
Compare IrrMap labels against on-the-ground verification: visit a random sample of fields across the four states and record the actual irrigation method, then measure agreement with the dataset's pixel labels; if agreement is far below the benchmark performance levels, the label-quality premise fails. A cheaper check is to compare each state's irrigation-method acreage totals against the U.S. Department of Agriculture's independent Farm and Ranch Irrigation Survey totals for the same years; a large systematic divergence would indicate label-source bias.
Extended reading notes
Core claim
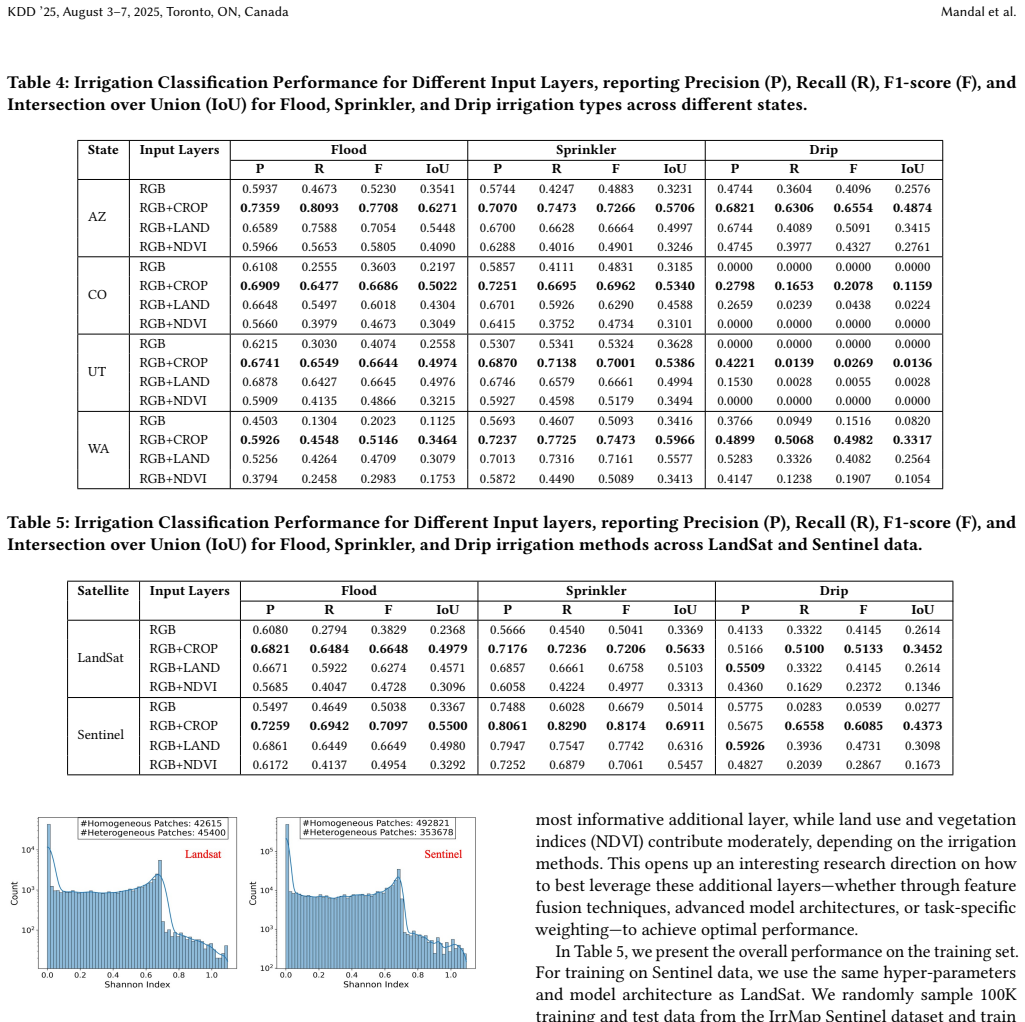
The paper's discovery is a dataset, not a new model: IrrMap provides pixel-level labels for drip, sprinkler, and flood irrigation over 1,687,899 farms and 14,117,330 acres, with spatially aligned raster layers that let a segmentation model treat irrigation-method mapping as a classification task. The paper reports that this is the first and largest dataset dedicated to irrigation-method mapping. Benchmarks on LandSat data show that RGB plus a crop-type mask consistently outperforms RGB alone, with roughly 30–50% higher F1, and similar gains appear on Sentinel data; the crop mask is the most informative auxiliary layer.
Load-bearing premise
That the irrigation labels taken from four different state agencies, after manual mapping to drip/sprinkler/flood and removal of mixed-method entries, are accurate enough to serve as ground truth for every patch; inconsistencies among these sources would propagate into all trained models and reported benchmarks.
Editorial extensions
If this is right
- Supervised models trained on IrrMap can classify flood, sprinkler, and drip irrigation at 10–30 m resolution, with crop type the most informative auxiliary input.
- Researchers can extend the provided pipeline to new regions, enabling irrigation-method maps beyond the four western states initially covered.
- The dataset's spatial diversity statistics, including Shannon diversity indices, support studies of mixed versus homogeneous irrigation practices at the patch level.
- The release of data, dataloaders, trained models, and benchmark code gives later work a common comparison point for irrigation-method segmentation.
- Because LandSat covers more years than Sentinel, temporal analyses of irrigation-method change are possible from 2013 onward.
Reading between the lines
- If the label quality holds, IrrMap could serve as pretraining data for agricultural foundation models, letting method classification transfer to states where no irrigation-method labels are published.
- Pairing IrrMap labels with water-use models would allow estimating not just where irrigation occurs but what fraction of water withdrawals is flood, sprinkler, or drip, a quantity current irrigated-area maps cannot provide.
- The deliberate collapse of center pivots, big guns, and wheel lines into a single 'sprinkler' class means method-level water-efficiency estimates will be approximate; retaining finer subclasses in a future version would sharpen them.
- A straightforward testable extension is a temporal change-detection study on LandSat patches from 2013–2023 to see whether the dataset records furrow-to-sprinkler conversions like those observed in southern Idaho.
Signed reviews
Editorial analysis
A structured set of objections, weighed in public.
Referee Report
Summary. The paper introduces IrrMap, a dataset of roughly 1.1 million 224x224 patches of LandSat (30 m) and Sentinel (10 m) imagery over Arizona, Colorado, Utah, and Washington, with pixel-level irrigation masks assigned to drip, sprinkler, and flood (plus a non-irrigated/other class). The dataset also contains crop-type masks, land-use masks, and twelve vegetation indices, along with a generation pipeline, manual quality review of over 18,000 patches, state-wise train/test splits, descriptive analyses, and initial segmentation benchmarks. The central claim is that IrrMap is the first large-scale, ML-ready dataset dedicated to irrigation-method mapping, and that its release with code and models will enable reproducible research and extension to new regions.
Significance. If the label fidelity and dataset statistics were verified and the promised releases were complete, the contribution would be significant: it would fill a clear gap between irrigated/non-irrigated products such as LANID and IrrMapper and the finer-grained task of distinguishing irrigation methods. The multi-resolution design, the provision of auxiliary layers, and the reproducible pipeline are concrete strengths, and the benchmark finding that adding a crop mask improves segmentation F1 is actionable for the community. However, the paper's own Section 8 concedes that the dataset is subject to data inconsistencies, noise, and rasterization artifacts, and Supplementary Figure 8(d) shows incomplete irrigation annotations, while no quantitative validation of the irrigation labels is reported. Because every patch label and every benchmark conclusion inherits the quality of the four state-level source datasets, the significance of the contribution is conditional on a credible label-validation study.
major comments (4)
- [§4 Quality Filtering; §8; Supplementary Figure 8(d)] The central claim that IrrMap provides reliable ground-truth irrigation labels is not supported by any quantitative label-quality assessment. Section 8 concedes that the merged dataset is "subject to data inconsistencies, noise, and rasterization artifacts," and Supplementary Figure 8(d) shows an irrigation mask with missing labels. The manual review of 18,000 patches described in Section 4 assigns a binary quality flag Q for contamination, and the paper does not state whether this review corrected irrigation labels or only flagged cloud/shadow/snow. Please report a validation study of the irrigation labels themselves, for example per-state agreement with independent records or high-resolution imagery on a stratified sample, inter-annotator agreement, and a per-class error analysis, and clarify the exact role of the manual review.
- [Abstract; §1.1; §3; Table 1; §4; §9] The headline dataset statistics are internally inconsistent. The Abstract and Table 1 report 1,687,899 farms and 14,117,330 acres; Section 1.1 reports 1,668,899 farms and 11,443,492 acres; Section 3 reports "approximately 1,443,492.31 acre"; Section 4 states the data covers "over 11 million acres"; and the Conclusion repeats 14.1 million acres. These numbers must be reconciled in a single authoritative table, because the dataset size and coverage are primary contribution claims and users need a definitive description of the released artifact.
- [§3 Table 1; §4 Label Integration; §8] The crop mask is described inconsistently, and its source is contradictory. Section 3 says 143 crops were consolidated into 20 groups, and Table 1 lists exactly 20 named groups but reports a patch shape of 224×224×21. Section 4 defines C in {0,...,21}^{224×224} and says each pixel is one of 21 crop types, implying 22 classes when the no-crop class is included. Section 8 further states that the crop mask relies on "model-generated" cropland data, which conflicts with Section 3's attribution of crop types to the USGS Verified Irrigated Agricultural Lands datasets. Because RGB+CROP is the best-performing configuration in Tables 4 and 5, please clarify the exact number of crop classes, the provenance of each crop layer, and the potential effect of model-generated labels on the benchmark conclusions.
- [§6; Table 5] The description of Table 5 is incorrect or at least unclear: the text says it presents "overall performance on the training set," but the experiments are described as evaluating on test sets, and reporting benchmark numbers on the training set would invalidate the comparison. In addition, the LandSat RGB+LAND row for Drip lists the same Recall, F1, and IoU as the RGB row (0.3322, 0.4145, 0.2614) while Precision changes to 0.5509, which is impossible under the standard definitions in Equation (3) unless the row is misreported. Please restate the correct evaluation split and correct the table entries.
minor comments (6)
- [§3 text after Table 1] The reference "See Table 3a" should point to Table 1, where the per-state irrigation statistics actually appear; Table 3 is the irrigation-method mapping table.
- [§5 Equation (1)] The Shannon index formula is garbled; the fraction inside the logarithm should be written unambiguously as p_i divided by the sum over j of p_j.
- [§4 Train-Test Splitting] The dataset name is spelled "IrriMap" once in this paragraph, which is inconsistent with "IrrMap" used elsewhere in the paper.
- [§4 vs §7] Section 4 says over 18,000 patches were manually reviewed, while Section 7 refers to "20K labeled samples of cloud, snow, and shadow"; please reconcile these counts.
- [Table 1; Table 2] Table 1 lists "Vinetard" instead of "Vineyard" and shows 20 named crop groups despite a reported 224×224×21 shape; Table 2 has a malformed header "IrrMapAZ UT W A CO" that should be split into separate state columns.
- [Throughout] There are several typos: "LanSat" in Section 5, "homoegeneous" and "broder" in Section 5, "vegetable indices" in Section 9, and "IrriMap" in Section 8; these should be corrected in a copyedit pass.
Circularity Check
No significant circularity: the dataset construction, benchmarks, and analyses are driven by external label sources and held-out evaluation, not by self-referential derivation.
full rationale
IrrMap is a dataset-construction and benchmarking paper, not a derivation of a target result from fitted inputs. The irrigation labels come from four external public-agency sources (Utah WRLU, Washington WSDA, Colorado CDSS, Arizona USGS, Section 3), which are then mapped to drip/sprinkler/flood. No equation in the paper defines the labels in terms of the model outputs or vice versa; the irrigation mask Y in Section 4 is assembled from the external vector labels by pixel-wise rasterization. The benchmarks in Section 6 train UNet-style models on held-out test splits and compare input-layer configurations (RGB, RGB+CROP, RGB+LAND, RGB+NDVI). These are empirical comparisons of different feature inputs, not predictions of parameters that were fitted to the same benchmark target, so the improvement claims (e.g., 'RGB + Crop Mask consistently achieves the highest accuracy') are not forced by construction. The Section 5 irrigation-crop relationship analysis is a descriptive statistical summary of the same labels; it is not presented as a prediction derived from a fitted parameter, and descriptive summarization is not circular. The only self-citation is reference [36], the authors' own arXiv version, cited in the Supplementary Material as 'More details are available in our online Appendix [36]'; this points to supplementary documentation and carries no load-bearing argument. The paper also explicitly disclaims label and auxiliary-data limitations in Section 8: 'Since the dataset is merged from multiple sources, it is subject to data inconsistencies, noise, and rasterization artifacts that may impact accuracy' and 'The crop mask relies on the cropland data, which is a model-generated mask.' These are honesty about label fidelity, which is a data-quality/correctness concern, not evidence of circular reasoning. No self-definitional step, fitted-input-as-prediction, imported uniqueness claim, or ansatz smuggled via citation is present. Accordingly, no circular step is identified and the score is 0.
Assumptions & free parameters
assumptions (5)
- domain assumption Irrigation labels from four state sources (WRLU, WSDA, CDSS, USGS) are accurate and can be consistently mapped to drip, sprinkler, flood, and other.
- domain assumption Pixel-wise rasterization of vector field polygons to 30m and 10m grids preserves irrigation method at the patch level.
- domain assumption The crop mask is an independent auxiliary input and does not already encode the irrigation method label.
- domain assumption QA-band filtering plus manual review of 18,000 patches is sufficient to ensure the remaining patches are clean enough for training.
- domain assumption Removing fields with multiple assigned irrigation methods does not bias the dataset.
Cite this review
Pith. "Pith review of IrrMap: A Large-Scale Comprehensive Dataset for Irrigation Method Mapping." pith.science (2026). https://pith.science/paper/YGUMGOE5
@misc{pith2026250508273,
  author       = {Pith},
  title        = {Pith review of: IrrMap: A Large-Scale Comprehensive Dataset for Irrigation Method Mapping},
  year         = {2026},
  howpublished = {\url{https://pith.science/paper/YGUMGOE5}},
  note         = {Machine review of arXiv:2505.08273}
}
read the original abstract
We introduce IrrMap, the first large-scale dataset (1.1 million patches) for irrigation method mapping across regions. IrrMap consists of multi-resolution satellite imagery from LandSat and Sentinel, along with key auxiliary data such as crop type, land use, and vegetation indices. The dataset spans 1,687,899 farms and 14,117,330 acres across multiple western U.S. states from 2013 to 2023, providing a rich and diverse foundation for irrigation analysis and ensuring geospatial alignment and quality control. The dataset is ML-ready, with standardized 224x224 GeoTIFF patches, the multiple input modalities, carefully chosen train-test-split data, and accompanying dataloaders for seamless deep learning model training andbenchmarking in irrigation mapping. The dataset is also accompanied by a complete pipeline for dataset generation, enabling researchers to extend IrrMap to new regions for irrigation data collection or adapt it with minimal effort for other similar applications in agricultural and geospatial analysis. We also analyze the irrigation method distribution across crop groups, spatial irrigation patterns (using Shannon diversity indices), and irrigated area variations for both LandSat and Sentinel, providing insights into regional and resolution-based differences. To promote further exploration, we openly release IrrMap, along with the derived datasets, benchmark models, and pipeline code, through a GitHub repository: https://github.com/Nibir088/IrrMap and Data repository: https://huggingface.co/Nibir/IrrMap, providing comprehensive documentation and implementation details.
Figures


Figures from the paper (5 more)




Reference graph
Works this paper leans on
-
[1]
Aniruddha Adiga, Surbhi Singh, Ethan Choo, Johnny Yang, Srinivasan Venkatra- manan, Anjana Devkota, Bharat Babu Shrestha, Seerjana Maharjan, Sita Gyawali, Sandeep Dhakal, Krishna Poudel, Pramod Kumar Jha, Rangaswamy Muniappan, Madhav Marathe, and Abhijin Adiga. 2023. A Robust Deep Learning Framework Reveals the Spread of Multiple Invasive Plants in a Biod...
work page 2023
-
[2]
Niel Allen, Alfonso Torres-Rua, Anastasia Thayer Hassett, Ryan Larsen, and Matt Yost
L. Niel Allen, Alfonso Torres-Rua, Anastasia Thayer Hassett, Ryan Larsen, and Matt Yost. 2021. Utah Agricultural Water Optimization - Wa- ter Savings from Drip Irrigation . Technical Report. Utah State Univer- sity. https://water.utah.gov/wp-content/uploads/2021/12/Utah-Ag-Water- Optimization-Drip-Irr-USU-Dec-2021.pdf
work page 2021
- [3]
-
[4]
D. Bjorneberg, B. King, and A. Koehn. 2020. Watershed water balance changes as furrow irrigation is converted to sprinkler irrigation in an arid region. Journal of Soil and Water Conservation 75, 3 (2020), 254–262. doi:10.2489/jswc.75.3.254
-
[5]
S Bontemps, M Boettcher, C Brockmann, G Kirches, C Lamarche, J Radoux, M Santoro, E Vanbogaert, U Wegmüller, M Herold, et al. 2015. Multi-year global land cover mapping at 300 m and characterization for climate modelling: achievements of the Land Cover component of the ESA Climate Change Initiative. The Interna- tional Archives of the Photogrammetry, Remo...
work page 2015
-
[6]
Jesslyn F Brown and Md Shahriar Pervez. 2014. Merging remote sensing data and national agricultural statistics to model change in irrigated agriculture. Agri- cultural Systems 127 (2014), 28–40
work page 2014
-
[7]
Inacio T Bueno, João FG Antunes, Aliny A Dos Reis, João PS Werner, Ana PS- GDD Toro, Gleyce KDA Figueiredo, Júlio CDM Esquerdo, Rubens AC Lamparelli, Alexandre C Coutinho, and Paulo SG Magalhães. 2023. Mapping integrated crop-livestock systems in Brazil with planetscope time series and deep learning. Remote Sensing of Environment 299 (2023), 113886
work page 2023
-
[8]
Manuel Campos-Taberner, Francisco Javier García-Haro, Beatriz Martínez, Emma Izquierdo-Verdiguier, Clement Atzberger, Gustau Camps-Valls, and María Amparo Gilabert. 2020. Understanding deep learning in land use classification based on Sentinel-2 time series. Scientific reports 10, 1 (2020), 17188
work page 2020
Show all 68 references
-
[9]
Chen and M
L. Chen and M. Wang. 2022. Extracting Agricultural Fields from Remote Sensing Imagery Using Graph-Based Growing Contours. Remote Sensing, MDPI (2022). https://www.mdpi.com/2072-4292/12/7/1205
2022
-
[10]
Yezhen Cong, Samar Khanna, Chenlin Meng, Patrick Liu, Erik Rozi, Yutong He, Marshall Burke, David Lobell, and Stefano Ermon. 2022. Satmae: Pre-training transformers for temporal and multi-spectral satellite imagery. Advances in Neural Information Processing Systems 35 (2022), 197–211
2022
-
[11]
Thijs de Geus, Panagiotis Meletis, and Gijs Dubbelman. 2020. Fast Panoptic Segmentation Network. IEEE Robotics and Automation Letters 1 (2020), 1–2, 6
2020
-
[12]
Jillian M Deines, Anthony D Kendall, Morgan A Crowley, Jeremy Rapp, Jeffrey A Cardille, and David W Hyndman. 2019. Mapping three decades of annual irriga- tion across the US High Plains Aquifer using Landsat and Google Earth Engine. Remote Sensing of Environment 233 (2019), 111400
2019
-
[13]
Caitlin Dempsey. 2024. Normalized Difference Water Index (NDWI) and Its Use in Flood Detection. Geography Realm. https://www.geographyrealm.com/ normalized-difference-water-index-flooding/ Accessed: February 7, 2024
2024
-
[14]
Maurilio Di Cicco, Ciro Potena, Giorgio Grisetti, and Alberto Pretto. 2017. Au- tomatic model based dataset generation for fast and accurate crop and weeds detection. In 2017 IEEE/RSJ International Conference on Intelligent Robots and Systems (IROS). IEEE, 5188–5195
2017
-
[15]
Petra Döll and Stefan Siebert. 2000. A digital global map of irrigated areas. ICID J 49, 2 (2000), 55–66
2000
-
[16]
Ernest A Engelbert and Ann Foley Scheuring. 2023. Water scarcity: Impacts on western agriculture. Univ of California Press
2023
-
[17]
Rachel R Fern, Elliott A Foxley, Andrea Bruno, and Michael L Morrison. 2018. Suitability of NDVI and OSAVI as estimators of green biomass and coverage in a semi-arid rangeland. Ecological Indicators 94 (2018), 16–21
2018
-
[18]
Jonathan A Foley, Navin Ramankutty, Kate A Brauman, Emily S Cassidy, James S Gerber, Matt Johnston, Nathaniel D Mueller, Christine O’Connell, Deepak K Ray, Paul C West, et al. 2011. Solutions for a cultivated planet. Nature 478, 7369 (2011), 337–342
2011
-
[19]
Bo-Cai Gao. 1996. NDWI—A normalized difference water index for remote sensing of vegetation liquid water from space. Remote sensing of environment 58, 3 (1996), 257–266
1996
-
[20]
Anatoly A Gitelson. 2004. Wide dynamic range vegetation index for remote quan- tification of biophysical characteristics of vegetation. Journal of plant physiology 161, 2 (2004), 165–173
2004
-
[21]
Abdurrahman Gonenc, Mehmet Sirac Ozerdem, and ACAR Emrullah. 2019. Com- parison of NDVI and RVI vegetation indices using satellite images. In 2019 8th International Conference on Agro-Geoinformatics (Agro-Geoinformatics) . IEEE, 1–4
2019
-
[22]
Cassandra Handan-Nader and Daniel E Ho. 2019. Deep learning to map concen- trated animal feeding operations. Nature Sustainability 2, 4 (2019), 298–306
2019
-
[23]
Alfredo Huete, Kamel Didan, Tomoaki Miura, E Patricia Rodriguez, Xiang Gao, and Laerte G Ferreira. 2002. Overview of the radiometric and biophysical perfor- mance of the MODIS vegetation indices. Remote sensing of environment 83, 1-2 (2002), 195–213
2002
-
[24]
Calvin Hung, Zhe Xu, and Salah Sukkarieh. 2014. Feature learning based approach for weed classification using high resolution aerial images from a digital camera mounted on a UAV. Remote Sensing 6, 12 (2014), 12037–12054
2014
-
[25]
Ippolito, Dave L
James A. Ippolito, Dave L. Bjorneberg, Steve W. Blecker, and Michael S. Massey. 2019. Mechanisms Responsible for Soil Phosphorus Availabil- ity Differences between Sprinkler and Furrow Irrigation. Journal of En- vironmental Quality 48, 5 (2019), 1370–1379. doi:10.2134/jeq2019....
2019 doi
-
[26]
Johannes Jakubik, S Roy, CE Phillips, P Fraccaro, D Godwin, B Zadrozny, D Szwar- cman, C Gomes, G Nyirjesy, B Edwards, et al. [n. d.]. Foundation models for gen- eralist geospatial artificial intelligence, 2023. URL https://arxiv. org/abs/2310.18660 ([n. d.])
2023 arXiv
-
[27]
Xiaowei Jia, Mengdie Wang, Ankush Khandelwal, Anuj Karpatne, and Vipin Kumar. 2019. Recurrent Generative Networks for Multi-Resolution Satellite Data: An Application in Cropland Monitoring. In Proceedings of the Twenty-Eighth International Joint Conference on Artificial Intell...
2019 doi
-
[28]
Zhenong Jin, George Azzari, Marshall Burke, Stephen Aston, and David B Lobell
-
[29]
David Ketchum, Kelsey Jencso, Marco P Maneta, Forrest Melton, Matthew O Jones, and Justin Huntington. 2020. IrrMapper: A machine learning approach for high resolution mapping of irrigated agriculture across the Western US. Remote Sensing 12, 14 (2020), 2328
2020
-
[30]
Nataliia Kussul, Mykola Lavreniuk, Sergii Skakun, and Andrii Shelestov. 2017. Deep learning classification of land cover and crop types using remote sensing data. IEEE Geoscience and Remote Sensing Letters 14, 5 (2017), 778–782
2017
-
[31]
Billie Leff, Navin Ramankutty, and Jonathan A Foley. 2004. Geographic dis- tribution of major crops across the world. Global biogeochemical cycles 18, 1 (2004)
2004
-
[32]
Guoyong Leng, L Ruby Leung, and Maoyi Huang. 2017. Significant impacts of irrigation water sources and methods on modeling irrigation effects in the ACME L and Model. Journal of Advances in Modeling Earth Systems 9, 3 (2017), 1665–1683
2017
-
[33]
Licheng Liu, Shaoming Xu, Jinyun Tang, Kaiyu Guan, Timothy J Griffis, Matthew D Erickson, Alexander L Frie, Xiaowei Jia, Taegon Kim, Lee T Miller, et al. 2022. KGML-ag: a modeling framework of knowledge-guided machine learning to simulate agroecosystems: a case study of estima...
2022
-
[34]
Licheng Liu, Wang Zhou, Kaiyu Guan, Bin Peng, Shaoming Xu, Jinyun Tang, Qing Zhu, Jessica Till, Xiaowei Jia, Chongya Jiang, et al. 2024. Knowledge-guided machine learning can improve carbon cycle quantification in agroecosystems. Nature communications 15, 1 (2024), 357
2024
-
[35]
Thomas R Loveland, Bradley C Reed, Jesslyn F Brown, Donald O Ohlen, Zhil- iang Zhu, LWMJ Yang, and James W Merchant. 2000. Development of a global land cover characteristics database and IGBP DISCover from 1 km AVHRR data. International journal of remote sensing 21, 6-7 (2000)...
2000
-
[36]
Nibir Chandra Mandal, Oishee Bintey Hoque, Abhijin Adiga, Samarth Swarup, Mandy Wilson, Lu Feng, Yangfeng Ji, Miaomiao Zhang, Geoffrey Fox, and Madhav Marathe. 2025. IrrMap: A Large-Scale Comprehensive Dataset for Irrigation Method Mapping. arXiv:2505.08273 [cs.CV] https://arx...
2025 arXiv
-
[37]
Eric Marcon, Ivan Scotti, Bruno Hérault, Vivien Rossi, and Gabriel Lang. 2014. Generalization of the partitioning of Shannon diversity. PloS one 9, 3 (2014), e90289
2014
-
[38]
Molly A Maupin. 2018. Summary of estimated water use in the United States in
2018
-
[39]
Jonas Meier, Florian Zabel, and Wolfram Mauser. 2018. A global approach to estimate irrigated areas–a comparison between different data and statistics. Hy- drology and Earth System Sciences 22, 2 (2018), 1119–1133
2018
-
[40]
S Meivel and SJMS Maheswari. 2022. Monitoring of potato crops based on multispectral image feature extraction with vegetation indices. Multidimensional Systems and Signal Processing 33, 2 (2022), 683–709
2022
-
[41]
Andres Milioto, Philipp Lottes, and Cyrill Stachniss. 2017. Real-time blob-wise sugar beets vs weeds classification for monitoring fields using convolutional neural networks. ISPRS Annals of the Photogrammetry, Remote Sensing and Spatial Information Sciences 4 (2017), 41–48
2017
-
[42]
Anders Krogh Mortensen, Mads Dyrmann, Henrik Karstoft, Rasmus Nyholm Jørgensen, and René Gislum. 2016. Semantic segmentation of mixed crops using deep convolutional neural network. (2016). IrrMap: A Large-Scale Comprehensive Dataset for Irrigation Method Mapping KDD ’25, Augus...
2016
-
[43]
Md Shahriar Pervez and Jesslyn F Brown. 2010. Mapping irrigated lands at 250-m scale by merging MODIS data and national agricultural statistics. Remote Sensing 2, 10 (2010), 2388–2412
2010
-
[44]
IR-4 Project. 2012. Index of crops/crop groups/crop subgroups, and crop defini- tions. (2012)
2012
-
[45]
Shanto Rahman, Md Mostafijur Rahman, Mohammad Abdullah-Al-Wadud, Go- lam Dastegir Al-Quaderi, and Mohammad Shoyaib. 2016. An adaptive gamma correction for image enhancement. EURASIP Journal on Image and Video Process- ing 2016 (2016), 1–13
2016
-
[46]
Hannah Ritchie and Max Roser. 2018. Water use and stress. Our World in Data (2018)
2018
-
[47]
M. L. Rodrigues, T. S. Korting, and G. R. de Queiroz. 2020. Circular hough transform and balanced random forest to detect center pivot systems. In GeoInfo. 106–117
2020
-
[48]
J. M. Salmon, M. A. Friedl, S. Frolking, D. Wisser, and E. M. Douglas. 2015. Global rain-fed, irrigated, and paddy croplands: A new high resolution map derived from remote sensing, crop inventories and climate data. International Journal of Applied Earth Observation and Geoinf...
2015
-
[49]
Saraiva, E
M. Saraiva, E. Protas, M. Salgado, and C. Souza. 2020. Automatic mapping of center pivot irrigation systems from satellite images using deep learning. Remote Sensing 12, 3 (2020), 14. https://www.mdpi.com/2072-4292/12/3/558
2020
-
[50]
Stefan Siebert, Jacob Burke, Jean-Marc Faures, Karen Frenken, Jippe Hoogeveen, Petra Döll, and Felix Theodor Portmann. 2010. Groundwater use for irrigation–a global inventory. Hydrology and earth system sciences 14, 10 (2010), 1863–1880
2010
-
[51]
Stefan Siebert, Petra Döll, Jippe Hoogeveen, J-M Faures, Karen Frenken, and Sebastian Feick. 2005. Development and validation of the global map of irrigation areas. Hydrology and Earth System Sciences 9, 5 (2005), 535–547
2005
-
[52]
Stefan Siebert, Verena Henrich, Karen Frenken, and Jacob Burke. 2013. Update of the digital global map of irrigation areas to version 5. Rheinische Friedrich- Wilhelms-Universität, Bonn, Germany and Food and Agriculture Organization of the United Nations, Rome, Italy 10, 2.1 (...
2013
-
[53]
Siebert, M
S. Siebert, M. Kummu, M. Porkka, P. Doll, N. Ramankutty, and B. R. Scanlon. 2015. A global data set of the extent of irrigated land from 1900 to 2005. Hydrology and Earth System Sciences 19, 3 (2015), 1521–1545
2015
-
[54]
Siebert, M
S. Siebert, M. Kummu, M. Porkka, P. Döll, N. Ramankutty, and B. R. Scanlon. 2015. A global data set of the extent of irrigated land from 1900 to 2005. Hydrology and Earth System Sciences 19, 3 (2015), 1521–1545. doi:10.5194/hess-19-1521-2015
2015 doi
-
[55]
James A Slater and Stephen Malys. 1998. Wgs 84—past, present and future. In Advances in Positioning and Reference Frames: IAG Scientific Assembly Rio de Janeiro, Brazil, September 3–9, 1997 . Springer, 1–7
1998
-
[56]
Michael J Smith, Luke Fleming, and James E Geach. 2023. EarthPT: a foundation model for Earth Observation. arXiv preprint arXiv:2309.07207 (2023)
2023 arXiv
-
[57]
Pardhasaradhi Teluguntla, Prasad S Thenkabail, Jun Xiong, Murali Krishna Gumma, Chandra Giri, Cristina Milesi, Mutlu Ozdogan, Russ Congalton, James Tilton, Temuulen Tsagaan Sankey, et al. 2015. Global Cropland Area Database (GCAD) derived from remote sensing in support of food...
2015
-
[58]
Prasad S Thenkabail, Chandrashekhar M Biradar, Praveen Noojipady, Venkateswarlu Dheeravath, Yuanjie Li, Manohar Velpuri, Muralikrishna Gumma, Obi Reddy P Gangalakunta, Hugh Turral, Xueliang Cai, et al . 2009. Global ir- rigated area map (GIAM), derived from remote sensing, for...
2009
-
[59]
Franck Thénot, Maurice Méthy, and Thierry Winkel. 2002. The Photochemical Reflectance Index (PRI) as a water-stress index. International Journal of Remote Sensing 23, 23 (2002), 5135–5139
2002
-
[60]
Compton J Tucker. 1985. Satellite remote sensing of total herbaceous biomass production in the Senegalese Sahel: 1980–1984. Remote sensing of environment 17, 3 (1985), 233–249
1985
-
[61]
UN Water. 2020. The United Nations World Water Development Report 2020 Water and Climate Change (p. 235). United Nations educational
2020
-
[62]
Marie Weiss, Frédéric Jacob, and Grgory Duveiller. 2020. Remote sensing for agricultural applications: A meta-review. Remote sensing of environment 236 (2020), 111402
2020
-
[63]
Yanhua Xie, Holly K Gibbs, and Tyler J Lark. 2021. Landsat-based Irrigation Dataset (LANID): 30 m resolution maps of irrigation distribution, frequency, and change for the US, 1997–2017.Earth System Science Data 13, 12 (2021), 5689–5710
2021
-
[64]
Kun Zhang, Xin Li, Donghai Zheng, Ling Zhang, and Gaofeng Zhu. 2022. Es- timation of global irrigation water use by the integration of multiple satellite observations. Water Resources Research 58, 3 (2022), e2021WR030031
2022
-
[65]
Zhang and Y
X. Zhang and Y. Lee. 2023. Deriving Agricultural Field Boundaries for Crop Management from Satellite Images Using Semantic Feature Pyramid Network. Remote Sensing, MDPI (2023). https://www.mdpi.com/2072-4292/15/11/2937
2023
-
[66]
Baojuan Zheng, James B Campbell, and Kirsten M de Beurs. 2014. Remote sensing of crop residue cover using multi-temporal Landsat imagery. Remote Sensing of Environment 156 (2014), 312–321. KDD ’25, August 3–7, 2025, Toronto, ON, Canada Mandal et al. Supplementary Material More...
2014
-
[2015]
US Geological Survey
Technical Report. US Geological Survey
-
[2017]
Remote Sensing 9, 9 (2017), 931
Mapping smallholder yield heterogeneity at multiple scales in Eastern Africa. Remote Sensing 9, 9 (2017), 931
2017
Reviewed August 15, 2026 · model on record in the stance chip above.
Discussion (0). Continue with ORCID to comment.