REVIEW 4 major objections 5 minor 62 references
Dynamics of reactive oxygen species produced by the COST microplasma jet
T0 review · 4 major / 5 minor · reviewed 2026-08-15 · deepseek-v4-flash
Pith's one-line read The paper reports absolute flow-cell densities of O2(a1Δg) and O2(b1Σg+) from a COST plasma jet and shows that both a plug-flow model and a 2D fluid model reproduce the measurements within an order of magnitude, though both overestimate…
desk verdict First flow-cell O2(a1Δg) density data for the COST jet, but unquantified calibration factors and an unconverged 2D simulation make the absolute benchmark provisional. read the letter →
The pith
A machine-rendered reading of the paper's core claim, the machinery that carries it, and where it could break.
The reading
What carries the argument
The key experimental object is the quartz flow cell: a 79 mm long, 14 mm diameter chamber attached to the jet nozzle that enlarges the observable emission volume so that the weak 1270 nm transition of O2(a1Δg) becomes detectable. The absolute density is recovered from an emission-intensity equation $n_{\mathrm{O}_2(\mathrm{a}^1\Delta_{\mathrm g})}= I\cdot C\cdot \frac{1}{A_{ik}Q}\cdot\frac{\lambda}{hc}\cdot\frac{1}{V}\cdot\frac{1}{f(d\Omega)g}$, where $C$ is the energy-intensity calibration constant from a laser diode, $Q=A_{ik}/(A_{ik}+q)$ is the photon yield with $q=k_{\mathrm{O}_3} n_{\mathrm{O}_3}$ the ozone-dominated quenching rate, and $f(d\Omega)g$ are the geometric and loss factors for the optical path. The computational counterparts are a pseudo-1D plug-flow model that co-moves a reacting volume along the gas streamline and a 2D fluid simulation that resolves the non-uniform flow, including vortices in the flow cell. These two routes, a volume-averaged plug-flow prediction and a spatially resolved fluid prediction, are what the experiment is compared against.
What would settle it
Flow a known concentration of O2(a1Δg) from an independent source through the same flow cell and compare the density recovered from Eq. (2) with the known value; a systematic offset would reveal the unmeasured f(dΩ)g calibration. Alternatively, measure the geometric factor directly by scanning an isotropic 1270 nm point source along the cell volume.
Extended reading notes
Core claim
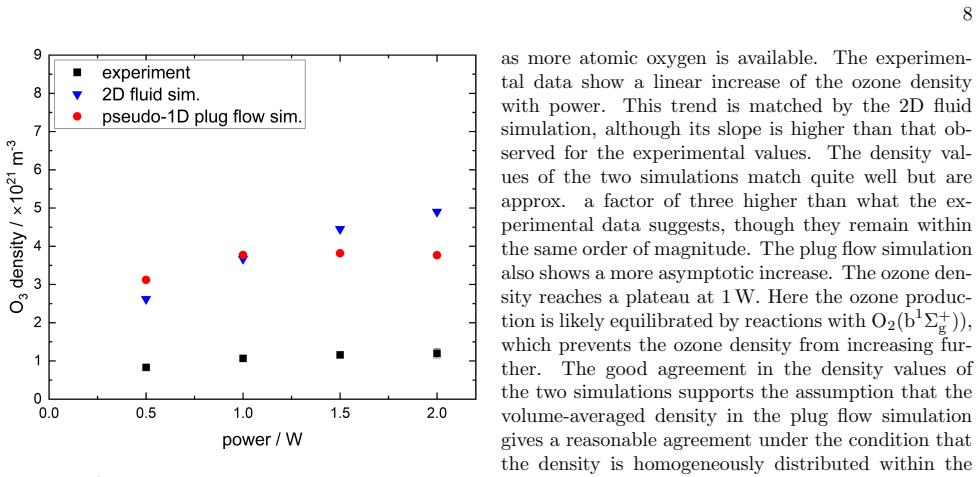
The central discovery is a set of absolute density measurements for O2(a1Δg) and O2(b1Σg+) in the COST jet, obtained by combining 1270 nm emission spectroscopy in a flow cell with ozone absorption measurements at 254 nm. The measured O2(a1Δg) density increases with plasma power and oxygen admixture and peaks near 1.5 slm helium flow. The O2(b1Σg+) density profiles along the discharge channel are well reproduced by the plug-flow simulation at 0.1–0.3% O2 admixture, but at higher admixtures the simulation overpredicts the consumption of O2(b1Σg+) toward the jet exit, which the authors attribute to the overestimated ozone density. Both simulations remain within a factor of about three of the measured ozone densities, with the 2D fluid simulation matching the shape of the power and admixture dependencies better than the plug-flow model. The paper concludes that the plasma-chemistry schemes are largely validated, but that effluent-region wall reactions and certain rate coefficients, especially those involving ozone, need refinement.
Load-bearing premise
The absolute O2(a1Δg) density rests on an energy-intensity calibration constant multiplied by a geometric factor f(dΩ) and a loss factor g that are not measured or described; if those are wrong, every reported singlet-oxygen density shifts by the same factor and the comparison to simulations changes.
Editorial extensions
If this is right
- The plug-flow model can serve as a fast screening tool for effluent densities even in flow-cell geometries, as long as volume-averaged comparisons are acceptable.
- The 2D fluid model is the better choice when spatial inhomogeneity inside the effluent matters, but users must run it long enough for long-lived species like ozone to homogenize before comparing to volume-averaged measurements.
- The consistent factor-of-three ozone overestimation indicates that ozone wall losses or effluent-region rate coefficients are missing or mis-set in both reaction schemes; correcting them should improve agreement for all ozone-coupled species.
- O2(b1Σg+) emission along the discharge channel offers a sensitive, easily measured indicator of ozone density, because the overestimated ozone shows up directly as an overestimated consumption rate of O2(b1Σg+).
- Flow-cell designs that suppress vortices would reduce the required simulation time and narrow the gap between plug-flow and fluid-model predictions.
Reading between the lines
- If the uncharacterized geometric factor f(dΩ) and loss factor g in Eq. (2) are not truly constant over the extended emission volume, all reported O2(a1Δg) densities may carry a systematic offset; a direct test would be to flow a known singlet-oxygen source through the same cell and check the recovered density.
- The ozone overestimation factor of about three may also matter for biomedical dose estimates, since ozone is a strong quencher of O2(a1Δg) and modulates the singlet-oxygen flux reaching a treated surface.
- A testable extension: adding an ozone wall-loss reaction with a measured sticking coefficient to both models should collapse the factor-of-three discrepancy, and the measured O2(b1Σg+) profiles provide a cheap diagnostic for validating that change.
- The flow-cell emission approach is generic and could be ported to other jet geometries, provided the calibration factors are measured in situ rather than assumed.
Signed reviews
Editorial analysis
A structured set of objections, weighed in public.
Referee Report
Summary. This manuscript reports absolute densities of O2(a1Δg) and O2(b1Σg+) produced by a COST microplasma jet with He/O2 mixtures, using a gas flow cell to enhance the detection volume for the weak 1270 nm emission and ozone absorption spectroscopy to determine the dominant quencher density. The measured O2(a1Δg) densities are compared with a pseudo-1D plug-flow model and a 2D fluid model, and the O2(b1Σg+) measurements are compared with the plug-flow model. The paper claims that both simulations align reasonably well with the experimental data, while the ozone density is overestimated by a factor of about three, and that this ozone overestimation is corroborated by the O2(b1Σg+) consumption rates. The authors conclude that the plasma chemistry in the models is well validated even for complicated effluent geometries.
Significance. If the quantitative claims stand, the paper would provide the first flow-cell-based absolute O2(a1Δg) densities for the COST jet and a useful benchmark for two commonly used modeling approaches. The experimental design is thoughtful in several respects: the O2(a1Δg) analysis uses the measured ozone density rather than the simulated one, so the measurements are not circularly tied to the models; the O2(b1Σg+) data provide an independent consistency check on the ozone overestimation; and the paper is transparent about known limitations such as the non-converged 2D simulation and omitted wall reactions. However, the central benchmark claim is not yet robust because the calibration factors f(dΩ) and g in Eq. (2) are unquantified and no uncertainty is assigned to any measured density, while the 2D simulation is explicitly not at steady state. The paper is therefore best read as a data-rich case study with testable trends, rather than as a fully validated quantitative benchmark in its present form.
major comments (4)
- [§2.4, Eq. (2)] Equation (2) contains the geometric factor f(dΩ) and the optical loss factor g, but the paper never gives their values, their derivation, or any uncertainty estimate for them; only the calibration constant C is described. The calibration source is a point-like laser diode, while the emission originates from the extended 79 mm × 14 mm flow-cell volume, and the detection collimator has a diameter of about 10 mm. The fraction of photons collected from an extended source cannot be inferred from a point-source calibration alone. Since f(dΩ) and g multiply the entire O2(a1Δg) density, an unquantified error of even ±50% in either factor changes every data point by that factor, which is comparable to the factor-of-three discrepancy in Fig. 11. The claim that the simulations align 'reasonably well' with the O2(a1Δg) measurements is therefore not reproducible until f(dΩ) and g are quantified or bounded.
- [§3.2, Figs. 5, 7, 11-13] The 2D fluid simulation is run for only about 0.2 s and is acknowledged not to have reached a steady state, whereas the experiments are performed after the jet has warmed up and the ozone absorption signal has been monitored for 1 hour, with spectra taken over 5 minutes after ignition. Figure 11 shows the 2D simulation exceeding the experimental O2(a1Δg) density by roughly a factor of three, and the text attributes this discrepancy to the non-equilibrium species distribution; similarly, Fig. 7 attributes the 2D simulation's asymptotic flow-rate trend to the same cause. Comparing a transient simulation with steady-state experiments cannot support the conclusion that the 2D model 'aligned reasonably well' with experiment. The authors should either run the simulation to steady state, present time-dependent results only as qualitative trend indicators, or explicitly label the 2D comparison as non-converged.
- [§3.1, Refs. [49] and [50]] The pseudo-1D plug-flow model uses a plasma-chemical kinetics scheme 'identical to that used in [49]' and evaluates the gas temperature with Eq. (1) of [49], but Ref. [49] is listed as 'to be submitted' and is not publicly available. Because the reaction set, rate coefficients, and gas-temperature model are central to the plug-flow predictions and to the claim that the plasma chemistry is 'well validated', the results cannot be reproduced or independently checked without a preprint, a supplementary listing of the full reaction scheme, or a published source. The authors should provide the complete chemistry set and rate data, or replace the unpublished reference with an accessible description.
- [Figs. 6-15 and Eq. (1)] No error bars or uncertainty estimates are given for any measured density, despite the paper making quantitative comparisons such as 'a factor of three higher', 'the slope is matching very well', and 'very good agreement'. The ozone density from Eq. (1) depends on pressure, temperature, absorption coefficient, and path length, none of which are assigned uncertainties; the O2(a1Δg) density further propagates the calibration and quenching uncertainties; and the O2(b1Σg+) density inherits the LED and photodiode calibration uncertainties. Without estimates of statistical and systematic uncertainty, the strength of the claimed agreement or disagreement with the simulations cannot be evaluated. The authors should provide at least repeat-measurement statistics, calibration uncertainties, and a propagation analysis through Eq. (2), or explicitly restrict the claims to order-of-magnitude comparisons.
minor comments (5)
- [§2.4 and §2.5] The decimal separator is inconsistent: '0,3 nm' should be written as '0.3 nm'.
- [§4.2, first paragraph] The text contains a typo: 'The bigger cross section in th flow cell' should read 'in the flow cell'.
- [Fig. 11 caption] The caption reads 'power of 1 slm He flow'; it should presumably be 'flow of 1 slm He'.
- [Abstract and §5] The phrase 'well validated plasma chemistry' is stronger than the factor-of-three ozone overestimation and the unquantified calibration factors support; consider softening to 'plasma chemistry in reasonable order-of-magnitude agreement'.
- [§2.2, Fig. 1] The flow cell is connected to the jet by a plastic cap, but it is not stated whether the cap and the inlet-tube junction are included in the simulation domain or in the plug-flow model's effluent length; this geometry detail should be clarified.
Circularity Check
No significant circularity: experimental densities are independent of the simulations; self-cited model chemistry is a dependency, not a feedback loop.
full rationale
The derivation chain is non-circular. The absolute O2(a1Δg) density in Eq. (2) is computed from the measured 1270 nm emission, the spectrometer calibration constant C determined with a laser diode and calibrated InGaAs photodiode, the known flow-cell volume, and the photon yield Q; the quenching rate q in Q uses the experimentally measured ozone density from Eq. (1), not a simulated value. The O2(b1Σg+) density is obtained with a separate LED/Si-photodiode calibration. Neither simulation output enters these equations, so the central experimental claim is not defined in terms of the models. The pseudo-1D plug-flow and 2D fluid models inherit their chemistry from prior work, including the unpublished, overlapping-author manuscript [49] and [55]; this is a reproducibility and dependency concern, and the manuscript itself flags missing support by citing [49] as 'to be submitted' and by not giving values or uncertainties for f(dΩ) and g in Eq. (2). However, no parameter is fitted to the present data, and the models explicitly disagree with experiment (ozone overestimated by a factor of about three), which is the opposite of a forced agreement. The self-citations are therefore not load-bearing for the validity of the measurements; the comparison retains independent, externally falsifiable content. Score 2 reflects the minor self-citation dependency (especially [49]) rather than any actual circular step.
Assumptions & free parameters
free parameters (2)
- geometric factor f(dΩ) =
not stated
- loss factor g =
not stated
assumptions (6)
- domain assumption The plasma-chemical kinetics schemes used in the two simulations are valid in the effluent region, including the transferability of wall reaction rates optimized for the plasma region.
- domain assumption The flow cell does not significantly alter the effluent chemistry and the line-of-sight averaged density can be modeled as a volume average.
- ad hoc to paper The spectrometer calibration with a point-like laser diode provides a valid absolute intensity calibration for the extended emission volume of the flow cell.
- domain assumption The gas temperature in the effluent regions is 300 K.
- domain assumption Ozone is the dominant quencher of O2(a1Δg), allowing the quenching term q to be reduced to k_O3 times n_O3.
- ad hoc to paper Reference [49], an unpublished manuscript, provides a validated chemistry set.
Cite this review
Pith. "Pith review of Dynamics of reactive oxygen species produced by the COST microplasma jet." pith.science (2026). https://pith.science/paper/BHHZ5LTK
@misc{pith2026250510204,
  author       = {Pith},
  title        = {Pith review of: Dynamics of reactive oxygen species produced by the COST microplasma jet},
  year         = {2026},
  howpublished = {\url{https://pith.science/paper/BHHZ5LTK}},
  note         = {Machine review of arXiv:2505.10204}
}
abstract
This study is focused on measuring the densities of the excited molecular oxygen species, O$_{2}(\text{a}^{1}\Delta_{\text{g}})$ and O$_{2}(\text{b}^{1}\Sigma_{\text{g}}^{+})$, produced in a COST atmospheric pressure plasma jet using a helium-oxygen mixture. Knowledge of the ozone density is critical for measurements because of its high quenching rate of these species. Additionally O$_{2}(\text{a}^{1}\Delta_{\text{g}})$ is difficult to measure, due to its low emission intensity and sensitivity to background interference in the plasma region. Therefore a flow cell was used to enhance signal detection in the effluent region. To validate the measurements and improve understanding of reaction mechanisms, results were compared with two simulation models: a pseudo-1D plug flow simulation and a 2D fluid simulation. The plug flow simulation provided an effective means for estimating species densities, with a fast computation time. The 2D simulation offered a more realistic description of the flow dynamics, which proved critical to correctly describe the experimental trends. However, it requires long computation times to reach an equilibrium state in the flow cell. Otherwise, it leads to discrepancies to the experimental data. Further discrepancies arose, from an overestimation of the ozone density from the models, as validated from the O$_{2}(\text{b}^{1}\Sigma_{\text{g}}^{+})$ density measurements. Optimizing the reaction rate coefficients for the effluent region might improve the agreement with the experimental results. Despite these limitations both simulations aligned reasonably well with experimental data, showcasing the well validated plasma chemistry of the models, even for complicated effluent geometries.
Figures


Figures from the paper (7 more)



Reference graph
Works this paper leans on
-
[1]
These plasma sources offer several advantages over traditional meth- ods
Introduction Micro atmospheric pressure plasma jets (µAPPJs) [1–6] have garnered significant interest due to their wide-ranging applications, including surface treatment [7, 8], etching [9], and deposition [6, 10]. These plasma sources offer several advantages over traditional meth- ods. Notably, they have a simple setup since they do not require vacuum e...
-
[2]
The red arrows indicate the gas flow direction
Methods Figure 1: Schematic of the quartz flow cell dimensions and the connection to the COST jet, as well as the position of the collimators for the optical setups. The red arrows indicate the gas flow direction. 2.1. COST plasma jet The COST micro-scaled atmospheric pressure plasma jet, which is described in detail elsewhere [5], is well characterized a...
-
[3]
Computational methods The two simulations presented use a very similar chemical kinetics scheme, leading to a similar prediction about the species distribution inside the plasma chamber. Only simplified wall reactions were taken into account for the reactive species or, in the case of ozone, were completely neglected. The used wall reaction rates were opt...
-
[4]
Results 4.1. Ozone density The ozone density was studied under varying power, flow rate, and O2 admixture conditions. Experimental results were compared with simulations from both the pseudo-1D plug flow model and the 2D fluid model. The plug flow model focuses on plasma chemistry within the jet and effluent, as illustrated in Figure 4, while the 2D fluid...
-
[5]
Conclusion The aim of this work was the measurement of the excited molecular oxygen species O 2(a1∆g) and O2(b1Σ+ g ) produced within the COST atmospheric pressure plasma jet, supplied with a helium oxygen gas mixture. The experimental results were compared to two simulations to validate the measured values and also to investigate established COST jet mod...
-
[6]
Lu X, Laroussi M and Puech V21034005 ISSN 0963-0252, 1361-6595 URLhttps://iopscience.iop.org/article/ 10.1088/0963-0252/21/3/034005
-
[7]
iop.org/article/10.1088/0963-0252/24/6/064001
Winter J, Brandenburg R and Weltmann K D24064001 ISSN 0963-0252, 1361-6595 URLhttps://iopscience. iop.org/article/10.1088/0963-0252/24/6/064001
-
[8]
Robert E, Sarron V, Ri` es D, Dozias S, Vandamme M and Pouvesle J M21034017 ISSN 0963-0252, 1361- 6595 URLhttps://iopscience.iop.org/article/10. 1088/0963-0252/21/3/034017
Show all 62 references
-
[9]
Sobota A, Guaitella O, Sretenovi´ c G B, Krsti´ c I B, Kovaˇ cevi´ c V V, Obrusn´ ık A, Nguyen Y N, Zaj´ ıˇ ckov´ a L, Obradovi´ c B M and Kuraica M M25065026 ISSN 1361-6595 URLhttps://iopscience.iop.org/article/ 10.1088/0963-0252/25/6/065026
-
[10]
1088/0022-3727/49/8/084003
Golda J, Held J, Redeker B, Konkowski M, Beijer P, Sobota A, Kroesen G, Braithwaite N S J, Reuter S, Turner M M, Gans T, O’Connell D and Schulz- von Der Gathen V49084003 ISSN 0022-3727, 1361- 6463 URLhttps://iopscience.iop.org/article/10. 1088/0022-3727/49/8/084003
-
[11]
iop.org/article/10.1088/1361-6463/aab3ad
Reuter S, Von Woedtke T and Weltmann K D51233001 ISSN 0022-3727, 1361-6463 URLhttps://iopscience. iop.org/article/10.1088/1361-6463/aab3ad
-
[12]
Pawlat J, Terebun P, Kwiatkowski M and Diatczyk J49374001 ISSN 0022-3727, 1361-6463 URL https://iopscience.iop.org/article/10.1088/ 0022-3727/49/37/374001
-
[13]
Shaw D, West A, Bredin J and Wagenaars E25065018 ISSN 1361-6595 URLhttps://iopscience.iop.org/ article/10.1088/0963-0252/25/6/065018
-
[14]
Ichiki T, Taura R and Horiike Y9535– 39 ISSN 0021-8979, 1089-7550 URLhttps: //pubs.aip.org/jap/article/95/1/35/474773/ Localized-and-ultrahigh-rate-etching-of-silicon
-
[15]
1088/0741-3335/49/12B/S39
Benedikt J, Raballand V, Yanguas-Gil A, Focke K and Von Keudell A49B419–B427 ISSN 0741-3335, 1361- 6587 URLhttps://iopscience.iop.org/article/10. 1088/0741-3335/49/12B/S39
-
[16]
Waskoenig J, Niemi K, Knake N, Graham L M, Reuter S, Gathen V S v D and Gans T19045018 ISSN 0963-0252, 1361-6595 URLhttps://iopscience.iop.org/article/ 10.1088/0963-0252/19/4/045018
-
[17]
1088/1361-6595/abbd86
Preissing P, Korolov I, Schulze J, Schulz-von Der Gathen V and B¨ oke M29125001 ISSN 0963-0252, 1361- 6595 URLhttps://iopscience.iop.org/article/10. 1088/1361-6595/abbd86
-
[18]
Bischoff L, H¨ ubner G, Korolov I, Donk´ o Z, Hartmann P, Gans T, Held J, Schulz-von Der Gathen V, Liu Y, Mussenbrock T and Schulze J27125009 ISSN 1361-6595 URLhttps://iopscience.iop.org/article/ 10.1088/1361-6595/aaf35d
-
[19]
org/article/10.1088/0741-3335/54/12/124046
Maleti´ c D, Puaˇ c N, Lazovi´ c S, Malovi´ c G, Gans T, Schulz- von Der Gathen V and Petrovi´ c Z L54124046 ISSN 0741-3335, 1361-6587 URLhttps://iopscience.iop. org/article/10.1088/0741-3335/54/12/124046
-
[20]
1088/1361-6595/abd0e0
Liu Y, Korolov I, Trieschmann J, Steuer D, Schulz-von Der Gathen V, B¨ oke M, Bischoff L, H¨ ubner G, Schulze J and Mussenbrock T30064001 ISSN 0963-0252, 1361- 6595 URLhttps://iopscience.iop.org/article/10. 1088/1361-6595/abd0e0
-
[21]
1088/1361-6463/abd20e
Korolov I, Steuer D, Bischoff L, H¨ ubner G, Liu Y, Schulz-von Der Gathen V, B¨ oke M, Mussenbrock T and Schulze J54125203 ISSN 0022-3727, 1361- 15 6463 URLhttps://iopscience.iop.org/article/10. 1088/1361-6463/abd20e
-
[22]
Graves D B111120–1127 ISSN 1612-8850, 1612-8869 URLhttps://onlinelibrary.wiley.com/doi/10.1002/ ppap.201400068
-
[23]
1186/s13046-018-0909-x
Yang H, Villani R M, Wang H, Simpson M J, Roberts M S, Tang M and Liang X37266 ISSN 1756-9966 URLhttps://jeccr.biomedcentral.com/articles/10. 1186/s13046-018-0909-x
-
[24]
elsevier.com/retrieve/pii/S2213231721002755
Bekeschus S, Von Woedtke T, Emmert S and Schmidt A 46102116 ISSN 22132317 URLhttps://linkinghub. elsevier.com/retrieve/pii/S2213231721002755
-
[25]
Kong M G, Kroesen G, Morfill G, Nosenko T, Shimizu T, Van Dijk J and Zimmermann J L11115012 ISSN 1367-2630 URLhttps://iopscience.iop.org/article/ 10.1088/1367-2630/11/11/115012
-
[26]
1088/0963-0252/21/3/035013
Lazzaroni C, Chabert P, Lieberman M A, Lichtenberg A J and Leblanc A21035013 ISSN 0963-0252, 1361- 6595 URLhttps://iopscience.iop.org/article/10. 1088/0963-0252/21/3/035013
-
[27]
Liu D X, Bruggeman P, Iza F, Rong M Z and Kong M G19025018 ISSN 0963-0252, 1361-6595 URLhttps://iopscience.iop.org/article/10.1088/ 0963-0252/19/2/025018
-
[28]
Schr¨ oter S, Wijaikhum A, Gibson A R, West A, Davies H L, Minesi N, Dedrick J, Wagenaars E, De Oliveira N, Nahon L, Kushner M J, Booth J P, Niemi K, Gans T and O’Connell D2024263–24286 ISSN 1463-9076, 1463-9084 URLhttps://xlink.rsc.org/?DOI=C8CP02473A
-
[29]
1088/1361-6587/aa8fe9
Schr¨ oter S, Gibson A R, Kushner M J, Gans T and O’Connell D60014035 ISSN 0741-3335, 1361- 6587 URLhttps://iopscience.iop.org/article/10. 1088/1361-6587/aa8fe9
-
[30]
1088/0963-0252/23/2/025005
Murakami T, Niemi K, Gans T, O’Connell D and Graham W G23025005 ISSN 0963-0252, 1361- 6595 URLhttps://iopscience.iop.org/article/10. 1088/0963-0252/23/2/025005
-
[31]
1088/0963-0252/22/4/045010
Murakami T, Niemi K, Gans T, O’Connell D and Graham W G22045010 ISSN 0963-0252, 1361- 6595 URLhttps://iopscience.iop.org/article/10. 1088/0963-0252/22/4/045010
-
[32]
1088/0963-0252/22/1/015003
Murakami T, Niemi K, Gans T, O’Connell D and Graham W G22015003 ISSN 0963-0252, 1361- 6595 URLhttps://iopscience.iop.org/article/10. 1088/0963-0252/22/1/015003
-
[33]
Sun B, Liu D, Iza F, Wang S, Yang A, Liu Z, Rong M and Wang X28035006 ISSN 1361-6595 URLhttps://iopscience.iop.org/article/10.1088/ 1361-6595/aaf8e1
-
[34]
Gaens W V and Bogaerts A46275201 ISSN 0022-3727, 1361-6463 URLhttps://iopscience.iop.org/article/ 10.1088/0022-3727/46/27/275201
-
[35]
Gaens W V and Bogaerts A23035015 ISSN 0963-0252, 1361-6595 URLhttps://iopscience.iop.org/article/ 10.1088/0963-0252/23/3/035015
-
[36]
Gaens W V, Bruggeman P J and Bogaerts A16063054 ISSN 1367-2630 URLhttps://iopscience.iop.org/ article/10.1088/1367-2630/16/6/063054
-
[37]
Turner M M24035027 ISSN 0963-0252, 1361-6595 URLhttps://iopscience.iop.org/article/10.1088/ 0963-0252/24/3/035027
-
[38]
iop.org/article/10.1088/1361-6595/aa5c22
Liu D, Sun B, Iza F, Xu D, Wang X, Rong M and Kong M G 26045009 ISSN 1361-6595 URLhttps://iopscience. iop.org/article/10.1088/1361-6595/aa5c22
-
[39]
1088/0963-0252/25/1/015005
Schmidt-Bleker A, Winter J, B¨ osel A, Reuter S and Weltmann K D25015005 ISSN 0963-0252, 1361- 6595 URLhttps://iopscience.iop.org/article/10. 1088/0963-0252/25/1/015005
-
[40]
Schmidt-Bleker A, Winter J, Iseni S, D¨ unnbier M, Weltmann K D and Reuter S47145201 ISSN 0022-3727, 1361-6463 URLhttps://iopscience.iop.org/article/ 10.1088/0022-3727/47/14/145201
-
[41]
Stafford D S and Kushner M J962451– 2465 ISSN 0021-8979, 1089-7550 URLhttps: //pubs.aip.org/jap/article/96/5/2451/906235/ O2-1-production-in-He-O2-mixtures-in-flowing-low
-
[42]
Liu Y, Liu D, Zhang J, Sun B, Yang A and Kong M G 27043512 ISSN 1070-664X, 1089-7674 URLhttps: //pubs.aip.org/pop/article/27/4/043512/318826/ 1D-fluid-model-of-RF-excited-cold-atmospheric
-
[43]
1088/0022-3727/48/44/444002
Kelly S, Golda J, Turner M M and Schulz-von Der Gathen V48444002 ISSN 0022-3727, 1361- 6463 URLhttps://iopscience.iop.org/article/10. 1088/0022-3727/48/44/444002
-
[44]
1088/1361-6595/ac61a9
Viegas P, Slikboer E, Bonaventura Z, Guaitella O, Sobota A and Bourdon A31053001 ISSN 0963-0252, 1361- 6595 URLhttps://iopscience.iop.org/article/10. 1088/1361-6595/ac61a9
-
[45]
Vass M, Schulenberg D, Donk´ o Z, Korolov I, Hartmann P, Schulze J and Mussenbrock T33015012 ISSN 0963-0252, 1361-6595 URLhttps://iopscience.iop.org/article/ 10.1088/1361-6595/ad1f37
-
[46]
Klich M, Wilczek S, Donk´ o Z and Brinkmann R P31045003 ISSN 0963-0252, 1361-6595 URL https://iopscience.iop.org/article/10.1088/ 1361-6595/ac5cd3
-
[47]
1088/0022-3727/44/28/285206
Hemke T, Wollny A, Gebhardt M, Brinkmann R P and Mussenbrock T44285206 ISSN 0022-3727, 1361- 6463 URLhttps://iopscience.iop.org/article/10. 1088/0022-3727/44/28/285206
-
[48]
Golda J, Held J and Gathen V S v D29025014 ISSN 1361-6595 URLhttps://iopscience.iop.org/article/ 10.1088/1361-6595/ab6c81
-
[50]
org/article/10.1088/1361-6595/ac7749
Booth J P, Chatterjee A, Guaitella O, Lopaev D, Zyryanov S, Volynets A, Rakhimova T, Voloshin D, Chukalovsky A, Mankelevich Y and Guerra V31065012 ISSN 0963-0252, 1361-6595 URLhttps://iopscience.iop. org/article/10.1088/1361-6595/ac7749
-
[51]
1088/0022-3727/40/2/R01
Ionin A A, Kochetov I V, Napartovich A P and Yuryshev N N40R25–R61 ISSN 0022-3727, 1361- 6463 URLhttps://iopscience.iop.org/article/10. 1088/0022-3727/40/2/R01
-
[52]
Sousa J S, Bauville G, Lacour B, Puech V, Touzeau M and Pitchford L C93011502 ISSN 0003-6951, 1077-3118 URLhttps:// pubs.aip.org/apl/article/93/1/011502/326841/ O2-a-1g-production-at-atmospheric-pressure-by
-
[53]
Inn E C Y and Tanaka Y 1953Journal of optical society of america43870010 URLhttps://opg.optica.org/ josa/fulltext.cfm?uri=josa-43-10-870&id=50725
-
[54]
He Y, Brinkmann R P, Kemaneci E and Gibson A R 2025 Plasma Sources Science and Technology(to be submitted)
2025
-
[55]
He Y, Preissing P, Steuer D, Klich M, von der Gathen V S, B¨ oke M, Korolov I, Schulze J, Guerra V, Brinkmann R P and Kemaneci E 2021Plasma Sources Science and Technology30105017 URLhttps://dx.doi.org/ 10.1088/1361-6595/ac278d
-
[56]
Chantry P J 1987Journal of Applied Physics621141– 1148 ISSN 0021-8979 (Preprinthttps://pubs.aip.org/ aip/jap/article-pdf/62/4/1141/18611878/1141_1_ online.pdf) URLhttps://doi.org/10.1063/1.339662
-
[57]
del Caz A T, Guerra V, Gon¸ calves D, da Silva M L, Marques L, Pinh˜ ao N, Pintassilgo C D and Alves L L 2019Plasma Sources Science and Technology28043001 URLhttps://doi.org/10.1088%2F1361-6595%2Fab0537 16
-
[58]
Kushner M J95846–859 ISSN 0021-8979, 1089-7550 URL https://pubs.aip.org/jap/article/95/3/846/770991/ Modeling-of-microdischarge-devices-Pyramidal
-
[59]
1088/0022-3727/38/11/001
Kushner M J381633–1643 ISSN 0022-3727, 1361- 6463 URLhttps://iopscience.iop.org/article/10. 1088/0022-3727/38/11/001
-
[60]
org/article/10.1088/1361-6595/acb9b8
Liu Y, Vass M, H¨ ubner G, Schulenberg D, Hemke T, Bischoff L, Chur S, Steuer D, Golda J, B¨ oke M, Schulze J, Korolov I and Mussenbrock T32025012 ISSN 0963-0252, 1361-6595 URLhttps://iopscience.iop. org/article/10.1088/1361-6595/acb9b8
-
[61]
org/article/10.1088/1361-6463/ac09b9
Steuer D, Korolov I, Chur S, Schulze J, Schulz-von Der Gathen V, Golda J and B¨ oke M54355204 ISSN 0022-3727, 1361-6463 URLhttps://iopscience.iop. org/article/10.1088/1361-6463/ac09b9
-
[62]
1088/1361-6595/aa8ebb
Wijaikhum A, Schr¨ oder D, Schr¨ oter S, Gibson A R, Niemi K, Friderich J, Greb A, Schulz-von Der Gathen V, O’Connell D and Gans T26115004 ISSN 1361- 6595 URLhttps://iopscience.iop.org/article/10. 1088/1361-6595/aa8ebb
-
[63]
1007/s11090-023-10370-7
Bang S, Snoeckx R and Cha M S431453–1472 ISSN 0272- 4324, 1572-8986 URLhttps://link.springer.com/10. 1007/s11090-023-10370-7
Reviewed August 15, 2026 · model on record in the stance chip above.
Discussion (0). Continue with ORCID to comment.