REVIEW 4 major objections 4 minor 83 references
ForgetMeNot: Understanding and Modeling the Impact of Forever Chemicals Toward Sustainable Large-Scale Computing
T0 review · 4 major / 4 minor · reviewed 2026-08-15 · deepseek-v4-flash
Pith's one-line read ForgetMeNot: a systems-level model of fluorinated 'forever chemical' emissions in chip manufacturing, claimed accurate to within 5% of real fab emission records.
desk verdict First systems-level tool for fluorinated emissions in computing hardware, with open code and a timely qualitative message, but the 'within 5%' claim is in-sample and needs reframing. read the letter →
The pith
A machine-rendered reading of the paper's core claim, the machinery that carries it, and where it could break.
The reading
What carries the argument
The load-bearing identity is the per-source emission formula $$E_i = N_{\text{Wafers}} \times \text{Usage}_i \times (1-\eta_{\text{Rec}}) \times \text{GWP}_i,$$ summed over twelve sources. $N_{\text{Wafers}}$ is derived geometrically from die area, usable wafer area, wafer diameter, and yield, so that larger dies or lower yields mean more wafers and more emissions. Each source's usage is not a free constant: it is anchored to a reference older-generation component and scaled by node-size exponents ($\alpha$), die area, TDP, package size, and a lithography factor $\phi_{\text{Lith}}$, which is the mechanism that makes EUV lithography less emissive than DUV. The gas recovery factor $\eta_{\text{Rec}}$ (about 0.9 at advanced facilities) appears in every source, which is why the paper treats small improvements in capture as a first-order lever for emission reduction.
What would settle it
A decisive check would be direct process-level metering in one fab for one product line: measuring the mass of each fluorinated gas (NF3, SF6, CF4, C2F6, CHF3, C3F8, C4F8) consumed and captured across etching, chamber cleaning, and lithography, and comparing those source-level quantities to ForgetMeNot's per-source estimates. If the source-level estimates miss the metered values systematically while the facility total still lands within 5%, the model's internal scaling would be falsified even though its headline accuracy survived.
Extended reading notes
Core claim
ForgetMeNot's central claim is that the fluorinated compound emissions of manufacturing a piece of computing hardware can be predicted from a small set of hardware specifications and fab-level parameters, and that the prediction matches what fabrication facilities actually report. The model decomposes the manufacturing pipeline into twelve emission sources—etching, chamber cleaning, photolithography, heat-transfer fluids, solvent fluids, dielectric fluids, wafer thinning, testing, soldering, vacuum pumps, pulsed-plasma nanocoatings, and packaging—and computes each source's contribution as wafers used times per-wafer fluorinated compound usage times the fraction not captured by gas recovery times the global warming potential of the gases involved. Per-wafer usage is scaled from a reference older-generation component using the ratio of node sizes, die-area terms for cores and cache, TDP, package size, and a lithography factor that makes EUV patterning cheaper than DUV. The paper validates the summed model against public facility-level emission records during the production of four real products—a server CPU fabricated in Oregon, a competing CPU fabricated in Dresden, a DRAM module fabricated in Texas, and a solid-state drive fabricated in Idaho—and reports a maximum difference of 4.7% between modeled and reported total emissions. On that basis it claims ForgetMeNot generalizes across different fabrication facilities and hardware types.
Load-bearing premise
The accuracy claim rests on the assumption that public facility-level emission reports, after subtracting a 10-mile-radius neighborhood baseline, truly measure emissions from the specific hardware products being modeled—even though the same reports were used to fit the model's usage coefficients.
Editorial extensions
If this is right
- Smaller manufacturing nodes increase fluorinated emissions: the paper reports a 17.5% rise moving from 10 nm to 7 nm and a further 26.9% rise moving from 7 nm to 5 nm for a high-end server CPU made with EUV lithography.
- Switching from DUV to EUV lithography lowers fluorinated emissions enough that a later CPU generation can have a smaller fluorinated footprint than its predecessor, even as embodied carbon keeps rising.
- DDR5 memory modules have lower fluorinated compound and embodied carbon footprints per gigabyte than DDR4 modules of the same capacity, across multiple vendors.
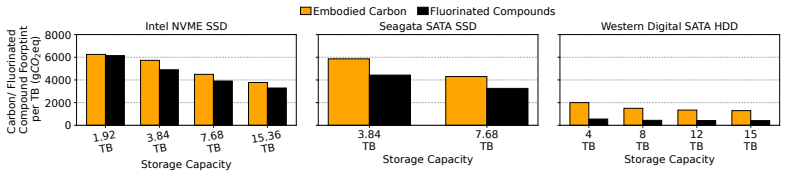
- For storage, per-terabyte fluorinated and carbon footprints fall by roughly 25–40% as capacity increases, and SATA HDDs have substantially lower manufacturing footprints than SSDs.
- Datacenter operators choosing lowest-emission components can cut manufacturing emissions by roughly 51–55% for general-purpose, compute-optimized, and memory-optimized servers compared with median configurations, while the fastest configurations buy about 8.5% more throughput at about 52% more manufacturing emissions in the general-purpose case.
Reading between the lines
- Because the model is calibrated on facility-wide reported totals, its twelve-way breakdown by source is an allocation based on process recipes rather than a direct measurement; the aggregate 5% accuracy does not by itself verify the per-source split.
- The same parameterized structure could be extended to forecast emissions for process changes not yet in production, such as high-NA EUV or new lower-GWP cleaning gases, as long as step-count and reactivity data are available.
- The dependence of optimal hardware choices on the GWP time horizon is a sensitivity worth probing: the paper notes the lowest-emission storage-optimized configuration under a 500-year horizon becomes tenth-lowest under a 20-year horizon, so procurement rankings may shift with climate-policy timeframes.
- If fabs ever publish source-level gas metering, the model's exponents and per-source coefficients could be fitted independently instead of through aggregate totals, turning validation from a single number into twelve testable predictions.
Signed reviews
Editorial analysis
A structured set of objections, weighed in public.
Referee Report
Summary. ForgetMeNot introduces a bottom-up model of fluorinated-compound (PFAS/HFC/etc.) emissions from semiconductor manufacturing for computing hardware. The model decomposes emissions into twelve sources (etching, chamber cleaning, photolithography, heat transfer fluids, solvents, dielectrics, wafer thinning, testing, soldering, vacuum pumps, pulsed-plasma nanocoatings, packaging), with usage per source expressed as base coefficients times die-area/step-count scalings that depend on technology node and lithography type (Table 1). Facility-specific base coefficients are calibrated from EPA TRI facility totals after subtracting a 10-mile-radius neighborhood baseline (Sec. 4.3), and the model is then validated against TRI-derived facility emissions for an Intel CPU, an AMD CPU, Samsung DRAM, and a Micron SSD, with a claimed maximum difference of 4.7% (Sec. 4.4, Fig. 9). The paper then uses the model to compare fluorinated-compound footprints across CPU generations, vendors, DRAM generations, and storage types (Sec. 5), demonstrates fab-level reduction levers (Sec. 4.2), and assembles low-emission server configurations that trade performance against manufacturing emissions (Sec. 6). The artifact is open-sourced at Zenodo.
Significance. If the validation claim were established, ForgetMeNot would be a genuinely useful first systems-level accounting of fluorinated emissions for computing hardware, complementing embodied-carbon tools such as ACT. The paper is also commendable for open-sourcing the tool, for decomposing emissions by manufacturing source, and for showing that including fluorinated compounds can change which hardware is ranked as most sustainable. However, the central accuracy claim currently rests on an in-sample comparison: the same TRI facility totals used to fit the usage coefficients are reused as the validation ground truth. With 26 free parameters and only four facility-level totals, agreement within 4.7% is a goodness-of-fit statement rather than an out-of-sample accuracy result. The load-bearing attribution premise, that a TRI facility total minus a neighborhood baseline equals emissions from the specific modeled hardware, is also unverified. These issues make the headline 'within 5%' claim unsupported as presented, although the modeling framework itself is plausible and worth developing.
major comments (4)
- [Sec. 4.3 vs Sec. 4.4, Fig. 9] The validation is in-sample. Sec. 4.3 derives facility-specific base usage coefficients (kEtch, kClean, kPhoto, etc.) from TRI facility emissions after baseline subtraction, and Sec. 4.4 then compares ForgetMeNot's output with 'the emissions value from the TRI dataset during the time when the hardware being evaluated was being manufactured.' With approximately 26 parameters and only four facility-level totals, a maximum difference of 4.7% does not establish that the model 'captures emissions within 5% of measured values across facilities.' I ask for an out-of-sample evaluation: for example, calibrate on a subset of facilities or years and validate on held-out facilities or years, or compare against independent, facility-reported fluorinated emissions (e.g., GHGRP electronics-manufacturing data) rather than the same TRI records used for calibration.
- [Sec. 4.3, 10-mile baseline; Fig. 9 (left)] The attribution from a facility total to a specific hardware component is not established. A fab typically manufactures many product families and technology nodes simultaneously, and the 10-mile-radius subtraction cannot separate fab process emissions from other local sources or from emissions attributable to other products manufactured in the same facility and time window. Moreover, Fig. 9 (left) labels per-source values as 'Actual Emissions from Fabrication Facility,' but TRI reports facility-level totals, not per-source breakdowns, so the source-level comparison cannot be supported by the cited data. Please provide evidence that the residual TRI value is attributable to the modeled component, or present the validation at the facility level with a clear description of what the TRI residual can and cannot identify.
- [Table 1 and Sec. 4.1] Several load-bearing parameters are hand-set or stated as 'typically' values without uncertainties: all alpha exponents, phi_Lith = 0.8, the 1.25x lower-GWP cleaning-step multiplier, and the base coefficients' typical magnitudes. Because these parameters directly determine the emissions computed for new hardware (and hence all conclusions in Secs. 5 and 6), the paper needs a sensitivity analysis: for example, vary alpha_etch, alpha_clean, alpha_photo, alpha_time, and phi_Lith over plausible ranges and report how the 'within 5%' claim and the server-ranking conclusions change. Without such an analysis, the 5% claim carries no error bars and the qualitative conclusions in Sec. 6 cannot be assessed for robustness.
- [Sec. 4.4 and Fig. 9 (right)] The claim that ForgetMeNot 'can effectively generalize modeling across different fabrication facilities and hardware types' is supported by only four data points (Intel Oregon, AMD Dresden, Samsung Texas, Micron Idaho), each corresponding to a different hardware type and facility. This is too few points to establish generalization, especially because the validation target is also the calibration target. Please report the number of facilities and hardware types, provide per-facility parameter fits and their uncertainties, and, if possible, include more facilities or a temporal hold-out so that the generalization claim is statistically meaningful.
minor comments (4)
- [Fig. 3 and Sec. 2] The sentence in Sec. 2 stating that fluorinated compound emissions have 'consistently been 6 to 7 orders of magnitude higher than embodied carbon emissions' appears inconsistent with Fig. 3, where both quantities are plotted on the same scale in MMTCE; please check the units and the intended comparison.
- [Captions, Figs. 3 and 10] The word 'Foorptint' appears in the captions of Fig. 3 and Fig. 10; it should be 'Footprint.'
- [Sec. 4.2, Fig. 7] The statement that reducing cores from 32 to 22 while increasing cache from 48 MB to 64 MB 'maintains similar performance (0.1 TFLOPs)' is asserted without a benchmark reference or a model; please provide the basis for the performance equivalence or soften the claim.
- [Sec. 4.1, Table 1] The paper would be easier to reproduce if Table 1 (or an appendix) listed the exact numeric values used for each k coefficient, each alpha exponent, phi_Lith, eta_rec, yield, gamma_usable, and the reference-hardware quantities for each of the four validated facilities, rather than only 'typically' values in the text.
Circularity Check
The 'within 5%' validation is in-sample: the TRI facility totals used to determine base usage coefficients in Sec. 4.3 are reused as the ground-truth target in Sec. 4.4.
-
fitted input called prediction
[Section 4.3 methodology and Section 4.4 validation (Eq. 1 and Table 1 usage models)]
"Here, we compare the effectiveness of ForgetMeNot's fluorinated compound emission modeling (Sec. 4.1) by comparing it with the emissions from fabrication facilities (determined via collecting the emissions value from the TRI dataset during the time when the hardware being evaluated was being manufactured, as described in Sec. 4.3)."
Sec. 4.3 states that the base usage coefficients (kEtch, kClean, kPhoto, etc.) are determined from the TRI dataset: 'we use the Toxics Release Inventory (TRI) dataset ... to determine the base usage coefficients by each source.' Sec. 4.4 then validates against the same TRI facility totals from the hardware's manufacturing period. With no temporal holdout, the reported 'maximum difference of 4.7%' is an in-sample goodness-of-fit check, not an out-of-sample prediction. The model is a sum of terms linear in these coefficients, so matching the facility totals is built into the coefficient-determination step.
full rationale
ForgetMeNot's source equations (Eq. 1 and Table 1) are linear in the base usage coefficients, and Sec. 4.3 says these coefficients are determined from facility TRI emissions after subtracting a 10-mile neighborhood baseline. Sec. 4.4 validates the model by comparing it with the same TRI emissions 'during the time when the hardware being evaluated was being manufactured.' The reported 4.7% maximum difference is therefore a statement about how well the coefficient-determination procedure reproduces its own calibration target; it is not an out-of-sample accuracy result. The paper presents no temporal or facility-level holdout, and the fab total cannot be attributed uniquely to the modeled hardware because a fab makes many products and nodes. The scaling exponents and phi_Lith are hand-set 'typical' values without uncertainty, so the 5% claim has no error bars. For these reasons, the central validation claim reduces by construction to the calibration step. The remaining analyses are model extrapolations whose reliability depends on that unvalidated calibration; no independent external benchmark is provided. I do not see any load-bearing self-citation (the main external references are EPA, IPCC, and published fab studies), so the circularity is specifically the fitted-input-called-prediction pattern.
Assumptions & free parameters
free parameters (26)
- k_etch =
0.005 g/mm2/step
- k_clean =
0.003 g/mm2/step
- k_photo =
0.0007 g/mm2/step
- k_HTF =
0.0025 g/hour/W
- k_solv =
0.001 g/mm2/step
- k_dielec =
0.01 g/mm2
- k_thin =
0.0002 g/mm2
- k_test =
0.0001 g/mm2/step
- k_VPS =
0.4 g/step
- k_vacuum =
0.02 g/step
- k_PPNC =
0.0001 g/mm2/step
- k_pack =
0.0002 g/mm2
- alpha_etch =
0.5
- alpha_clean =
0.5
- alpha_photo =
1.0
- alpha_time =
0.5
- alpha_solv =
0.5
- alpha_test =
1.0
- alpha_VPS =
1.0
- alpha_vacuum =
0.8
- alpha_PPNC =
1.0
- phi_lith =
0.8 (EUV); 1.0 (DUV)
- eta_rec =
0.9
- yield =
0.8
- gamma_usable =
0.95
- lower-GWP cleaning step multiplier =
1.25x
assumptions (4)
- domain assumption Total emissions are the sum over sources of N_wafers * Usage_i * (1 - eta_rec) * GWP_i (Eq. 1).
- domain assumption The TRI facility-level emissions minus a 10-mile-radius neighborhood average isolate the fab's fluorinated compound emissions.
- ad hoc to paper Emission source step counts and usage scale as (N_ref / N)^alpha with hand-set exponents alpha, and EUV reduces usage by factor phi_lith=0.8.
- domain assumption The GWP values and compound-to-source mappings in Table 1 from IPCC and EPA accurately represent fab practices.
Cite this review
Pith. "Pith review of ForgetMeNot: Understanding and Modeling the Impact of Forever Chemicals Toward Sustainable Large-Scale Computing." pith.science (2026). https://pith.science/paper/AHXXQ5CK
@misc{pith2026250511236,
  author       = {Pith},
  title        = {Pith review of: ForgetMeNot: Understanding and Modeling the Impact of Forever Chemicals Toward Sustainable Large-Scale Computing},
  year         = {2026},
  howpublished = {\url{https://pith.science/paper/AHXXQ5CK}},
  note         = {Machine review of arXiv:2505.11236}
}
read the original abstract
Fluorinated compounds, often referred to as forever chemicals, are critical in various steps of semiconductor fabrication like lithography, etching, chamber cleaning, and others. Forever chemical emissions can exhibit global warming potentials thousands of times greater than carbon dioxide and persist in the atmosphere for millennia. Despite their severe impact, most sustainability works in computer systems have focused on carbon emissions alone. We address this gap by introducing ForgetMeNot, a modeling tool that quantifies fluorinated compound emissions by integrating fabrication facility-specific practices and hardware specifications, and validate its accuracy using real-world emission data from fabrication facilities. We show how ForgetMeNot can enable fabrication facilities to optimize design and material usage decisions for emission reduction and provide researchers with a methodology to calibrate emission estimates for hardware designs. When ForgetMeNot is applied to analyze emissions for manufacturing CPUs, DRAM, and storage, it illustrates how hardware generations, lithography techniques, and capacities impact fluorinated compound emissions. Finally, we demonstrate how datacenter operators can assemble low-emission servers while balancing performance demands. By factoring in fluorinated emissions into manufacturing decisions, ForgetMeNot paves the way for building more sustainable systems.
Figures


Figures from the paper (10 more)



Reference graph
Works this paper leans on
-
[1]
https://www
9 Key Statistics on New Semiconductor Fabs Being Built Around the World - Z2Data — z2data.com. https://www. z2data.com/insights/9-statistics-on-new-semiconductor-fabs-being-built
-
[2]
https: //www.interface-eu.org/publications/chip-productions-ecological-footprint
Chip Production’s Ecological Footprint: Mapping Climate and Environmental Impact — interface-eu.org. https: //www.interface-eu.org/publications/chip-productions-ecological-footprint
-
[3]
https://eto.tech/dataset-docs/chipexplorer/
Documentation: Advanced Semiconductor Supply Chain Dataset – Emerging Technology Observatory — eto.tech. https://eto.tech/dataset-docs/chipexplorer/
-
[4]
https://www.epa.gov/ghgreporting/ghgrp-electronics- manufacturing
GHGRP Electronics Manufacturing | US EPA — epa.gov. https://www.epa.gov/ghgreporting/ghgrp-electronics- manufacturing
-
[5]
https://github.com/quarterwave0/LithographySimulator
GitHub - quarterwave0/LithographySimulator: A Python-based tool for modeling optical photolithography — github.com. https://github.com/quarterwave0/LithographySimulator
-
[6]
https: //github.com/toUpperCase78/intel-processors
GitHub - toUpperCase78/intel-processors: Datasets for All Processors Maufactured By Intel — github.com. https: //github.com/toUpperCase78/intel-processors
-
[7]
https://chemsec.org/app/uploads/2023/04/Check-your-Tech_230420.pdf
A guide to pfas in electronics. https://chemsec.org/app/uploads/2023/04/Check-your-Tech_230420.pdf
work page 2023
-
[8]
https://ark.intel.com/content/www/us/en/ark.html
Intel product specifications — ark.intel.com. https://ark.intel.com/content/www/us/en/ark.html
Show all 83 references
-
[9]
https://echa.europa.eu/hot-topics/perfluoroalkyl- chemicals-pfas
Per- and polyfluoroalkyl substances (PFAS) - ECHA — echa.europa.eu. https://echa.europa.eu/hot-topics/perfluoroalkyl- chemicals-pfas
-
[10]
https: //www.techinsights.com/sustainability/pfas-semiconductor-manufacturing-major-sustainability-challenge
PFAS in Semiconductor Manufacturing: A Major Sustainability Challenge | TechInsights — techinsights.com. https: //www.techinsights.com/sustainability/pfas-semiconductor-manufacturing-major-sustainability-challenge
-
[11]
https://www.ipcc-nggip.iges.or.jp/public/gp/bgp/ 3_6_PFC_HFC_NF3_SF6_Semiconductor_Manufacturing.pdf
Pfc, hfc, nf3 and sf6 emissions from semiconductor manufacturing. https://www.ipcc-nggip.iges.or.jp/public/gp/bgp/ 3_6_PFC_HFC_NF3_SF6_Semiconductor_Manufacturing.pdf
-
[12]
https://www.epa
Risk Management for Per- and Polyfluoroalkyl Substances (PFAS) under TSCA | US EPA — epa.gov. https://www.epa. gov/assessing-and-managing-chemicals-under-tsca/risk-management-and-polyfluoroalkyl-substances-pfas
-
[13]
https://www.mckinsey.com/ industries/industrials-and-electronics/our-insights/semiconductor-fabs-construction-challenges-in-the-united- states
Semiconductor fabs: Construction challenges in the United States — mckinsey.com. https://www.mckinsey.com/ industries/industrials-and-electronics/our-insights/semiconductor-fabs-construction-challenges-in-the-united- states
-
[14]
https://www.epa.gov/eps-partnership/semiconductor-industry
Semiconductor Industry | US EPA — epa.gov. https://www.epa.gov/eps-partnership/semiconductor-industry
-
[15]
https://www.epa.gov/toxics-release-inventory-tri-program/tri-toolbox
TRI Toolbox | US EPA — epa.gov. https://www.epa.gov/toxics-release-inventory-tri-program/tri-toolbox
-
[16]
https://archive.ics.uci.edu/dataset/179/secom
UCI Machine Learning Repository — archive.ics.uci.edu. https://archive.ics.uci.edu/dataset/179/secom
-
[17]
https://www.semiconductors.org/wp-content/uploads/2023/06/FINAL-Plasma-Etch-and-Deposition-White- Paper.pdf
White paper: Pfas-containing fluorochemicals used in semiconductor manufacturing plasma-enabled etch and depo- sition. https://www.semiconductors.org/wp-content/uploads/2023/06/FINAL-Plasma-Etch-and-Deposition-White- Paper.pdf
2023
-
[18]
Carbon explorer: A holistic framework for designing carbon aware datacenters
Bilge Acun, Benjamin Lee, Fiodar Kazhamiaka, Kiwan Maeng, Udit Gupta, Manoj Chakkaravarthy, David Brooks, and Carole-Jean Wu. Carbon explorer: A holistic framework for designing carbon aware datacenters. In Proceedings of the This work has been accepted at ACM SIGMETRICS 2025,...
2025
-
[19]
Fluorinated gases for semiconductor manufacture: process advances in chemical vapor deposition chamber cleaning
Charles C Allgood. Fluorinated gases for semiconductor manufacture: process advances in chemical vapor deposition chamber cleaning. Journal of fluorine chemistry , 122(1):105–112, 2003
2003
-
[20]
Open-source carbon footprint estimator: Development and university declination
Clément Auger, Benoit Hilloulin, Benjamin Boisserie, Maël Thomas, Quentin Guignard, and Emmanuel Rozière. Open-source carbon footprint estimator: Development and university declination. Sustainability, 13(8):4315, 2021
2021
-
[21]
The sunk carbon fallacy: Rethinking carbon footprint metrics for effective carbon-aware scheduling
Noman Bashir, Varun Gohil, Anagha Belavadi Subramanya, Mohammad Shahrad, David Irwin, Elsa Olivetti, and Christina Delimitrou. The sunk carbon fallacy: Rethinking carbon footprint metrics for effective carbon-aware scheduling. In Proceedings of the 2024 ACM Symposium on Cloud ...
2024
-
[22]
Sustainable computing-without the hot air
Noman Bashir, David Irwin, Prashant Shenoy, and Abel Souza. Sustainable computing-without the hot air. ACM SIGENERGY Energy Informatics Review , 3(3):47–52, 2023
2023
-
[23]
An overview of semiconductor industry efforts to reduce pfas use and emissions in plasma processes
Laurie S Beu and Melissa A Gresham. An overview of semiconductor industry efforts to reduce pfas use and emissions in plasma processes. Advanced Etch Technology and Process Integration for Nanopatterning XIII , 12958:162–166, 2024
2024
-
[24]
Life-cycle assessment of semiconductors
Sarah B Boyd. Life-cycle assessment of semiconductors . Springer Science & Business Media, 2011
2011
-
[25]
The road to net-zero emissions in ic manufacturing
Olga Bubnova. The road to net-zero emissions in ic manufacturing. Nature Reviews Electrical Engineering, 1(4):214–215, 2024
2024
-
[26]
Sf6 and alternatives in electrical switchgear and related equipment
Karsten Burges, Kristina Warncke, and Barbara Gschrey. Sf6 and alternatives in electrical switchgear and related equipment. European Commission Briefing Paper, March 2020
2020
-
[27]
Release of perfluoroalkyl substances from melting glacier of the tibetan plateau: Insights into the impact of global warming on the cycling of emerging pollutants
Mengke Chen, Chuanfei Wang, Xiaoping Wang, Jianjie Fu, Ping Gong, Juping Yan, Zhengliang Yu, Fangping Yan, and Javed Nawab. Release of perfluoroalkyl substances from melting glacier of the tibetan plateau: Insights into the impact of global warming on the cycling of emerging p...
2019
-
[28]
Sf6 usage and emission trends in the tft-lcd industry
Ju-Hsiu Cheng, Scott Bartos, Wei Lee, and Shou-Nan Li. Sf6 usage and emission trends in the tft-lcd industry. International Journal of Greenhouse Gas Control , 17:106–110, 09 2013
2013
-
[29]
Sustainability and the US EPA
National Research Council, Policy, Global Affairs, Technology for Sustainability Program, and Committee on Incorpo- rating Sustainability in the US Environmental Protection Agency. Sustainability and the US EPA . National Academies Press, 2011
2011
-
[30]
Pfc emission reduction in the semiconductor industry
Michael Czerniak. Pfc emission reduction in the semiconductor industry. In Light Metals 2018 , pages 1495–1498. Springer, 2018
2018
-
[31]
Pfas in semiconductor photolithography: a mass balance model
Ralph R Dammel and David E Speed. Pfas in semiconductor photolithography: a mass balance model. In Advances in Patterning Materials and Processes XLI , volume 12957, pages 40–62. SPIE, 2024
2024
-
[32]
Building an aws ec2 carbon emissions dataset
Benjamin Davy. Building an aws ec2 carbon emissions dataset. Medium, September, 2021
2021
-
[33]
The linpack benchmark: past, present and future
Jack J Dongarra, Piotr Luszczek, and Antoine Petitet. The linpack benchmark: past, present and future. Concurrency and Computation: practice and experience , 15(9):803–820, 2003
2003
-
[34]
Kaya for computer architects: Toward sustainable computer systems
Lieven Eeckhout. Kaya for computer architects: Toward sustainable computer systems. IEEE Micro, 43(1):9–18, 2023
2023
-
[35]
Focal: A first-order carbon model to assess processor sustainability
Lieven Eeckhout. Focal: A first-order carbon model to assess processor sustainability. In ACM ASPLOS, pages 401–415, 2024
2024
-
[36]
The environmental impact of forever chemicals in computing systems
Mariam Elgamal, Abdulrahman Mahmoud, Gu-Yeon Wei, David Brooks, and Gage Hills. The environmental impact of forever chemicals in computing systems
-
[37]
Franck, Alise Chachereau, and Juriy Pachin
Christian M. Franck, Alise Chachereau, and Juriy Pachin. Sf6-free gas-insulated switchgear: Current status and future trends. IEEE Electrical Insulation Magazine , 37(1):7–16, 2021
2021
-
[38]
A review on the sources, occurrence and health risks of per-/poly-fluoroalkyl substances (pfas) arising from the manufacture and disposal of electric and electronic products
Shafali Garg, Pankaj Kumar, Vandana Mishra, Rosanne Guijt, Prabhjot Singh, Ludovic F Dumée, and Radhey Shyam Sharma. A review on the sources, occurrence and health risks of per-/poly-fluoroalkyl substances (pfas) arising from the manufacture and disposal of electric and electr...
2020
-
[39]
Ultra-fast aerial image simulation algorithm using wavelength scaling and fast fourier transformation to speed up calculation by more than three orders of magnitude
Tsai-Sheng Gau, Po-Hsiung Chen, Burn J Lin, Fu-Hsiang Ko, Chun-Kung Chen, and Anthony Yen. Ultra-fast aerial image simulation algorithm using wavelength scaling and fast fourier transformation to speed up calculation by more than three orders of magnitude. Journal of Micro/Nan...
2023
-
[40]
Semiconductor manufacturing handbook
Hwaiyu Geng. Semiconductor manufacturing handbook. McGraw-Hill, Inc., 2005
2005
-
[41]
Global Warming Potential Values (August 2024), 2024
GHG Protocol. Global Warming Potential Values (August 2024), 2024
2024
-
[42]
Flexcooldc: Datacenter cooling flexibility for harmonizing water, energy, carbon, and cost trade-offs
Wedan Emmanuel Gnibga, Andrew A Chien, Anne Blavette, and Anne Cécile Orgerie. Flexcooldc: Datacenter cooling flexibility for harmonizing water, energy, carbon, and cost trade-offs. In Proceedings of the 15th ACM International Conference on Future and Sustainable Energy System...
2024
-
[43]
Act: Designing sustainable computer systems with an architectural carbon modeling tool
Udit Gupta, Mariam Elgamal, Gage Hills, Gu-Yeon Wei, Hsien-Hsin S Lee, David Brooks, and Carole-Jean Wu. Act: Designing sustainable computer systems with an architectural carbon modeling tool. In Proceedings of the 49th Annual International Symposium on Computer Architecture ,...
2022
-
[44]
Chasing carbon: The elusive environmental footprint of computing
Udit Gupta, Young Geun Kim, Sylvia Lee, Jordan Tse, Hsien-Hsin S Lee, Gu-Yeon Wei, David Brooks, and Carole-Jean Wu. Chasing carbon: The elusive environmental footprint of computing. In 2021 IEEE International Symposium on This work has been accepted at ACM SIGMETRICS 2025, St...
2021
-
[45]
Going green for less green: Optimizing the cost of reducing cloud carbon emissions
Walid A Hanafy, Qianlin Liang, Noman Bashir, Abel Souza, David Irwin, and Prashant Shenoy. Going green for less green: Optimizing the cost of reducing cloud carbon emissions. In ACM ASPLOS, pages 479–496, 2024
2024
-
[46]
A guide to global warming potentials (gwps)
LD Danny Harvey. A guide to global warming potentials (gwps). Energy Policy, 21(1):24–34, 1993
1993
-
[47]
Environment, safety, health and sustainability, 2023
IEEE International Roadmap for Devices and Systems. Environment, safety, health and sustainability, 2023
2023
-
[48]
Perfluorocompounds emission reduction by the semiconductor industry
Francesca Illuzzi and Harry Thewissen. Perfluorocompounds emission reduction by the semiconductor industry. Journal of Integrative Environmental Sciences , 7(S1):201–210, 2010
2010
-
[49]
Climate Change 2001: The Scientific Basis, 2001
Intergovernmental Panel on Climate Change (IPCC). Climate Change 2001: The Scientific Basis, 2001. Archived from the original on 31 January 2016
2001
-
[50]
Perfluorocarbon emissions reduction programme: Results of the 2018 Anode Effect Survey
International Aluminium Institute. Perfluorocarbon emissions reduction programme: Results of the 2018 Anode Effect Survey. Technical Report, 2019
2018
-
[51]
Ecolife: Carbon-aware serverless function scheduling for sustainable computing
Yankai Jiang, Rohan Basu Roy, Baolin Li, and Devesh Tiwari. Ecolife: Carbon-aware serverless function scheduling for sustainable computing. arXiv preprint arXiv:2409.02085, 2024
2024 arXiv
-
[52]
The semiconductor supply chain: Assessing national competitive- ness
Saif M Khan, Alexander Mann, and Dahlia Peterson. The semiconductor supply chain: Assessing national competitive- ness. Center for Security and Emerging Technology , 8(8):1–98, 2021
2021
-
[53]
D. Koch. Sf6 properties, and use in mv and hv switchgear. Cahier Technique Schneider Electric, (188), 2003
2003
-
[54]
Carbon connect: An ecosystem for sustainable computing
Benjamin C Lee, David Brooks, Arthur van Benthem, Udit Gupta, Gage Hills, Vincent Liu, Benjamin Pierce, Christopher Stewart, Emma Strubell, Gu-Yeon Wei, et al. Carbon connect: An ecosystem for sustainable computing. arXiv preprint arXiv:2405.13858, 2024
2024 arXiv
-
[55]
Toward sustainable hpc: Carbon footprint estimation and environmental implications of hpc systems
Baolin Li, Rohan Basu Roy, Daniel Wang, Siddharth Samsi, Vijay Gadepally, and Devesh Tiwari. Toward sustainable hpc: Carbon footprint estimation and environmental implications of hpc systems. In Proceedings of the International Conference for High Performance Computing, Networ...
2023
-
[56]
thirsty
Pengfei Li, Jianyi Yang, Mohammad A Islam, and Shaolei Ren. Making ai less" thirsty": Uncovering and addressing the secret water footprint of ai models. arXiv preprint arXiv:2304.03271, 2023
2023 arXiv
-
[57]
Digital & environment: How to evaluate server manufacturing footprint, beyond greenhouse gas emissions?, 2021
Romain Lorenzini. Digital & environment: How to evaluate server manufacturing footprint, beyond greenhouse gas emissions?, 2021
2021
-
[58]
Demonstrating gwp*: a means of reporting warming-equivalent emissions that captures the contrasting impacts of short-and long-lived climate pollutants
John Lynch, Michelle Cain, Raymond Pierrehumbert, and Myles Allen. Demonstrating gwp*: a means of reporting warming-equivalent emissions that captures the contrasting impacts of short-and long-lived climate pollutants. Environmental Research Letters, 15(4):044023, 2020
2020
-
[59]
Untangling carbon-free energy attribution and carbon intensity estimation for carbon-aware computing
Diptyaroop Maji, Noman Bashir, David Irwin, Prashant Shenoy, and Ramesh K Sitaraman. Untangling carbon-free energy attribution and carbon intensity estimation for carbon-aware computing. In Proceedings of the 15th ACM International Conference on Future and Sustainable Energy S...
2024
-
[60]
Semiconductor: Supply chain deep dive assessment
Margaret Mann and Vicky Putsche. Semiconductor: Supply chain deep dive assessment. Technical report, USDOE Office of Policy (OP), Washington DC (United States), 2022
2022
-
[61]
Electricity Maps Live 24/7, 2025
Electricity Maps. Electricity Maps Live 24/7, 2025
2025
-
[62]
Semiconductor lithography: principles, practices, and materials
Wayne M Moreau. Semiconductor lithography: principles, practices, and materials . Springer Science & Business Media, 2012
2012
-
[63]
Right to Know Hazardous Substance Fact Sheet: Nitrogen Trifluoride, March 2001
New Jersey Department of Health. Right to Know Hazardous Substance Fact Sheet: Nitrogen Trifluoride, March 2001. Accessed: 2024-11-10
2001
-
[64]
Dry etching technology for semiconductors
Kazuo Nojiri. Dry etching technology for semiconductors . Springer, 2015
2015
-
[65]
2019 refinement to the 2006 ipcc guidelines for national greenhouse gas inventories, 2019
Intergovernmental Panel on Climate Change (IPCC). 2019 refinement to the 2006 ipcc guidelines for national greenhouse gas inventories, 2019
2019
-
[66]
Achieving sustainability in the semiconductor industry: The impact of simulation and ai
Wojciech T Osowiecki, Martyn J Coogans, Saravanapriyan Sriraman, Rakesh Ranjan, Yu Lu, and David M Fried. Achieving sustainability in the semiconductor industry: The impact of simulation and ai. IEEE Transactions on Semiconductor Manufacturing, 2024
2024
-
[67]
GHG emissions of semiconductor manufacturing in 2021
Maxime Pelcat. GHG emissions of semiconductor manufacturing in 2021 . PhD thesis, Univ Rennes, INSA Rennes, CNRS, IETR–UMR 6164, F-35000 Rennes, 2023
2021
-
[68]
Semiconductor manufacturing technology, volume 1
Michael Quirk and Julian Serda. Semiconductor manufacturing technology, volume 1. Prentice Hall Upper Saddle River, NJ, 2001
2001
-
[69]
The chip manufacturing industry: Environmental impacts and eco-efficiency analysis
Marcello Ruberti. The chip manufacturing industry: Environmental impacts and eco-efficiency analysis. Science of the Total Environment, 858:159873, 2023
2023
-
[70]
The carbon footprint of pecvd chamber cleaning using fluorinated gases
Martin Schottler and Mariska de Wild-Scholten. The carbon footprint of pecvd chamber cleaning using fluorinated gases. In Proc. 23rd European Photovoltaic Solar Energy Conference, Valencia, Spain , pages 1–5, 2008
2008
-
[71]
Ecovisor: A virtual energy system for carbon-efficient applications
Abel Souza, Noman Bashir, Jorge Murillo, Walid Hanafy, Qianlin Liang, David Irwin, and Prashant Shenoy. Ecovisor: A virtual energy system for carbon-efficient applications. In Proceedings of the 28th ACM International Conference on Architectural Support for Programming Languag...
2023
-
[72]
Carbon footprint of a dell rack server
Markus Stutz, Scott O’Connell, and John Pflueger. Carbon footprint of a dell rack server. In 2012 Electronics Goes Green 2012+, pages 1–5. IEEE, 2012
2012
-
[73]
Sapatnekar, and Vidya A
Chetan Choppali Sudarshan, Nikhil Matkar, Sarma Vrudhula, Sachin S. Sapatnekar, and Vidya A. Chhabria. ECO-CHIP: Estimation of Carbon Footprint of Chiplet-based Architectures for Sustainable VLSI . In 2024 IEEE International Symposium on High-Performance Computer Architecture ...
2024
-
[74]
On the limitations of carbon- aware temporal and spatial workload shifting in the cloud
Thanathorn Sukprasert, Abel Souza, Noman Bashir, David Irwin, and Prashant Shenoy. On the limitations of carbon- aware temporal and spatial workload shifting in the cloud. In Proceedings of the Nineteenth European Conference on Computer Systems, pages 924–941, 2024
2024
-
[75]
Environmental Protection Agency
U.S. Environmental Protection Agency. PFAS Explained, October 2023
2023
-
[76]
U.S. EPA. Global mitigation of non-CO2 greenhouse gases: 2010-2030. Technical Report, 2013
2010
-
[77]
FabSim, a semiconductor factory (fab) simulator — fabsim.com
Holger Vogt. FabSim, a semiconductor factory (fab) simulator — fabsim.com. http://www.fabsim.com/
-
[78]
A new method to determine the tool count of a semiconductor factory using fabsim
Holger Vogt. A new method to determine the tool count of a semiconductor factory using fabsim. In Proceedings of the 2004 Winter Simulation Conference, 2004. , volume 2, pages 1925–1929. IEEE, 2004
2004
-
[79]
Designing cloud servers for lower carbon
Jaylen Wang, Daniel S Berger, Fiodar Kazhamiaka, Celine Irvene, Chaojie Zhang, Esha Choukse, Kali Frost, Rodrigo Fonseca, Brijesh Warrier, Chetan Bansal, et al. Designing cloud servers for lower carbon. In ACM/IEEE ISCA, pages 452–470, 2024
2024
-
[80]
Designing cloud servers for lower carbon
Jaylen Wang, Daniel S Berger, Fiodar Kazhamiaka, Celine Irvene, Chaojie Zhang, Esha Choukse, Kali Frost, Rodrigo Fonseca, Brijesh Warrier, Chetan Bansal, Jonathan Stern, Ricardo Bianchini, and Akshitha Sriraman. Designing cloud servers for lower carbon. In International Sympos...
2024
-
[81]
List of semiconductor fabrication plants
Wikipedia contributors. List of semiconductor fabrication plants. https://en.wikipedia.org/wiki/List_of_semiconductor_ fabrication_plants
-
[82]
Extreme ultraviolet lithography and three dimensional integrated circuit—a review
Banqiu Wu and Ajay Kumar. Extreme ultraviolet lithography and three dimensional integrated circuit—a review. Applied Physics Reviews, 1(1), 2014
2014
-
[83]
Euv lithography
Stefan Wurm, Winfried Kaiser, Udo Dinger, Stephan Müllender, Bruno La Fontaine, Obert R Wood, and Mark Neisser. Euv lithography. In Microlithography, pages 163–246. CRC Press, 2020. This work has been accepted at ACM SIGMETRICS 2025, Stony Brook, New York, USA
2020
Reviewed August 15, 2026 · model on record in the stance chip above.
Discussion (0). Continue with ORCID to comment.