REVIEW 4 major objections 5 minor 44 references
CATS: Clustering-Aggregated and Time Series for Business Customer Purchase Intention Prediction
T0 review · 4 major / 5 minor · reviewed 2026-08-15 · deepseek-v4-flash
Pith's one-line read Clustering customers by purchase history before forecasting beats seven standard baselines in next-day repurchase prediction.
desk verdict Test-set selection of the cluster count undermines the paper's universal-superiority claim, but the application and ablation are not without merit. read the letter →
The pith
A machine-rendered reading of the paper's core claim, the machinery that carries it, and where it could break.
The reading
What carries the argument
The load-bearing object is the combination of k-shape clustering and per-cluster attention-GRU forecasting. K-shape is a time-series clustering algorithm that uses shape-based distance to group sequences by overall shape rather than pointwise values; this gives the model a grouping prior so that loyal, occasional, and intermediate customers are modeled separately. Within each cluster, a GRU captures temporal dependencies and a multi-head attention layer reweights sequence positions to emphasize recent short-term purchase signals, and binary cross-entropy trains the per-cluster predictors. The clustering step is what carries the claimed advantage: the ablation shows removing it hurts more than removing attention.
What would settle it
Rerun the experiment with the cluster count selected on the validation set only, then evaluate on a test set touched only once; if CAGRU no longer beats LSTM and PatchTST across all five metrics on the four datasets, the paper's central claim is refuted. Reporting per-run variance would also show whether the smallest reported margins are within noise.
Extended reading notes
Core claim
The central discovery is that for next-day repurchase prediction, treating customers as members of behaviorally similar groups before modeling their sequences improves accuracy over modeling the whole customer base at once. CAGRU encodes each customer's daily purchase pattern across shops into a sequence, clusters these sequences with k-shape clustering based on shape-based distance, and then fits a GRU with multi-head attention separately within each cluster. The paper reports that CAGRU beats LSTM, Transformer, Informer, PatchTST, TimesNet, DLinear, and LSTNet on accuracy, AUC, precision, recall, and F1 on all four constructed poultry e-commerce datasets, with the largest gains on the richest dataset. The ablation study attributes more of the improvement to the clustering module than to the attention mechanism.
Load-bearing premise
The comparison assumes that choosing the number of clusters per dataset from test-set performance gives an unbiased estimate of CAGRU's advantage, so if that choice is overfitting the test set the reported universal superiority may not survive a truly held-out evaluation.
Editorial extensions
If this is right
- Any business with long-tailed customer activity data can apply the same cluster-then-forecast recipe to its own purchase logs without changing the underlying sequence model.
- Datasets with richer transaction records should show larger gains, since the paper reports the biggest improvements on CUSTOMER_30K, its largest dataset.
- Recurrent models are a better starting point than transformers for short, sparse purchase sequences; the paper finds LSTM already beats all transformer-based baselines.
- Cluster count should be treated as a dataset-specific hyperparameter, with the best number varying between two and three across the four datasets.
Reading between the lines
- A natural test is to move cluster-count selection onto validation data and keep a fully untouched test set; if the gains shrink, the reported universality is partly test-set tuning.
- The same grouping prior might transfer to churn prediction or subscription renewal, where head-to-tail customer distributions also make single-model forecasts miss rare but valuable segments.
- Reporting variance across repeated runs would clarify whether the reported margins, some as small as 1.1 percent, are stable.
Signed reviews
Editorial analysis
A structured set of objections, weighed in public.
Referee Report
Summary. The paper proposes CAGRU, a model that clusters customers with k-shape time-series clustering and then applies a GRU with an attention mechanism separately to each cluster to predict whether a customer will purchase the next day. The authors construct four proprietary e-commerce datasets from a poultry company and compare CAGRU against seven baselines, reporting that CAGRU outperforms all baselines on all five metrics (Acc, Auc, Precision, Recall, F1Score) on all four datasets. They also include ablation studies of the clustering and attention components and a parameter analysis of the number of clusters. The central empirical claim is that the full model is universally superior to the baselines.
Significance. If the reported superiority were properly established, CAGRU would offer a practically useful and conceptually interesting approach to next-day purchase prediction in sparse, head-to-tail customer data. The clustering-then-forecast architecture is well motivated, and the ablation study separating the contributions of clustering and attention is a good practice. However, the manuscript as written does not provide reliable evidence for the headline claim because the number of clusters is selected per dataset using test-set performance, no uncertainty quantification is given, and the evaluation threshold depends on the test-label distribution. These limitations are central to the empirical contribution, so the significance of the paper in its current form is substantially reduced.
major comments (4)
- [§5.2.1, §5.4, Table 2, Figure 8] The number of clusters n is selected per dataset based on test-set performance. Section 5.2.1 states that 'a different number of clustering clusters are used for each dataset for the best result,' and Section 5.4 explicitly chooses n=2 for three datasets and n=3 for CUSTOMER_30K from Figure 8, which plots test metrics. This gives CAGRU an additional selection degree of freedom that the baselines do not receive, so the reported test metrics in Table 2 are the best of several test-set draws and are upwardly biased estimates of out-of-sample performance. The headline statement in Section 5.2.2 that CAGRU 'outperforms all the baseline methods on all five metrics on these four datasets, which proves the validity of the model' is therefore not supported. Please select n on a validation set (or apply nested cross-validation) and report results for the chosen configuration, along with results for all candidate n.
- [Table 2, Figures 7 and 8] No error bars or significance tests are reported. Table 2, Figure 7, and Figure 8 present single-run metric values without standard deviations, confidence intervals, or statistical tests. Without repeated runs or significance testing, the observed improvements (e.g., 1-5% in Acc, up to 11% in F1 on CUSTOMER_30K) cannot be distinguished from noise, and the multi-selection issue in Section 5.4 makes the variance even more relevant. Please report means and standard deviations over several random seeds and include a paired significance test (e.g., paired bootstrap or Wilcoxon test) for the comparison against each baseline.
- [§5.1.2] The decision threshold uses test-label information. Section 5.1.2 defines the top-N threshold as N=0.3 'based on the average proportion of positive and negative samples in the dataset,' which uses the test-label distribution to binarize predictions. Although this rule is applied to all methods, it is a label leak and should be derived from the training or validation set only. If the baselines were originally designed with a 0.5 threshold or a different calibration procedure, treating all methods under this test-informed threshold may also distort relative performance. Please set the threshold from training/validation prevalence and report whether the results are sensitive to this choice.
- [§5.2.1] The baseline tuning is asymmetric with CAGRU. Section 5.2.1 states that for the baselines 'we follow the defaults suggested by the authors,' while CAGRU receives a per-dataset cluster count tuned on the test set. This is not a fair comparison setup: hyperparameters should be tuned for all methods under the same protocol (e.g., validation-based selection). Please either tune baselines on validation or explicitly report the hyperparameter settings used for each method so the comparison is apples-to-apples.
minor comments (5)
- [§5.4] There is a typo 'CUSTPOMER_30K' that should be 'CUSTOMER_30K'.
- [Eq. (10)] The symbol PE_{i,j} is reused for both the raw positional embedding and its decayed version; please use a different symbol or an explicit assignment to avoid confusion.
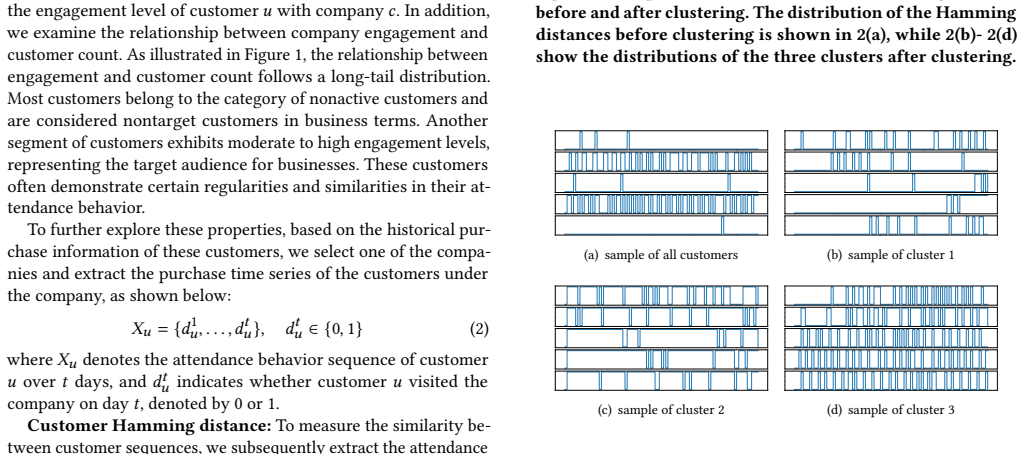
- [§3 vs. §4.2.2] Section 3 uses k-means clustering with n=3 for the exploratory analysis, while the model in Section 4.2.2 uses k-shape clustering; the relationship between these two clustering choices is not explained.
- [Figures 7 and 8] The bar and line plots appear to show a single run; the captions should state the number of repeated runs and include error bars or variance information.
- [§1, §4.3.1] The paper repeatedly describes the data as 'multi-modal,' but the features described in Section 4.3.1 appear to be limited to customer attributes, company attributes, and binary purchase indicators; please clarify what constitutes the distinct modalities.
Circularity Check
The universal-superiority claim is partly constructed: the per-dataset cluster count n is selected using the same test metrics that are then reported as CAGRU's advantage, without equivalent tuning for baselines.
-
fitted input called prediction
[Section 5.2.1 (Baselines and Settings); Section 5.4 (Parameter Analysis); Table 2]
"In our model, a different number of clustering clusters are used for each dataset for the best result ... We keep all other parameters constant and run CAGRU on the four datasets, varying the range of n to {2, 3, 4, 5}. Figure 8 shows the impact of different cluster numbers on the metrics of each dataset. Except for CUSTPOMER_30K, the other three datasets all achieve the best results at n = 2 ... The best results were achieved on the largest CUSTOMER_30K on n = 3."
Section 5.1.1 states that "the test set is used for performance comparison". Section 5.4 therefore tunes the per-dataset cluster count n on the test metrics shown in Figure 8, and Section 5.2.1 acknowledges that a different n is used "for the best result" on each dataset. Table 2 then reports those selected test metrics and Section 5.2.2 uses them to conclude that the CAGRU model "outperforms all the baseline methods on all five metrics on these four datasets, which proves the validity of the model." CAGRU is effectively evaluated as the best of four test-set configurations (n=2..5), while each baseline is run once with "the defaults suggested by the authors" and receives no equivalent per-dataset test-set selection.
full rationale
The core derivation of the CAGRU architecture (k-shape clustering, GRU, attention, BCE loss) is self-contained and does not reduce to its inputs; there are no self-citation or uniqueness-theorem issues, and the model equations are not definitionally circular. However, the paper's central empirical claim is weakened by a test-set selection loop: the cluster count n is chosen per dataset after looking at the same test metrics that are later reported as evidence of superiority, and baselines are not given an equivalent tuning step. This makes the headline "outperforms all baselines on all five metrics" a partially constructed result rather than a clean prediction. The threshold rule in Sec. 5.1.2 also uses the label proportion of the dataset to define the top-30% cutoff, but it is applied identically to all methods and therefore does not itself manufacture CAGRU's advantage.
Assumptions & free parameters
free parameters (3)
- Number of clusters n =
2 or 3, chosen per dataset for best test result; exact per-dataset values not stated
- Temporal decay factor alpha =
not reported
- Decision threshold (top-N fraction) =
0.3
assumptions (3)
- domain assumption k-shape clustering on encoded purchase sequences yields meaningful customer segments.
- domain assumption Binary daily attendance over company shops is a sufficient representation of customer behavior for next-day purchase prediction.
- standard math Standard GRU, attention, and BCE loss behave as specified.
Cite this review
Pith. "Pith review of CATS: Clustering-Aggregated and Time Series for Business Customer Purchase Intention Prediction." pith.science (2026). https://pith.science/paper/NBXSRLLI
@misc{pith2026250513558,
  author       = {Pith},
  title        = {Pith review of: CATS: Clustering-Aggregated and Time Series for Business Customer Purchase Intention Prediction},
  year         = {2026},
  howpublished = {\url{https://pith.science/paper/NBXSRLLI}},
  note         = {Machine review of arXiv:2505.13558}
}
read the original abstract
Accurately predicting customers' purchase intentions is critical to the success of a business strategy. Current researches mainly focus on analyzing the specific types of products that customers are likely to purchase in the future, little attention has been paid to the critical factor of whether customers will engage in repurchase behavior. Predicting whether a customer will make the next purchase is a classic time series forecasting task. However, in real-world purchasing behavior, customer groups typically exhibit imbalance - i.e., there are a large number of occasional buyers and a small number of loyal customers. This head-to-tail distribution makes traditional time series forecasting methods face certain limitations when dealing with such problems. To address the above challenges, this paper proposes a unified Clustering and Attention mechanism GRU model (CAGRU) that leverages multi-modal data for customer purchase intention prediction. The framework first performs customer profiling with respect to the customer characteristics and clusters the customers to delineate the different customer clusters that contain similar features. Then, the time series features of different customer clusters are extracted by GRU neural network and an attention mechanism is introduced to capture the significance of sequence locations. Furthermore, to mitigate the head-to-tail distribution of customer segments, we train the model separately for each customer segment, to adapt and capture more accurately the differences in behavioral characteristics between different customer segments, as well as the similar characteristics of the customers within the same customer segment. We constructed four datasets and conducted extensive experiments to demonstrate the superiority of the proposed CAGRU approach.
Figures


Figures from the paper (4 more)


Reference graph
Works this paper leans on
-
[36]
Kasun Bandara, Christoph Bergmeir, and Slawek Smyl. 2020. Forecasting across time series databases using recurrent neural networks on groups of similar series: A clustering approach. Expert systems with applications 140 (2020), 112896
work page 2020
-
[1]
Xiong Luo, Changwei Jiang, Weiping Wang, Yang Xu, Jenq-Haur Wang, and Wenbing Zhao. 2019. User behavior prediction in social networks using weighted extreme learning machine with distribution optimization. Future Generation Computer Systems 93 (2019), 1023–1035
work page 2019
-
[2]
Vibhava Srivastava, Deva Rangarajan, and Vishag Badrinarayanan. 2023. Cus- tomer equity drivers and repurchase intent among B2B customers: the moderat- ing role of perceived switching cost. Journal of Business & Industrial Marketing (2023)
work page 2023
-
[3]
I Artana, Hartina Fattah, IGJE Putra, N Sariani, M Nadir, A Asnawati, and R Ris- mawati. 2022. Repurchase intention behavior in B2C E-commerce. International Journal of Data and Network Science 6, 1 (2022), 147–154
work page 2022
-
[4]
Lars Meyer-Waarden. 2008. The influence of loyalty programme membership on customer purchase behaviour. European Journal of marketing 42, 1/2 (2008), 87–114
work page 2008
-
[5]
Rex P Bringula, Shirley D Moraga, Annaliza E Catacutan, Marilou N Jamis, and Dionito F Mangao. 2018. Factors influencing online purchase intention of smartphones: A hierarchical regression analysis. Cogent Business & Management 5, 1 (2018), 1496612
work page 2018
-
[6]
Sujoy Bag, Manoj Kumar Tiwari, and Felix TS Chan. 2019. Predicting the con- sumer’s purchase intention of durable goods: An attribute-level analysis. Journal of Business Research 94 (2019), 408–419
work page 2019
-
[7]
G Saranya, N Gopinath, G Geetha, K Meenakshi, and M Nithya. 2020. Prediction of Customer Purchase Intention Using Linear Support Vector Machine in Digital Marketing. In Journal of Physics: Conference Series . IOP Publishing, 012024
work page 2020
Show all 44 references
-
[8]
Ramazan Esmeli, Mohamed Bader-El-Den, and Hassana Abdullahi. 2021. Towards early purchase intention prediction in online session based retailing systems. Electronic Markets 31, 3 (2021), 697–715
2021
-
[9]
Iftakhar Ali Khandokar, AKM Muzahidul Islam, Salekul Islam, Swakkhar Shatabda, et al . 2023. A gradient boosting classifier for purchase intention prediction of online shoppers. Heliyon 9, 4 (2023)
2023
-
[10]
Yanan Liu, Yun Tian, Yang Xu, Shifeng Zhao, Yapei Huang, Yachun Fan, Fuqing Duan, and Ping Guo. 2021. TPGN: a time-preference gate network for e-commerce purchase intention recognition. Knowledge-Based Systems 220 (2021), 106920. CATS: Clustering-Aggregated and Time Series for...
2021
-
[11]
Chao Huang, Jiashu Zhao, and Dawei Yin. 2021. Purchase intent forecasting with convolutional hierarchical transformer networks. In 2021 IEEE 37th International Conference on Data Engineering (ICDE) . IEEE, 2488–2498
2021
-
[12]
Neha Chaudhuri, Gaurav Gupta, Vallurupalli Vamsi, and Indranil Bose. 2021. On the platform but will they buy? Predicting customers’ purchase behavior using deep learning. Decision Support Systems 149 (2021), 113622
2021
-
[13]
Asad Khattak, Anam Habib, Muhammad Zubair Asghar, Fazli Subhan, Imran Razzak, and Ammara Habib. 2021. Applying deep neural networks for user intention identification. Soft Computing 25 (2021), 2191–2220
2021
-
[14]
Cheng-Ju Liu, Tien-Shou Huang, Ping-Tsan Ho, Jui-Chan Huang, and Ching-Tang Hsieh. 2020. Machine learning-based e-commerce platform repurchase customer prediction model. Plos one 15, 12 (2020), e0243105
2020
-
[15]
Liping Yang, Xiaxia Niu, and Jun Wu. 2021. RF-LighGBM: A probabilistic ensem- ble way to predict customer repurchase behaviour in community e-commerce. arXiv preprint arXiv:2109.00724 (2021)
2021 arXiv
-
[16]
Md Shahriare Satu and Syed Faridul Islam. 2023. Modeling online customer pur- chase intention behavior applying different feature engineering and classification techniques. Discover Artificial Intelligence 3, 1 (2023), 36
2023
-
[17]
Chen Ling, Tao Zhang, and Yuan Chen. 2019. Customer purchase intent predic- tion under online multi-channel promotion: A feature-combined deep learning framework. IEEE Access 7 (2019), 112963–112976
2019
-
[18]
Jina Kim, HongGeun Ji, Soyoung Oh, Syjung Hwang, Eunil Park, and Angel P del Pobil. 2021. A deep hybrid learning model for customer repurchase behavior. Journal of Retailing and Consumer Services 59 (2021), 102381
2021
-
[19]
François Petitjean, Alain Ketterlin, and Pierre Gançarski. 2011. A global averaging method for dynamic time warping, with applications to clustering. Pattern recognition 44, 3 (2011), 678–693
2011
-
[20]
John Paparrizos and Luis Gravano. 2015. k-shape: Efficient and accurate clustering of time series. In Proceedings of the 2015 ACM SIGMOD international conference on management of data . 1855–1870
2015
-
[21]
Stuart Lloyd. 1982. Least squares quantization in PCM. IEEE transactions on information theory 28, 2 (1982), 129–137
1982
-
[22]
Lihua Zhou, Guowang Du, Dapeng Tao, Hongmei Chen, Jun Cheng, and Libo Gong. 2018. Clustering Multivariate Time Series Data via Multi-Nonnegative Matrix Factorization in Multi-Relational Networks. IEEE Access 6 (2018), 74747– 74761
2018
-
[23]
Guowang Du, Lihua Zhou, Lizhen Wang, and Hongmei Chen. 2018. Multivariate time series clustering via multi-relational community detection in networks. In Web and Big Data: Second International Joint Conference, APWeb-W AIM 2018, Macau, China, July 23-25, 2018, Proceedings, Par...
2018
-
[24]
Jianning Liang and Yan Zhou. 2017. Clustering multivariate time series from large sensor networks. In 2017 International Conference on Computer Systems, Electronics and Control (ICCSEC) . IEEE, 563–567
2017
-
[25]
Iago Vaquez, JoseR Villar, Javier Sedano, and Svetlana Simic. 2020. A preliminary study on multivariate time series clustering. In 14th International Conference on Soft Computing Models in Industrial and Environmental Applications (SOCO 2019) Seville, Spain, May 13–15, 2019, P...
2020
-
[26]
Xiaojun Yang, Tuoji Zhu, Danyang Wu, Penglei Wang, Yujia Liu, and Feiping Nie. 2024. Bidirectional Fusion With Cross-View Graph Filter for Multi-View Clustering. IEEE Transactions on Knowledge and Data Engineering (2024)
2024
-
[27]
Dino Ienco and Roberto Interdonato. 2020. Deep multivariate time series em- bedding clustering via attentive-gated autoencoder. In Advances in Knowledge Discovery and Data Mining: 24th Pacific-Asia Conference, PAKDD 2020, Singapore, May 11–14, 2020, Proceedings, Part I 24 . Sp...
2020
-
[28]
Sepp Hochreiter and Jürgen Schmidhuber. 1997. Long short-term memory.Neural computation 9, 8 (1997), 1735–1780
1997
-
[29]
Junyoung Chung, Caglar Gulcehre, KyungHyun Cho, and Yoshua Bengio. 2014. Empirical evaluation of gated recurrent neural networks on sequence modeling. arXiv preprint arXiv:1412.3555 (2014)
2014 arXiv
-
[30]
Shaojie Bai, J Zico Kolter, and Vladlen Koltun. 2018. An empirical evaluation of generic convolutional and recurrent networks for sequence modeling. arXiv preprint arXiv:1803.01271 (2018)
2018 arXiv
-
[31]
Jean-Yves Franceschi, Aymeric Dieuleveut, and Martin Jaggi. 2019. Unsupervised scalable representation learning for multivariate time series. Advances in neural information processing systems 32 (2019)
2019
-
[32]
Vijay Ekambaram, Arindam Jati, Nam Nguyen, Phanwadee Sinthong, and Jayant Kalagnanam. 2023. Tsmixer: Lightweight mlp-mixer model for multivariate time series forecasting. In Proceedings of the 29th ACM SIGKDD Conference on Knowledge Discovery and Data Mining . 459–469
2023
-
[33]
Abhimanyu Das, Weihao Kong, Andrew Leach, Shaan Mathur, Rajat Sen, and Rose Yu. 2023. Long-term forecasting with tide: Time-series dense encoder.arXiv preprint arXiv:2304.08424 (2023)
2023 arXiv
-
[34]
Yunhao Zhang and Junchi Yan. 2022. Crossformer: Transformer utilizing cross- dimension dependency for multivariate time series forecasting. In The eleventh international conference on learning representations
2022
-
[35]
Haoyi Zhou, Shanghang Zhang, Jieqi Peng, Shuai Zhang, Jianxin Li, Hui Xiong, and Wancai Zhang. 2021. Informer: Beyond efficient transformer for long se- quence time-series forecasting. In Proceedings of the AAAI conference on artificial intelligence. 11106–11115
2021
-
[37]
Priyanka E Bhaskaran, Maheswari Chennippan, and Thangavel Subramaniam
-
[38]
Hanlin Zhu, Yongxin Zhu, Di Wu, Hui Wang, Li Tian, Wei Mao, Can Feng, Xiaowen Zha, Guobao Deng, Jiayi Chen, et al . 2018. Correlation coefficient based cluster data preprocessing and LSTM prediction model for time series data in large aircraft test flights. In Smart Computing ...
2018
-
[39]
Yuqi Nie, Nam H Nguyen, Phanwadee Sinthong, and Jayant Kalagnanam. 2022. A time series is worth 64 words: Long-term forecasting with transformers. arXiv preprint arXiv:2211.14730 (2022)
2022 arXiv
-
[40]
Ashish Vaswani, Noam Shazeer, Niki Parmar, Jakob Uszkoreit, Llion Jones, Aidan N Gomez, Łukasz Kaiser, and Illia Polosukhin. 2017. Attention is all you need. Advances in neural information processing systems 30 (2017)
2017
-
[41]
Ailing Zeng, Muxi Chen, Lei Zhang, and Qiang Xu. 2023. Are transformers effective for time series forecasting?. In Proceedings of the AAAI conference on artificial intelligence. 11121–11128
2023
-
[42]
Haixu Wu, Tengge Hu, Yong Liu, Hang Zhou, Jianmin Wang, and Mingsheng Long. 2022. Timesnet: Temporal 2d-variation modeling for general time series analysis. arXiv preprint arXiv:2210.02186 (2022)
2022 arXiv
-
[43]
Guokun Lai, Wei-Cheng Chang, Yiming Yang, and Hanxiao Liu. 2018. Modeling long-and short-term temporal patterns with deep neural networks. In The 41st international ACM SIGIR conference on research & development in information retrieval. 95–104
2018
-
[2020]
Journal of Loss Prevention in the Process Industries 66 (2020), 104203
Future prediction & estimation of faults occurrences in oil pipelines by using data clustering with time series forecasting. Journal of Loss Prevention in the Process Industries 66 (2020), 104203
2020
Reviewed August 15, 2026 · model on record in the stance chip above.
Discussion (0). Continue with ORCID to comment.