REVIEW 4 major objections 5 minor 40 references
Classifying metal-poor stars with machine learning using nucleosynthesis calculations
T0 review · 4 major / 5 minor · reviewed 2026-08-07 · deepseek-v4-flash
Pith's one-line read A machine-learning model trained only on simulated nucleosynthesis patterns matches the conventional enrichment labels of metal-poor stars 87% of the time and flags several stars whose labels it would reassign to a different origin process.
desk verdict A genuinely new proof-of-principle for ML-based stellar enrichment classification, undercut by an undefined aggregation rule that makes the 87% headline non-reproducible. read the letter →
The pith
A machine-rendered reading of the paper's core claim, the machinery that carries it, and where it could break.
The reading
What carries the argument
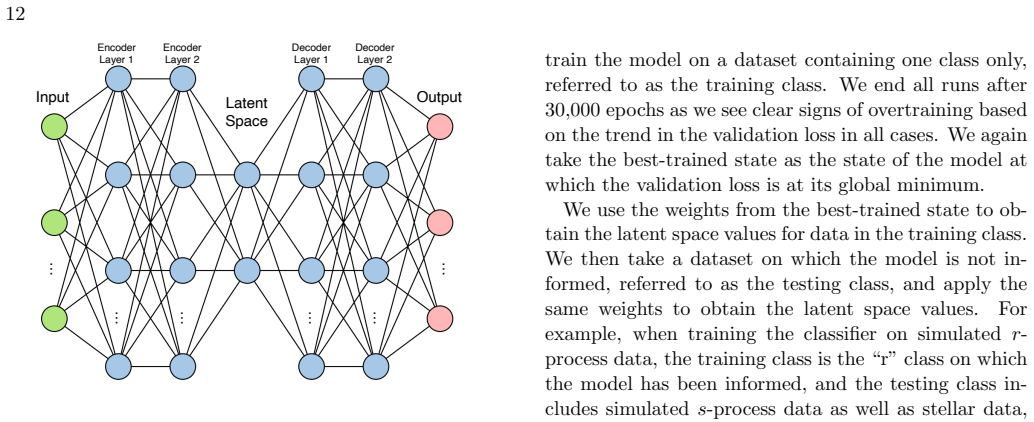
The central machinery is a pair of neural-network classifiers: a binary classifier (a shallow fully connected network with one hidden layer) that separates r-process from s-process simulation patterns, and one-class autoencoders with a two-dimensional latent space whose cluster geometry, bounded by a one-class support vector machine, shows whether an unseen star's abundance pattern falls inside the r or s region. The features are nine observed elemental abundances (Ba, La, Ce, Pr, Nd, Sm, Eu, Dy, Er, or with Pb in place of Er), each normalized to Eu. The latent space carries the argument: it provides both a classification and a visual measure of how close a star lies to a process's simulation cluster, which is how the paper spots borderline and possibly mislabeled stars.
What would settle it
Measure the third-peak elements Ir and Pt in the stars the ML reassigned—HE1405-0822, SDSSJ091243.72+021623.7, HE0414-0343, HE2258-6358, CS22947-187, SDSSJ103649.93+121219.8, and CS31062-050—and check whether the resulting patterns match the ML-assigned class or the original JINAbase label; if they match the original labels, the ML reassignments fail.
Extended reading notes
Core claim
The paper's central claim is that a machine-learning classifier fed only with simulated abundance patterns can reproduce, and in a few cases overrule, the conventional enrichment classifications of metal-poor stars. After training on 187 s-process and 188 r-process simulation patterns, the binary and one-class classifiers assign stellar abundance patterns to r or s groups; the overall assignments agree with the JINAbase labels for 33 of 38 stars (about 87%). The network disagrees with the database for five stars: HE0414-0343, HE2258-6358, CS22947-187, and CS31062-050 are labeled s but assigned to r, while SDSSJ103649.93+121219.8 is labeled r but assigned to s. For the stars currently labeled i, the ML assigns HE1405-0822 to r and SDSSJ091243.72+021623.7 to s, while HE2148-1247 falls outside both the r and s regions in latent space. The authors read the disagreements as evidence that the current abundance-ratio thresholds can miss pattern information that the simulation-trained networks capture, while also cautioning that without third-peak (Ir, Pt) data some i-process stars could be confused with r-process stars.
Load-bearing premise
The simulated r-, s-, and i-process abundance patterns used for training span the real diversity of metal-poor stellar enrichment, and the nine observed elements (which omit the r-process third peak, Ir and Pt) are enough to tell the processes apart on real stars.
Editorial extensions
If this is right
- The 87% agreement indicates that theoretical simulation banks encode much of the same pattern information as the empirical abundance-ratio criteria, so simulation-trained ML can serve as an independent check on stellar classification labels.
- The four s-labeled stars the ML reassigns to r (HE0414-0343, HE2258-6358, CS22947-187, CS31062-050) become concrete follow-up targets; one confirming observation would show the threshold method misses information.
- The r-labeled star SDSSJ103649.93+121219.8 that the ML assigns to s warns that r-process labels based solely on [Eu/Fe] and [Ba/Eu] may include stars that simulation patterns place elsewhere.
- The i-process assignments are the most fragile: with no third-peak data, HE1405-0822 being placed in r and SDSSJ091243.72+021623.7 in s shows that current i labels based on lanthanide and lead ratios are not unique.
- Swapping Er for Pb as a training feature changes some individual star assignments, so the method's output depends on the observable feature set; this motivates richer abundance measurements rather than weaker conclusions.
Reading between the lines
- The ML assignment is a statement of pattern similarity in the chosen 9-element space, not a physical identification of the nucleosynthesis site; a star placed in the r cluster could still have been enriched by a different process whose simulated ratios overlap in these elements.
- The 87% agreement rate partly reflects how well the curated simulation bank separates in the chosen feature space—trajectories were preselected to produce a main r process only in the atomic-number range 54 to 83—so the headline number is not purely a property of the stars.
- A natural next experiment the paper leaves implicit is to train the same autoencoder on a large grid of i-process simulations; the latent space would reveal whether 'i' is a genuinely distinct cluster or a bridge between r and s, and could turn the i reassignments into testable predictions.
- Because star 28 (HE2148-1247) falls outside both the r and s decision boundaries, the one-class latent space can act as an anomaly detector: stars that belong to no trained class are exactly the candidates for unknown processes or measurement errors, which the authors touch on but do not develop.
Editorial analysis
A structured set of objections, weighed in public.
Referee Report
Summary. The paper trains binary and one-class machine-learning classifiers on theoretical r-process and s-process nucleosynthesis abundance patterns, then applies them to metal-poor stars from JINAbase. Feature sets comprise nine elements (Ba, La, Ce, Pr, Nd, Sm, Eu, Dy, Er or Pb), and the classifiers are trained without any information about the stars' database classifications. The central quantitative claim is that, after training on simulated r/s patterns, the ML 'overall' stellar assignments match JINAbase labels 87% of the time (33/38 stars, Table 1). The paper further examines five JINAbase i-process stars with one-class classifiers and suggests that some are more consistent with r or s enrichment, while also noting that several s stars may be i-process candidates.
Significance. If the headline agreement rate were well-defined and reproducible, this would be a useful exploratory demonstration that simulated nucleosynthesis patterns can serve as training data for stellar enrichment classification, complementing the elemental-ratio thresholds of JINAbase. The paper has clear strengths: it uses diverse public simulation banks (Monash, FRUITY, Radice, Just), explicitly tests the Er-versus-Pb feature set choice, and is careful to keep the ML models blind to JINAbase labels. It also contains unusually honest caveats, especially in Section 6 about the absence of third r-process peak elements. However, the 87% claim is currently not reproducible because the 'overall ML classification' is not a defined algorithm, and the i-process reclassifications rest on feature sets that cannot distinguish r from i for stars lacking Ir/Pt. These issues are load-bearing for the main claims but are fixable within the scope of the manuscript.
major comments (4)
- [Sec. 5, Table 1] The 87% agreement (33/38) is computed from an 'overall ML classification' that is obtained by informally looking across each row of Table 1. The table combines BC-L/BC-S at minimal and maximal separation, Er and Pb feature sets, and OCC-L/OCC-S trained on r or s; many cells are missing ('-') because a star lacks Er or Pb. No voting rule, weighting, or tie-breaking procedure is defined, so the overall label is not reproducible. For example, a simple majority vote over the available configurations would not obviously produce the same five disagreements listed in the text, and the i-process '?' entries in Table 2 are likewise undefined. The authors should specify a fixed aggregation rule (e.g., majority vote with a stated treatment of ties and missing features) and recompute the agreement rate, or clearly report the per-method agreement ranges instead of a single percentage.
- [Sec. 2 and Sec. 6] The training bank and feature set do not support the i-process reclassifications and weaken the r/s claim on real stellar data. The r-process bank is restricted to trajectories that 'produce a main r process between Z=54 to 83 and A=120 to 210', and the nine-element feature set excludes Ir and Pt. The paper itself states in Sec. 6 that 'Without third-peak information, some i-process stars with only lanthanide and lead observations could well match some r-process calculation ratios', and Table 2 notes that none of the i stars report abundances between Z=73 and 81. Consequently, the assignments of stars 20, 27, 28, 30, and 41 to r or s (or to '?' for star 28) cannot be distinguished from an r-process interpretation. The authors should either include third-peak features where available or explicitly reframe the i-process section as a sensitivity demonstration rather than a claim about the true origins of these stars.
- [Sec. 4 and Appendix (One-class classification)] The SVM decision boundary that defines in-class versus out-of-class for the OCC models is not constructed by a reproducible rule. The text says the hyperparameters (RBF kernel coefficient and the upper bound on training errors) are adjusted so that the boundary 'encloses as many points from the training data as possible whilst still being smooth and continuous.' There is no quantitative criterion given, so different practitioners could draw different boundaries and obtain different in/out labels for the same stars, changing the OCC entries in Tables 1 and 2. A cross-validated criterion (e.g., boundary error on a held-out portion of the training class, or a fixed quantile of the latent-space distance) should be stated, or the OCC results should be treated as illustrative rather than as part of the quantitative agreement rate.
- [Sec. 3, minimal vs. maximal separation] The binary-classifier protocol uses two training states ('minimal separation' and 'maximal separation'), and after complete separation the threshold is taken as the average of the minimal and maximal eligible thresholds along the ROC curve, yielding 0.5. The text notes that 'some assignments do change after reaching perfect separation,' yet both states are later combined into the 'overall' classification without any stated rationale for giving them equal weight. A classifier at minimal separation and a classifier at maximal separation are not the same model, and it is unclear which state corresponds to a well-calibrated classifier. The authors should justify the inclusion of both states in the aggregation procedure or select one state a priori.
minor comments (5)
- [Table 1 caption] There is a typo: 'well as' should be 'as well as'. The notation 'r\' and 's\' is defined in the caption but is visually hard to parse; a dedicated legend with an example would improve readability.
- [Sec. 2] The sentence about Radice et al. trajectories is confusing: the paper says 59 simulations are 'captured by the same set of trajectories... mixed with different mass weightings,' but then counts 420 trajectories as separate training cases. Clarify whether the 420 entries are independent nucleosynthesis calculations or repeated trajectories with different weights, since this affects the effective diversity of the training set.
- [Sec. 5] The phrase 'the 5 stars that differ' would be clearer as 'the five stars whose overall ML label disagrees with JINAbase,' to avoid ambiguity about whether these are the five disagreements or a subset of the 33 agreements.
- [Sec. 6] There is a grammar error: 'the database still label stars without a reported Ir abundance to be i' should be 'the database still labels...'. Also, the '?' entries in Table 2 are not defined in the caption; please state how an ambiguous overall label is determined and how it would be treated in a quantitative comparison.
- [Appendix] The paper does not provide a link to the trained models, the preprocessing code, or the exact train/validation/test splits. Making these available (e.g., on Zenodo or GitHub) would substantially strengthen the reproducibility of the reported agreement rates, especially given the informal aggregation step.
Circularity Check
No significant circularity; the r/s classifier is trained on independent simulation banks and tested against JINAbase labels that are never used as training inputs.
full rationale
The central r-vs-s claim is not circular. The training bank is assembled from simulations by independent groups (Radice et al., Just et al., Monash, FRUITY) with labels assigned by simulation provenance, not by JINAbase; the paper explicitly states the ML 'is never informed of the database's classification.' The 87% agreement is an external benchmark, not a fitted quantity. The feature set overlaps with JINAbase's defining ratios (Ba, Eu, Pb), which may inflate agreement, but this is a representativeness/validation concern rather than an equivalence by construction. The i-process section uses benchmark calculations from Cote et al. (2018), a self-citation, and Denissenkov et al. (2019), and generates variants around them; however, the paper explicitly defers solid i-process claims to future work with larger simulation sets, and the headline r/s result does not depend on these benchmarks. A separate, non-circular weakness is that the 'overall ML classification' in Table 1 is assigned by informal row-by-row inspection with the JINAbase column visible, so the 33/38 agreement is not reproducible from a fixed aggregation rule; this is a correctness/reproducibility risk, not a circular reduction.
Assumptions & free parameters
free parameters (4)
- SVM RBF kernel coefficient (gamma) and training-error bound (nu) =
not reported
- Feature set composition (Er vs Pb) =
two versions
- r-process training set reduction target =
124 of 420 Radice patterns
- Training epochs and best-state selection =
10,000 (BC), 30,000 (OCC)
assumptions (4)
- domain assumption PRISM reaction network with FRDM2012 masses, FRLDM fission barriers, and AME2020/NUBASE2020 experimental data produces reliable r- and i-process abundance patterns.
- domain assumption The curated hydrodynamic tracers and AGB model grids used to build the 187 s and 188 r patterns span the real diversity of enrichment patterns seen in metal-poor stars.
- domain assumption JINAbase elemental-ratio threshold classifications are a meaningful benchmark for the comparison.
- ad hoc to paper Eu-normalization is an appropriate scale-invariant transformation for comparing simulation and stellar abundance patterns.
Cite this review
Pith. "Pith review of Classifying metal-poor stars with machine learning using nucleosynthesis calculations." pith.science (2026). https://pith.science/paper/PQHRTMWD
@misc{pith2026250514563,
  author       = {Pith},
  title        = {Pith review of: Classifying metal-poor stars with machine learning using nucleosynthesis calculations},
  year         = {2026},
  howpublished = {\url{https://pith.science/paper/PQHRTMWD}},
  note         = {Machine review of arXiv:2505.14563}
}
abstract
We apply the capabilities of machine learning (ML) to discern patterns in order to classify metal-poor stars. To do so, we train an ML model on a bank of nucleosynthesis calculations derived from hydrodynamic simulations for events such as neutron star mergers where the rapid ($r$) neutron capture process can take place. Likewise we consider a bank of calculations from simulations of the slow ($s$) neutron capture process and also consider a few calculations for the intermediate ($i$) neutron capture process. We demonstrate that the ML does well overall in recognizing the $s$ process from the $r$ process, and after training on theoretical calculations ML stellar assignments match conventional labels 87% of the time. We highlight that this method then points to stars that could benefit from additional observational measurements. We also demonstrate that the ML assigns some of the presently considered $i$-process stars to instead be of $r$ or $s$ in origin, but likewise, finds stars currently labeled as $s$ to be potentially more aligned with $i$ enrichment. This first application of ML to classify metal-poor star enrichment using theoretical nucleosynthesis calculations thus reveals the promise, and some challenges, associated with this new data-driven path forward.
Figures


Figures from the paper (5 more)


Reference graph
Works this paper leans on
-
[1]
2018, ApJS, 238, 36, doi: 10.3847/1538-4365/aadfe9
Abohalima, A., & Frebel, A. 2018, ApJS, 238, 36, doi: 10.3847/1538-4365/aadfe9
-
[2]
2024, A&A, 685, A66, doi: 10.1051/0004-6361/202348031
Boulet, T. 2024, A&A, 685, A66, doi: 10.1051/0004-6361/202348031
-
[3]
Chemical abundance inventory in phosphorus-rich stars
Brauner, M., Masseron, T., Pignatari, M., & An ´ ıbal Garc ´ ıa-Hern´ andez, D. 2025, arXiv e-prints, arXiv:2503.03569, doi: 10.48550/arXiv.2503.03569
work page Pith review arXiv doi:10.48550/arxiv.2503.03569 2025
-
[4]
Burbidge, E. M., Burbidge, G. R., Fowler, W. A., & Hoyle, F. 1957, Reviews of Modern Physics, 29, 547, doi: 10.1103/RevModPhys.29.547 Cˆ ot´ e, B., Denissenkov, P., Herwig, F., et al. 2018, ApJ, 854, 105, doi: 10.3847/1538-4357/aaaae8
-
[5]
2015, ApJS, 219, 40, doi: 10.1088/0067-0049/219/2/40
Cristallo, S., Straniero, O., Piersanti, L., & Gobrecht, D. 2015, ApJS, 219, 40, doi: 10.1088/0067-0049/219/2/40
-
[6]
The i-process and CEMP-r/s stars
Dardelet, L., Ritter, C., Prado, P., et al. 2015, arXiv e-prints, arXiv:1505.05500, doi: 10.48550/arXiv.1505.05500 den Hartogh, J. W., Yag¨ ue L´ opez, A., Cseh, B., et al. 2023, A&A, 672, A143, doi: 10.1051/0004-6361/202244189
work page Pith review arXiv doi:10.48550/arxiv.1505.05500 2015
-
[7]
A., Herwig, F., Woodward, P., et al
Denissenkov, P. A., Herwig, F., Woodward, P., et al. 2019, MNRAS, 488, 4258, doi: 10.1093/mnras/stz1921
-
[8]
Fishlock, C. K., Karakas, A. I., Lugaro, M., & Yong, D. 2014, ApJ, 797, 44, doi: 10.1088/0004-637X/797/1/44
Show all 40 references
-
[9]
2018, Annual Review of Nuclear and Particle Science, 68, 237, doi: 10.1146/annurev-nucl-101917-021141
Frebel, A. 2018, Annual Review of Nuclear and Particle Science, 68, 237, doi: 10.1146/annurev-nucl-101917-021141
2018 doi
-
[10]
A., Daflon, S., Placco, V
Galarza, C. A., Daflon, S., Placco, V. M., et al. 2022, A&A, 657, A35, doi: 10.1051/0004-6361/202141717
2022 doi
-
[11]
2024, in EAS2024, European Astronomical Society Annual Meeting, 786
Grichener, A., Renzo, M., Kerzendorf, W., et al. 2024, in EAS2024, European Astronomical Society Annual Meeting, 786
2024
-
[12]
2025, ApJS, 277, 19, doi: 10.3847/1538-4365/adae86
Gu, H., Fan, Z., Zhao, G., et al. 2025, ApJS, 277, 19, doi: 10.3847/1538-4365/adae86
2025 doi
-
[13]
J., Lugaro, M., & Meyer, B
Hampel, M., Stancliffe, R. J., Lugaro, M., & Meyer, B. S. 2016, ApJ, 831, 171, doi: 10.3847/0004-637X/831/2/171
2016 doi
-
[14]
N., Kobayashi, C., Tominaga, N., & Nomoto, K
Hartwig, T., Ishigaki, M. N., Kobayashi, C., Tominaga, N., & Nomoto, K. 2023, ApJ, 946, 20, doi: 10.3847/1538-4357/acbcc6
2023 doi
-
[15]
2025, ApJ, 980, 90, doi: 10.3847/1538-4357/ad9686
Hattori, K. 2025, ApJ, 980, 90, doi: 10.3847/1538-4357/ad9686
2025 doi
-
[16]
R., Sharma, S., Bland-Hawthorn, J., et al
Hayden, M. R., Sharma, S., Bland-Hawthorn, J., et al. 2022, MNRAS, 517, 5325, doi: 10.1093/mnras/stac2787
2022 doi
-
[17]
2024, MNRAS, 532, 1099, doi: 10.1093/mnras/stae1567
Hou, X., Zhao, G., & Li, H. 2024, MNRAS, 532, 1099, doi: 10.1093/mnras/stae1567
2024 doi
-
[18]
Hughes, A. C. N., Spitler, L. R., Zucker, D. B., et al. 2022, ApJ, 930, 47, doi: 10.3847/1538-4357/ac5fa7 13
2022 doi
-
[19]
2015, Mon
Janka, H.-T. 2015, Mon. Not. R. Astron. Soc., 448, 541, doi: 10.1093/mnras/stv009
2015 doi
-
[20]
I., & Lugaro, M
Karakas, A. I., & Lugaro, M. 2016, ApJ, 825, 26, doi: 10.3847/0004-637X/825/1/26
2016 doi
-
[21]
I., Lugaro, M., Carlos, M., et al
Karakas, A. I., Lugaro, M., Carlos, M., et al. 2018, MNRAS, 477, 421, doi: 10.1093/mnras/sty625
2018 doi
-
[22]
I., Marino, A
Karakas, A. I., Marino, A. F., & Nataf, D. M. 2014, ApJ, 784, 32, doi: 10.1088/0004-637X/784/1/32
2014 doi
-
[23]
2024, A&A, 691, A98, doi: 10.1051/0004-6361/202451427
Khalatyan, A., Anders, F., Chiappini, C., et al. 2024, A&A, 691, A98, doi: 10.1051/0004-6361/202451427
2024 doi
-
[24]
2021, Chinese Physics C, 45, 030001, doi: 10.1088/1674-1137/abddae
Kondev, F., Wang, M., Huang, W., Naimi, S., & Audi, G. 2021, Chinese Physics C, 45, 030001, doi: 10.1088/1674-1137/abddae
2021 doi
-
[25]
M., Meyer, B
Li, M., Sprouse, T. M., Meyer, B. S., & Mumpower, M. R. 2024, Physics Letters B, 848, 138385, doi: 10.1016/j.physletb.2023.138385
2024
-
[26]
L., Du, C.-D., et al
Li, Y.-B., Luo, A. L., Du, C.-D., et al. 2018, ApJS, 234, 31, doi: 10.3847/1538-4365/aaa415
2018 doi
-
[27]
I., Stancliffe, R
Lugaro, M., Karakas, A. I., Stancliffe, R. J., & Rijs, C. 2012, ApJ, 747, 2, doi: 10.1088/0004-637X/747/1/2 Matijeviˇ c, G., Chiappini, C., Grebel, E. K., et al. 2017, A&A, 603, A19, doi: 10.1051/0004-6361/201730417 M¨ oller, P., Sierk, A. J., Ichikawa, T., Iwamoto, A., &
2012 doi
-
[28]
2015, PhRvC, 91, 024310, doi: 10.1103/PhysRevC.91.024310 M¨ oller, P., Sierk, A
Mumpower, M. 2015, PhRvC, 91, 024310, doi: 10.1103/PhysRevC.91.024310 M¨ oller, P., Sierk, A. J., Ichikawa, T., & Sagawa, H. 2016, At. Data Nucl. Data Tables, 109, 1, doi: 10.1016/j.adt.2015.10.002
2015 doi
-
[29]
R., Kawano, T., Sprouse, T
Mumpower, M. R., Kawano, T., Sprouse, T. M., et al. 2018, ApJ, 869, 14, doi: 10.3847/1538-4357/aaeaca
2018 doi
- [30]
-
[31]
2018, ApJ, 869, 130, doi: 10.3847/1538-4357/aaf054
Radice, D., Perego, A., Hotokezaka, K., et al. 2018, ApJ, 869, 130, doi: 10.3847/1538-4357/aaf054
2018 doi
-
[32]
2024, MNRAS, 529, 3197, doi: 10.1093/mnras/stae561
Reichert, M., Bugli, M., Guilet, J., et al. 2024, MNRAS, 529, 3197, doi: 10.1093/mnras/stae561
2024 doi
-
[33]
U., Karakas, A
Roederer, I. U., Karakas, A. I., Pignatari, M., & Herwig, F. 2016, ApJ, 821, 37, doi: 10.3847/0004-637X/821/1/37 Sch¨ olkopf, B., Platt, J., Shawe-Taylor, J., Smola, A., &
2016 doi
-
[34]
2001, Neural Computation, 13, 1443, doi: 10.1162/089976601750264965
Williamson, R. 2001, Neural Computation, 13, 1443, doi: 10.1162/089976601750264965
2001 doi
-
[35]
J., Doherty, C
Shingles, L. J., Doherty, C. L., Karakas, A. I., et al. 2015, MNRAS, 452, 2804, doi: 10.1093/mnras/stv1489
2015 doi
-
[36]
J., & Gallino, R
Sneden, C., Cowan, J. J., & Gallino, R. 2008, Annual Review of Astron. and Astrophys., 46, 241, doi: 10.1146/annurev.astro.46.060407.145207
2008
-
[37]
2017, PhRvC, 96, 044308, doi: 10.1103/PhysRevC.96.044308
Utama, R., & Piekarewicz, J. 2017, PhRvC, 96, 044308, doi: 10.1103/PhysRevC.96.044308
2017 doi
-
[38]
2019, Journal of Physics G Nuclear Physics, 46, 065202, doi: 10.1088/1361-6471/ab0bea
Vassh, N., Vogt, R., Surman, R., et al. 2019, Journal of Physics G Nuclear Physics, 46, 065202, doi: 10.1088/1361-6471/ab0bea
2019 doi
-
[39]
2024, Phys
Vassh, N., Wang, X., Larivi` ere, M., et al. 2024, Phys. Rev. Lett., 132, 052701, doi: 10.1103/PhysRevLett.132.052701 Vil´ agos, B., Cseh, B., Yag¨ ue L´ opez, A., et al. 2024, A&A, 688, A164, doi: 10.1051/0004-6361/202450084
2024 doi
-
[40]
2021, Chinese Physics C, 45, 030003, doi: 10.1088/1674-1137/abddaf
Naimi, S. 2021, Chinese Physics C, 45, 030003, doi: 10.1088/1674-1137/abddaf
2021 doi
Reviewed August 7, 2026 · model on record in the stance chip above.
Discussion (0). Continue with ORCID to comment.