REVIEW 3 major objections 4 minor 47 references
Uncovering Cultural Representation Disparities in Vision-Language Models
T0 review · 3 major / 4 minor · reviewed 2026-08-15 · deepseek-v4-flash
Pith's one-line read The paper claims that vision-language models' cultural bias is concentrated in a few overrepresented countries rather than being uniformly Western, and shows country-level evaluation is required to expose it.
desk verdict Broad, useful benchmark of VLM country recognition; the central causal claim about training data is an inference the paper doesn't back up. read the letter →
The pith
A machine-rendered reading of the paper's core claim, the machinery that carries it, and where it could break.
The reading
What carries the argument
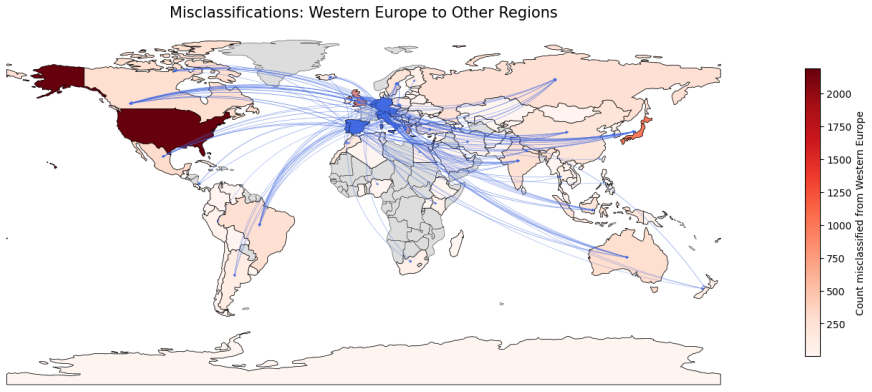
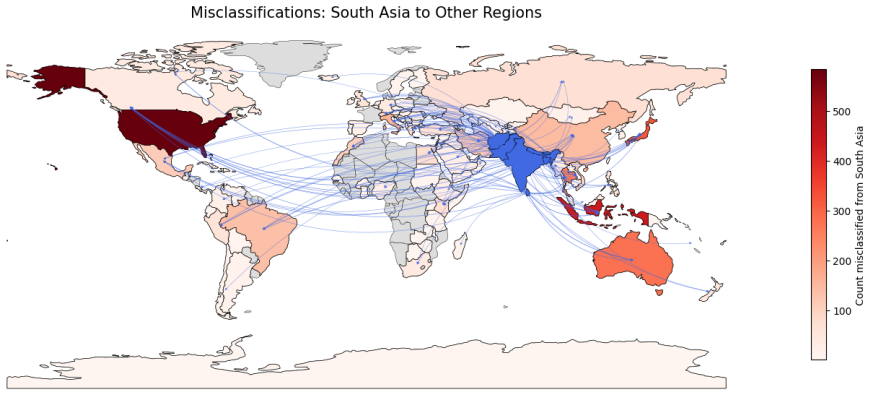
The central instrument is the country-identification probe built on the Country211 dataset, which contains 100 GPS-labelled images from each of 211 countries, so every country is equally represented in the test set. The paper combines this balanced probe with three prompting formats, namely open-ended questions, multiple-choice with random distractors, and multiple-choice with culturally similar distractors, plus five prompt languages and image perturbations. The mechanism that carries the argument is the response-distribution and misclassification-map analysis: instead of only reporting accuracy, the paper traces where wrong answers go, which is what exposes the USA-India-Brazil overprediction cluster and the frequent collapse of African and South American images onto India.
What would settle it
Measure the geotagged country frequencies in the actual pretraining data behind these models and compare them with per-country overprediction rates; if a low-frequency country is overpredicted as often as India, the data-overrepresentation explanation fails. Training or fine-tuning a vision-language model on country-balanced data provides the control: if USA, India, and Brazil overprediction persists, visual salience, not data volume, drives the bias.
Extended reading notes
Core claim
On the paper's own terms, the discovery is that cultural bias in vision-language models is concentrated rather than uniform. When asked to name the country of an image, all six models, proprietary and open-weight alike, overpredict a small set of nations, namely the USA, India, and Brazil, no matter what the ground-truth label is, while countries such as Angola, the Central African Republic, and Eswatini are recognized at rates near or at zero in open-ended questioning. This pattern persists across prompt languages and is made worse by image rotation and grayscale conversion. The paper concludes that the biases "are not uniformly Western but instead reflect over representation of certain countries in training data," and argues that country-level evaluation is required to surface disparities that regional averages hide.
Load-bearing premise
The conclusion rests on the untested assumption that a model's overprediction frequencies mirror the geographic composition of its pretraining data, and that GPS-derived country labels are a valid proxy for cultural origin; the paper never measures the training corpora themselves.
Editorial extensions
If this is right
- If the concentration pattern is real, country-level accuracy must replace regional accuracy as the reporting unit; the regional tables in the paper mask that some countries are recognized at near-zero rates.
- If pretraining overrepresentation drives overprediction, then documenting the geographic composition of vision-language-model training corpora becomes a necessary step for any fairness claim about these models.
- If prompt language barely moves accuracy, with under 2 percent difference across English, Hindi, Chinese, Portuguese, and Spanish, then multilingual prompting alone is not a remedy for cultural bias.
- If multiple-choice questions with culturally similar distractors reveal confusions that random-distractor questions hide, then evaluation suites that only use easy multiple-choice formats will overstate cultural competence.
- If rotation and grayscale hurt some countries and models far more than others, then deployments on imperfect real-world images will inherit and likely widen the same disparities.
Reading between the lines
- A direct test of the paper's central mechanism would be to measure geotagged country frequencies in the actual pretraining corpora and correlate them with each model's overprediction rates; the paper only infers the data from model outputs.
- If overprediction is driven by visual distinctiveness rather than data volume, countries with highly recognizable flags, architecture, or attire would be overpredicted even by models trained on perfectly balanced data; the two explanations are separable and testable.
- The same probe could be turned into an intervention: fine-tuning with hard negatives drawn from culturally similar countries might selectively improve recognition for underrepresented countries.
- Extending the country proxy to sub-national or regional labels would test whether the concentration pattern persists at finer cultural granularity, which the paper's own limitation note suggests it might not.
Signed reviews
Editorial analysis
A structured set of objections, weighed in public.
Referee Report
Summary. The paper evaluates six vision-language models (Gemini-2.5-Flash, Gemma-3-27B, Gemma-3-12B, Aya-Vision-8B/32B, GPT-4o-Mini) on the Country211 image-based country identification benchmark, covering 211 countries under open-ended, multiple-choice (with random and similar distractors), multilingual (English, Hindi, Chinese, Portuguese, Spanish), and image-perturbation conditions. It reports large country-level accuracy disparities, consistent overprediction of the USA, India, and Brazil in open-ended responses, and sensitivity patterns across image categories and perturbations. The paper concludes that VLM cultural bias is not uniformly Western but reflects overrepresentation of certain countries in training data, and argues for greater dataset-composition transparency.
Significance. If the central finding holds, the paper is a useful corrective to the common 'uniform Western bias' narrative and provides a broad, reproducible evaluation matrix: 168.8K samples, 6 models, 5 prompt languages, 9 image categories, and perturbation analysis, with country-level accuracy tables in the appendix and datasets/code released. The paper's most distinctive contribution is the claim that VLM biases concentrate on a few overrepresented or visually salient countries (USA, India, Brazil) rather than being broadly Western. However, that claim currently rests on an unsupported causal inference from model output frequencies to pretraining-data composition, and the open-ended answer-normalization procedure is underspecified, so the headline result needs strengthening before it can be accepted as stated.
major comments (3)
- [Sections 5.5, 6, 7 (and footnote 2)] The central conclusion in Section 7, that overprediction of the USA, India, and Brazil 'reflect[s] over representation of certain countries in training data', is not supported by the evidence presented. Section 5.5 itself offers only a hypothesis ('likely overrepresented in the models' pretraining data or benefit from more visually distinctive cues'), and Section 6 restates it as 'reinforcing the role of training data bias' without any measurement of training data. The only external support cited, footnote 2 (Basu et al., 2023), concerns text-to-image generation, not discriminative VLM behavior. Given that Section 5.4 (Figure 13) shows image category strongly affects accuracy, and Country211 is balanced by country count but not controlled for category composition, the observed overprediction could plausibly stem from category imbalance or visual distinctiveness rather than training-data frequency. Please either (a) soften the conclusion to a hypothesis, or (b) add targeted controls, such as a human or zero-shot CLIP baseline, a per-image-category overprediction analysis, or direct evidence about the country distribution in the models' pretraining data. This is load-bearing for the paper's headline contribution.
- [Sections 3, 4.1, Appendix D] The open-ended evaluation requires mapping free-form country names from model responses to ISO-3166 labels, but the manuscript never specifies the normalization or matching procedure. Section 3's note that 'the list of tags and corresponding country names led to the models responding consistently' is not a specification: it does not state whether exact string matching, fuzzy matching, an LLM-based resolver, or manual adjudication was used, nor how non-English or synonymous answers (e.g., 'Britain' vs. 'United Kingdom') were handled. Since the response distribution in Figure 7 and all open-ended accuracy numbers depend on this mapping, the results are not reproducible without this detail. Please document the answer-to-label pipeline and include a brief error analysis.
- [Table 2] The reported Cochran's Q statistics are negative (e.g., -0.727, -0.952), but Cochran's Q is defined as a nonnegative statistic; negative values, together with p-values of ~1.0 reported to several decimal places, indicate a misapplication of the test or of the p-value computation. The Pearson chi-square rows also lack a clear description of the contingency tables being tested (across models? across countries?). Please clarify the exact statistical procedures and re-report the results. This does not affect the country-level accuracy tables, but it undermines the claims in Section 5 that perturbations and language 'do not meaningfully alter' overall accuracy.
minor comments (4)
- [Section 3] The sentence 'proving the list of tags and corresponding country names led to the models responding consistently' appears to contain a typo (likely 'providing' or 'promising') and should be rephrased for clarity.
- [Section 4.3] The selection of similar distractors is described only as 'chosen from among the bordering nations' with manual additions for culturally similar countries; please specify how many distractors were used, how they were sampled, and whether the selection was balanced across countries and conditions.
- [Figure 7] Please clarify whether the response distribution in Figure 7 is pooled across models or per-model, and whether it is normalized by the number of samples per country; the current caption does not make this explicit.
- [Appendix C] The reproducibility section reports seed values and API providers but not the specific model versions or access dates for the proprietary models; adding version identifiers would further support reproducibility.
Circularity Check
No significant circularity: the study is an external benchmark evaluation with no fitted parameters and no self-referential derivation.
full rationale
The paper performs a measurement study: it applies six VLMs to the external Country211 dataset under fixed prompting protocols and reports accuracy and response distributions. No parameter is fitted to the outcome, no prediction is generated from a model whose inputs include the target quantity, and no uniqueness or ansatz result is imported from the authors' prior work. The nearest issue is that Section 5.5's interpretation of USA/India/Brazil overprediction as evidence of training-data overrepresentation is an unsupported causal inference (the paper itself hedges with 'or benefit from more visually distinctive cues'), and footnote 2 cites a text-to-image study for a related point. But an evidentiary gap is not circularity: the response distribution is measured, not constructed from the conclusion, and the training-data claim is not used to derive the accuracy numbers. VLM-generated image category labels are used only for auxiliary analysis and do not feed back into the central country-recognition results. Self-citations to Yadav et al. (2025) and related prior work merely motivate the country-label proxy and are not load-bearing for any equation or prediction. The paper's own Limitations section further acknowledges the proxy nature of country labels, which is an assumption, not a circular reduction. The circularity score is therefore 0.
Assumptions & free parameters
assumptions (4)
- domain assumption ISO-3166 country labels derived from GPS coordinates in YFCC100M are a valid ground-truth proxy for the cultural origin of an image.
- domain assumption Images in Country211 are representative enough of each country's visual culture to support country-level bias claims.
- domain assumption The VLM-generated category labels (Gemini-2.5-Pro, o4-mini, Grok-2-Vision, majority vote) are accurate enough for the image-category accuracy analysis.
- ad hoc to paper Prediction frequencies can be used to infer pretraining data composition without direct access to training data.
Cite this review
Pith. "Pith review of Uncovering Cultural Representation Disparities in Vision-Language Models." pith.science (2026). https://pith.science/paper/N53C22JA
@misc{pith2026250514729,
  author       = {Pith},
  title        = {Pith review of: Uncovering Cultural Representation Disparities in Vision-Language Models},
  year         = {2026},
  howpublished = {\url{https://pith.science/paper/N53C22JA}},
  note         = {Machine review of arXiv:2505.14729}
}
read the original abstract
Vision-Language Models (VLMs) have demonstrated impressive capabilities across a range of tasks, yet concerns about their potential biases exist. This work investigates the extent to which prominent VLMs exhibit cultural biases by evaluating their performance on an image-based country identification task at a country level. Utilizing the geographically diverse Country211 dataset, we probe several large vision language models (VLMs) under various prompting strategies: open-ended questions, multiple-choice questions (MCQs) including challenging setups like multilingual and adversarial settings. Our analysis aims to uncover disparities in model accuracy across different countries and question formats, providing insights into how training data distribution and evaluation methodologies might influence cultural biases in VLMs. The findings highlight significant variations in performance, suggesting that while VLMs possess considerable visual understanding, they inherit biases from their pre-training data and scale that impact their ability to generalize uniformly across diverse global contexts.
Figures


Figures from the paper (33 more)







Reference graph
Works this paper leans on
-
[1]
URL: " 'urlintro :=
ENTRY address author booktitle chapter edition editor howpublished institution journal key month note number organization pages publisher school series title type volume year eprint doi pubmed url lastchecked label extra.label sort.label short.list INTEGERS output.state before.all mid.sentence after.sentence after.block STRINGS urlintro eprinturl eprintpr...
-
[2]
write newline
" write newline "" before.all 'output.state := FUNCTION n.dashify 't := "" t empty not t #1 #1 substring "-" = t #1 #2 substring "--" = not "--" * t #2 global.max substring 't := t #1 #1 substring "-" = "-" * t #2 global.max substring 't := while if t #1 #1 substring * t #2 global.max substring 't := if while FUNCTION word.in bbl.in capitalize " " * FUNCT...
-
[3]
Muhammad Farid Adilazuarda, Sagnik Mukherjee, Pradhyumna Lavania, Siddhant Shivdutt Singh, Alham Fikri Aji, Jacki O ' Neill, Ashutosh Modi, and Monojit Choudhury. 2024. https://doi.org/10.18653/v1/2024.emnlp-main.882 Towards measuring and modeling culture in LLM s: A survey . In Proceedings of the 2024 Conference on Empirical Methods in Natural Language P...
-
[4]
Utkarsh Agarwal, Kumar Tanmay, Aditi Khandelwal, and Monojit Choudhury. 2024. https://aclanthology.org/2024.lrec-main.560/ Ethical reasoning and moral value alignment of LLM s depend on the language we prompt them in . In Proceedings of the 2024 Joint International Conference on Computational Linguistics, Language Resources and Evaluation (LREC-COLING 202...
2024
-
[5]
Jean-Baptiste Alayrac, Jeff Donahue, Pauline Luc, Antoine Miech, Iain Barr, Yana Hasson, Karel Lenc, Arthur Mensch, Katherine Millican, Malcolm Reynolds, Roman Ring, Eliza Rutherford, Serkan Cabi, Tengda Han, Zhitao Gong, Sina Samangooei, Marianne Monteiro, Jacob L Menick, Sebastian Borgeaud, Andy Brock, Aida Nematzadeh, Sahand Sharifzadeh, Miko aj Bi\' n...
2022
-
[6]
Badr AlKhamissi, Muhammad ElNokrashy, Mai Alkhamissi, and Mona Diab. 2024. https://doi.org/10.18653/v1/2024.acl-long.671 Investigating cultural alignment of large language models . In Proceedings of the 62nd Annual Meeting of the Association for Computational Linguistics (Volume 1: Long Papers), pages 12404--12422, Bangkok, Thailand. Association for Compu...
-
[7]
Amith Ananthram, Elias Stengel-Eskin, Mohit Bansal, and Kathleen McKeown. 2025. https://openreview.net/forum?id=Xbl6t6zxZs See it from my perspective: How language affects cultural bias in image understanding . In The Thirteenth International Conference on Learning Representations
work page 2025
-
[8]
Inspecting the Geographical Representativeness of Images from Text-to-Image Models
Abhipsa Basu, R. Venkatesh Babu, and Danish Pruthi. 2023. http://arxiv.org/abs/2305.11080 Inspecting the geographical representativeness of images from text-to-image models
work page Pith review arXiv 2023
Show all 47 references
-
[9]
Mehar Bhatia, Sahithya Ravi, Aditya Chinchure, EunJeong Hwang, and Vered Shwartz. 2024. https://doi.org/10.18653/v1/2024.emnlp-main.385 From local concepts to universals: Evaluating the multicultural understanding of vision-language models . In Proceedings of the 2024 Conferen...
2024 doi
-
[10]
Olena Burda-Lassen, Aman Chadha, Shashank Goswami, and Vinija Jain. 2025. https://doi.org/10.1109/IPAS63548.2025.10924504 How culturally aware are vision-language models? In 2025 IEEE 6th International Conference on Image Processing, Applications and Systems (IPAS), volume CFP...
2025
-
[11]
Rochelle Choenni and Ekaterina Shutova. 2024. http://arxiv.org/abs/2408.16482 Self-alignment: Improving alignment of cultural values in llms via in-context learning
2024 arXiv
-
[12]
Saurabh Dash, Yiyang Nan, John Dang, Arash Ahmadian, Shivalika Singh, Madeline Smith, Bharat Venkitesh, Vlad Shmyhlo, Viraat Aryabumi, Walter Beller-Morales, Jeremy Pekmez, Jason Ozuzu, Pierre Richemond, Acyr Locatelli, Nick Frosst, Phil Blunsom, Aidan Gomez, Ivan Zhang, Marzi...
2025 arXiv
-
[13]
Terrance de Vries, Ishan Misra, Changhan Wang, and Laurens van der Maaten. 2019. Does object recognition work for everyone? In Proceedings of the IEEE/CVF Conference on Computer Vision and Pattern Recognition (CVPR) Workshops
2019
-
[14]
Gemini Team ... etal. 2025. http://arxiv.org/abs/2312.11805 Gemini: A family of highly capable multimodal models
2025 arXiv
-
[15]
William Gaviria Rojas, Sudnya Diamos, Keertan Kini, David Kanter, Vijay Janapa Reddi, and Cody Coleman. 2022. https://proceedings.neurips.cc/paper_files/paper/2022/file/5474d9d43c0519aa176276ff2c1ca528-Paper-Datasets_and_Benchmarks.pdf The dollar street dataset: Images represe...
2022
-
[16]
A. L. Kroeber, Wayne Untereiner, and Clyde Kluckhohn. 1985. Culture: A critical review of concepts and definitions. Vintage Books
1985
-
[17]
Alina Kuznetsova, Hassan Rom, Neil Alldrin, Jasper Uijlings, Ivan Krasin, Jordi Pont-Tuset, Shahab Kamali, Stefan Popov, Matteo Malloci, Alexander Kolesnikov, Tom Duerig, and Vittorio Ferrari. 2020. The open images dataset v4: Unified image classification, object detection, an...
2020
-
[18]
Cheng Li, Mengzhuo Chen, Jindong Wang, Sunayana Sitaram, and Xing Xie. 2024 a . https://proceedings.neurips.cc/paper_files/paper/2024/file/9a16935bf54c4af233e25d998b7f4a2c-Paper-Conference.pdf Culturellm: Incorporating cultural differences into large language models . In Advan...
2024
-
[19]
Wenyan Li, Crystina Zhang, Jiaang Li, Qiwei Peng, Raphael Tang, Li Zhou, Weijia Zhang, Guimin Hu, Yifei Yuan, Anders S gaard, Daniel Hershcovich, and Desmond Elliott. 2024 b . https://doi.org/10.18653/v1/2024.emnlp-main.1063 F oodie QA : A multimodal dataset for fine-grained u...
2024 doi
-
[20]
Fangyu Liu, Emanuele Bugliarello, Edoardo Maria Ponti, Siva Reddy, Nigel Collier, and Desmond Elliott. 2021. https://aclanthology.org/2021.emnlp-main.818/ Visually grounded reasoning across languages and cultures . In Proceedings of the 2021 Conference on Empirical Methods in ...
2021
-
[21]
Haotian Liu, Chunyuan Li, Yuheng Li, and Yong Jae Lee. 2024. Improved baselines with visual instruction tuning. In Proceedings of the IEEE/CVF Conference on Computer Vision and Pattern Recognition (CVPR), pages 26296--26306
2024
-
[22]
Wong, Qingsong Wen, Lichao Sun, Haipeng Chen, Xing Xie, and Jindong Wang
Shudong Liu, Yiqiao Jin, Cheng Li, Derek F. Wong, Qingsong Wen, Lichao Sun, Haipeng Chen, Xing Xie, and Jindong Wang. 2025. http://arxiv.org/abs/2501.01282 Culturevlm: Characterizing and improving cultural understanding of vision-language models for over 100 countries
2025 arXiv
-
[23]
Zheng Ma, Mianzhi Pan, Wenhan Wu, Kanzhi Cheng, Jianbing Zhang, Shujian Huang, and Jiajun Chen. 2023. Food-500 cap: A fine-grained food caption benchmark for evaluating vision-language models. In Proceedings of the 31st ACM International Conference on Multimedia, pages 5674--5685
2023
-
[24]
Lobell, and Stefano Ermon
Rohin Manvi, Samar Khanna, Marshall Burke, David B. Lobell, and Stefano Ermon. 2024. https://proceedings.mlr.press/v235/manvi24a.html Large language models are geographically biased . In Proceedings of the 41st International Conference on Machine Learning, volume 235 of Procee...
2024
-
[25]
Youssef Mohamed, Runjia Li, Ibrahim Said Ahmad, Kilichbek Haydarov, Philip Torr, Kenneth Church, and Mohamed Elhoseiny. 2024. https://doi.org/10.18653/v1/2024.emnlp-main.1165 No culture left behind: A rt EL ingo-28, a benchmark of W iki A rt with captions in 28 languages . In ...
2024 doi
-
[26]
Tarek Naous, Michael J Ryan, Alan Ritter, and Wei Xu. 2024. https://doi.org/10.18653/v1/2024.acl-long.862 Having beer after prayer? measuring cultural bias in large language models . In Proceedings of the 62nd Annual Meeting of the Association for Computational Linguistics (Vo...
2024 doi
-
[27]
Shravan Nayak, Kanishk Jain, Rabiul Awal, Siva Reddy, Sjoerd Van Steenkiste, Lisa Anne Hendricks, Karolina Stanczak, and Aishwarya Agrawal. 2024. https://doi.org/10.18653/v1/2024.emnlp-main.329 Benchmarking vision language models for cultural understanding . In Proceedings of ...
2024 doi
-
[28]
Joan Nwatu, Oana Ignat, and Rada Mihalcea. 2023. https://doi.org/10.18653/v1/2023.emnlp-main.660 Bridging the digital divide: Performance variation across socio-economic factors in vision-language models . In Proceedings of the 2023 Conference on Empirical Methods in Natural L...
2023 doi
-
[29]
Nick Obradovich, \"O mer \"O zak, Ignacio Mart \' n, Ignacio Ortu \ n o-Ort \' n, Edmond Awad, Manuel Cebri \'a n, Rub \'e n Cuevas, Klaus Desmet, Iyad Rahwan, and \'A ngel Cuevas. 2022. Expanding the measurement of culture with a sample of two billion humans. Journal of the R...
2022
-
[30]
OpenAI. 2021. https://github.com/openai/CLIP/blob/main/data/country211.md Country211
2021
-
[31]
OpenAI, Josh Achiam, Steven Adler, Sandhini Agarwal, Lama Ahmad, Ilge Akkaya, Florencia Leoni Aleman, Diogo Almeida, Janko Altenschmidt, Sam Altman, Shyamal Anadkat, Red Avila, Igor Babuschkin, Suchir Balaji, Valerie Balcom, Paul Baltescu, Haiming Bao, Mohammad Bavarian, Jeff ...
2024 arXiv
-
[32]
Ang\' e line Pouget, Lucas Beyer, Emanuele Bugliarello, Xiao Wang, Andreas Peter Steiner, Xiaohua Zhai, and Ibrahim Alabdulmohsin. 2024. https://proceedings.neurips.cc/paper_files/paper/2024/file/c07d71ff0bc042e4b9acd626a79597fa-Paper-Conference.pdf No filter: Cultural and soc...
2024
-
[33]
Alec Radford, Jong Wook Kim, Chris Hallacy, Aditya Ramesh, Gabriel Goh, Sandhini Agarwal, Girish Sastry, Amanda Askell, Pamela Mishkin, Jack Clark, Gretchen Krueger, and Ilya Sutskever. 2021. https://proceedings.mlr.press/v139/radford21a.html Learning transferable visual model...
2021
-
[34]
David Romero, Chenyang Lyu, Haryo Akbarianto Wibowo, Teresa Lynn, Injy Hamed, Aditya Nanda Kishore, Aishik Mandal, Alina Dragonetti, Artem Abzaliev, Atnafu Lambebo Tonja, Bontu Fufa Balcha, Chenxi Whitehouse, Christian Salamea, Dan John Velasco, David Ifeoluwa Adelani, David L...
2024
-
[35]
Florian Schneider, Carolin Holtermann, Chris Biemann, and Anne Lauscher. 2025. https://aclanthology.org/2025.findings-acl.500 GIMMICK : Globally inclusive multimodal multitask cultural knowledge benchmarking . In Findings of the Association for Computational Linguistics: ACL 2...
2025
-
[36]
Shreya Shankar, Yoni Halpern, Eric Breck, James Atwood, Jimbo Wilson, and D. Sculley. 2017. No classification without representation: Assessing geodiversity issues in open data sets for the developing world. In NIPS 2017 workshop: Machine Learning for the Developing World
2017
-
[37]
Gemma Team, Aishwarya Kamath, Johan Ferret, Shreya Pathak, Nino Vieillard, Ramona Merhej, Sarah Perrin, Tatiana Matejovicova, Alexandre Ramé, Morgane Rivière, Louis Rouillard, Thomas Mesnard, Geoffrey Cideron, Jean bastien Grill, Sabela Ramos, Edouard Yvinec, Michelle Casbon, ...
2025 arXiv
-
[38]
Bart Thomee, David A Shamma, Gerald Friedland, Benjamin Elizalde, Karl Ni, Douglas Poland, Damian Borth, and Li-Jia Li. 2016. Yfcc100m: The new data in multimedia research. Communications of the ACM, 59(2):64--73
2016
-
[39]
Jen tse Huang, Jiantong Qin, Jianping Zhang, Youliang Yuan, Wenxuan Wang, and Jieyu Zhao. 2025. http://arxiv.org/abs/2503.07575 Visbias: Measuring explicit and implicit social biases in vision language models
2025 arXiv
-
[40]
Emiel van Miltenburg, Desmond Elliott, and Piek Vossen. 2017. https://aclanthology.org/W17-3503/ Cross-linguistic differences and similarities in image descriptions . In Proceedings of the 10th International Conference on Natural Language Generation, pages 21--30, Santiago de ...
2017
-
[41]
Weihan Wang, Qingsong Lv, Wenmeng Yu, Wenyi Hong, Ji Qi, Yan Wang, Junhui Ji, Zhuoyi Yang, Lei Zhao, Xixuan Song, Jiazheng Xu, Keqin Chen, Bin Xu, Juanzi Li, Yuxiao Dong, Ming Ding, and Jie Tang. 2024. https://proceedings.neurips.cc/paper_files/paper/2024/file/dc06d4d2792265fb...
2024
-
[42]
Zhaotian Weng, Zijun Gao, Jerone Andrews, and Jieyu Zhao. 2024. https://doi.org/10.18653/v1/2024.emnlp-main.878 Images speak louder than words: Understanding and mitigating bias in vision-language model from a causal mediation perspective . In Proceedings of the 2024 Conferenc...
2024 doi
-
[43]
Genta Indra Winata, Frederikus Hudi, Patrick Amadeus Irawan, David Anugraha, Rifki Afina Putri, Yutong Wang, Adam Nohejl, Ubaidillah Ariq Prathama, Nedjma Ousidhoum, Afifa Amriani, Anar Rzayev, Anirban Das, Ashmari Pramodya, Aulia Adila, Bryan Wilie, Candy Olivia Mawalim, Chin...
2025 arXiv
-
[44]
Srishti Yadav, Zhi Zhang, Daniel Hershcovich, and Ekaterina Shutova. 2025. Beyond words: Exploring cultural value sensitivity in multimodal models. In Findings of the Association for Computational Linguistics: NAACL 2025, pages 7592--7608
2025
-
[45]
Jingyi Zhang, Jiaxing Huang, Sheng Jin, and Shijian Lu. 2024. https://doi.org/10.1109/TPAMI.2024.3369699 Vision-language models for vision tasks: A survey . IEEE Transactions on Pattern Analysis and Machine Intelligence, 46(8):5625--5644
2024
-
[46]
Jieyu Zhao, Tianlu Wang, Mark Yatskar, Vicente Ordonez, and Kai-Wei Chang. 2017. https://doi.org/10.18653/v1/D17-1323 Men also like shopping: Reducing gender bias amplification using corpus-level constraints . In Proceedings of the 2017 Conference on Empirical Methods in Natur...
2017 doi
-
[47]
Kankan Zhou, Eason Lai, and Jing Jiang. 2022. https://doi.org/10.18653/v1/2022.aacl-main.40 VLS tereo S et: A study of stereotypical bias in pre-trained vision-language models . In Proceedings of the 2nd Conference of the Asia-Pacific Chapter of the Association for Computation...
2022 doi
Reviewed August 15, 2026 · model on record in the stance chip above.
Discussion (0). Continue with ORCID to comment.