REVIEW 4 major objections 6 minor 37 references
Extracting Practical, Actionable Energy Insights from Supercomputer Telemetry and Logs
T0 review · 4 major / 6 minor · reviewed 2026-08-07 · deepseek-v4-flash
Pith's one-line read A year of Polaris telemetry shows that typical GPU power draw is dominated by idle power, and most jobs barely use their GPUs.
desk verdict Solid case study with a useful pipeline, but the headline idle-power claim is a datasheet calculation, not a measurement — and the paper needs the power metric source and artifacts before that claim can be trusted. read the letter →
The pith
A machine-rendered reading of the paper's core claim, the machinery that carries it, and where it could break.
The reading
What carries the argument
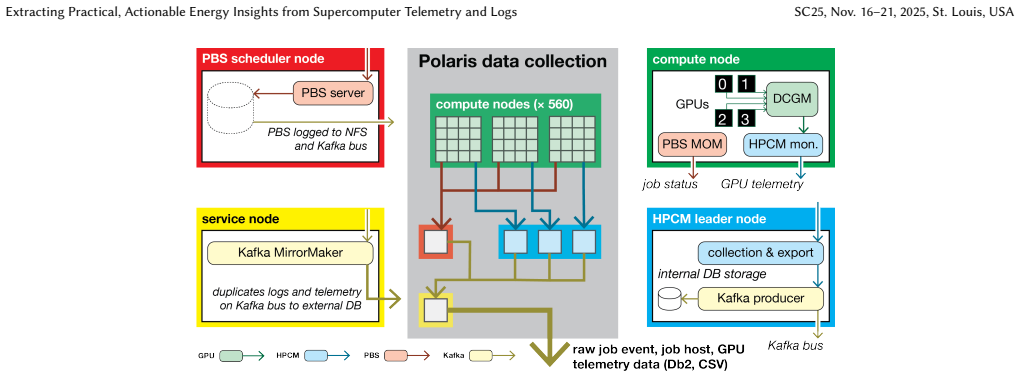
The central machinery is a data co-analysis pipeline that aligns PBS scheduler job records with five-second GPU telemetry samples by timestamp and then aggregates the joined data into per-job summaries. On top of that it computes resource imbalance (RI) coefficients, where temporal RI measures how much a resource fluctuates within a node over a job and spatial RI measures how consistent usage is across nodes, for GPU utilization, memory utilization, and memory allocation. These RI coefficients are what make the job-level power-management recommendation possible: they show spatial consistency that justifies sampling one node and applying one policy across the job. Pearson correlations among derived metrics then link power to utilization and memory access rather than to allocation.
What would settle it
Take a representative sample of jobs on the same hardware and log GPU power both through the standard five-second DCGM path and through a high-frequency power monitor, for example 1 ms node PDU sampling. If the high-frequency trace shows frequent power excursions above the reported ~400 W per node, or if jobs with near-100% reported GPU utilization show long low-power periods, the paper's central picture of idle-dominated, underutilized GPU power would be contradicted.
Extended reading notes
Core claim
On its own terms, the paper's central claim is that a year of production telemetry from Polaris reveals a system-wide GPU power problem with a clear shape: node-level GPU power averages about 400 W, one GPU's TDP, and at least 200 W of that is fixed idle draw from keeping four A100 GPUs powered on. GPU utilization is low, with about 75% of jobs using their GPUs for half or less of the runtime; GPU memory utilization is lower still, with nearly 90% of jobs accessing memory less than a quarter of the time; and GPU memory allocation correlates almost not at all with power. Because temporal variability lives inside nodes while spatial behavior is consistent across a job's nodes, the paper argues that power management can be applied at the job level and sampled from one node, and that the largest wins would come from reducing idle power, for example by giving A100s software-controlled P-states, and from optimizing active memory access rather than memory capacity.
Load-bearing premise
The central observations depend on the premise that five-second DCGM/NVML metrics, especially GPU utilization defined as the percent of time any kernel is executing, faithfully capture the activity that actually drives GPU power; a GPU that is always busy but at low occupancy will read as 100% utilized while drawing far less than peak power, and power spikes shorter than the sampling window are invisible.
Editorial extensions
If this is right
- If the 200 W of idle power per node is real, enabling software-controlled P-states on A100-class GPUs could remove a large share of Polaris's GPU power draw without touching active workloads.
- Because spatial RI is low for utilization and memory, power-saving strategies can be applied uniformly at the job level and monitored from a single node, which keeps implementation cost low.
- Since nearly 90% of jobs touch GPU memory less than a quarter of the time, memory clock gating or right-sizing GPU memory capacity offers a low-risk power optimization.
- GPU memory allocation is nearly uncorrelated with power, so capacity planning and power optimization can proceed independently, and utilization-aware strategies are the lever.
- The released open-source analysis tool and condensed dataset make the same 94%-compression workflow directly transferable to other supercomputers.
Reading between the lines
- A testable extension would be to re-run the pipeline with sub-second power sampling on a sample of jobs; if short power spikes are frequent, the reported 400 W average may understate true peak demand and change provisioning advice.
- Because GPU utilization as defined here counts any executing kernel, a job that keeps one low-occupancy kernel resident will look 100% utilized while drawing little power, so the paper's underutilization conclusions may actually understate how little work typical jobs do, and high utilization readings should be checked against power.
- The spatial-consistency result implies a per-node sampling architecture, but bursty temporal behavior suggests power-management state transitions must be fast relative to job phases; profiling phase lengths at finer time scales would tell whether P-state transitions pay off.
- The same co-analysis could be applied to other A100-based systems to see whether the idle-power dominance is a property of the GPU generation or of Polaris's scheduling and workload mix.
Editorial analysis
A structured set of objections, weighed in public.
Referee Report
Summary. This paper presents a data co-analysis pipeline for one year of Polaris supercomputer PBS job logs and GPU telemetry (DCGM-sampled every five seconds). The pipeline preprocesses 3.2 billion telemetry rows into per-job summaries, reducing data volume by 94%, and computes resource-imbalance (RI) coefficients for GPU utilization, memory utilization, and memory allocation. On the basis of these summaries, the authors report that node-level GPU power averages about 400 W with at least 200 W idle (Observation 1), that GPU utilization is low (75% of jobs use GPUs for at most half their runtime), that memory utilization is even lower, and that memory allocation is weakly correlated with power. They propose job-level power management, software P-state control, and memory-aware optimization as practical opportunities.
Significance. If substantiated, Observation 1 identifies a concrete and sizable source of avoidable energy on a production leadership-class system, and the proposed job-level power-management approach is plausible given the reported spatial consistency of utilization across nodes within jobs. The paper's strengths are its descriptive and reproducible design: no parameters are fitted, the RI methodology is adopted from prior work rather than invented for this study, and the authors commit to releasing both the per-job summary data and the ~500-line analysis tool, which would allow independent verification of the pipeline. The main limitation is that the headline power claims rest on metric provenance and an idle-power baseline that are not documented in the manuscript.
major comments (4)
- [§2.2, Tables 3–4] The paper defines total_power_mean and total_energy in Table 4 and plots mean node GPU power in Figure 4, but it never states the source of the power values, such as whether they come from DCGM per-GPU power readings, node-level PDU measurements, or HPCM-collected fields, nor how a GPU-only component is extracted from node-level power. Because Observation 1's 400 W average is the central empirical claim, this provenance gap must be closed by stating the exact field name, measurement chain, sampling interval, and any calibration, and by documenting the missing power metric in Table 3.
- [§2.1 and §4] The 'at least 200 W idle' part of Observation 1 is not a measured result: Section 2.1 gives 'idles at just over 50 W' as a static specification, and no later section reports measured idle power from telemetry or from a dedicated idle-phase experiment. The direction of the lower bound depends on an unverified assumption about production idle behavior. The authors should report the measured idle-power distribution, for example the lowest decile of per-GPU power during job runs or a dedicated idle-node measurement, and state the uncertainty around the 50 W/GPU value.
- [§2.2, §5.1] The five-second NVML GPU_load definition, which measures the percent of time any kernel is executing, cannot distinguish a GPU that is fully occupied by a low-occupancy kernel from one running near peak throughput, and power spikes shorter than the sample interval are not captured. This does not by itself invalidate the idle-power argument, but it weakens Observations 3 and 5 and the correlation-based power discussions; a robustness check against a higher-frequency or power-based activity measure is needed.
- [§3.2, §4–§7] All quantitative observations, such as '75% of jobs', '90% of jobs', and 'at least 200 W', are reported as exact statements without uncertainty or sensitivity bounds. Since the underlying telemetry has known sampling and definitional noise, the authors should provide error bars, bootstrap intervals, or a sensitivity analysis over the RI thresholds and the >2% GPU-count threshold used to define gpu_count.
minor comments (6)
- [§3.1] Typo: 'disperate' should be 'disparate', and 'datesets' in §2.2 should be 'datasets'.
- [§4] Typo: 'max TPD' should be 'max TDP'.
- [§3.2] The RI category boundaries [0, 0.2], (0.2, 0.6], and (0.6, 1] are presented without a citation or justification; since these thresholds directly determine the percentages in Observations 4, 6, and 9, the source of the thresholds should be stated explicitly.
- [§3] The GitHub link is given as '[link]'; the reproducibility claim in the abstract cannot be evaluated until the actual repository and dataset DOIs are provided.
- [Table 4] The units for total_energy are given as 'Kilojoules' with abbreviation 'KJ'; use consistent SI notation, i.e., 'kJ'.
- [Figures 6 and 9] The CDFs would be more informative with the number of jobs per class annotated in the figure or in an accompanying table, given the large differences in class sizes.
Circularity Check
No significant circularity; the paper presents descriptive telemetry summaries with no fitted parameters, no predictions derived from fitted inputs, and no load-bearing self-citations.
full rationale
The paper's central claims are observational summaries of GPU telemetry and job logs from Polaris. No parameter is fitted to a subset of data and then used to predict a closely related quantity; instead, the workflow aggregates sampled metrics into per-job statistics and reports correlations and imbalance coefficients. The RI thresholds are adopted from prior external work (Peng et al., Li et al.) and are not derived from the target results, so their use is dependence on external methodology rather than self-referential circularity. The two references sharing authors with this paper ([2] and [35]) are cited as contextual related work on scheduling and log analysis and are not load-bearing for the paper's observations. The most substantive limitation is the under-documentation of the power metric source and the reliance on the A100's ~50 W idle specification for the idle-power bound, but that is a verifiability and data-provenance concern, not a circularity concern. No equation or claim in the paper reduces to its own input by construction, so the appropriate circularity score is 0.
Assumptions & free parameters
free parameters (2)
- RI classification thresholds =
0.2 and 0.6
- GPU utilization threshold for gpu_count =
2% max GPU utilization
assumptions (4)
- domain assumption NVML/DCGM telemetry metrics (GPU_load, mem_util, mem_alloc) accurately reflect power-relevant GPU activity.
- domain assumption The 5-second sampling interval captures the temporal behavior relevant to job-level power patterns.
- domain assumption The resource imbalance definitions and category thresholds from prior work are transferable to GPU power analysis.
- domain assumption Idle power of ~50W per A100 GPU is a valid baseline for estimating the idle component of average job power.
Cite this review
Pith. "Pith review of Extracting Practical, Actionable Energy Insights from Supercomputer Telemetry and Logs." pith.science (2026). https://pith.science/paper/XCAXRBRL
@misc{pith2026250514796,
  author       = {Pith},
  title        = {Pith review of: Extracting Practical, Actionable Energy Insights from Supercomputer Telemetry and Logs},
  year         = {2026},
  howpublished = {\url{https://pith.science/paper/XCAXRBRL}},
  note         = {Machine review of arXiv:2505.14796}
}
read the original abstract
As supercomputers grow in size and complexity, power efficiency has become a critical challenge, particularly in understanding GPU power consumption within modern HPC workloads. This work addresses this challenge by presenting a data co-analysis approach using system data collected from the Polaris supercomputer at Argonne National Laboratory. We focus on GPU utilization and power demands, navigating the complexities of large-scale, heterogeneous datasets. Our approach, which incorporates data preprocessing, post-processing, and statistical methods, condenses the data volume by 94% while preserving essential insights. Through this analysis, we uncover key opportunities for power optimization, such as reducing high idle power costs, applying power strategies at the job-level, and aligning GPU power allocation with workload demands. Our findings provide actionable insights for energy-efficient computing and offer a practical, reproducible approach for applying existing research to optimize system performance.
Figures


Figures from the paper (10 more)


Reference graph
Works this paper leans on
-
[1]
Yuki Abe, Hiroshi Sasaki, Martin Peres, Koji Inoue, Kazuaki Murakami, and Shin- pei Kato. 2012. Power and Performance Analysis of GPU-Accelerated Systems. In Proceedings of the 4th USENIX Workshop on Power-A ware Computing and Sys- tems (HotPower’12). https://www.usenix.org/conference/hotpower12/workshop- program/presentation/abe
work page 2012
-
[2]
William Allcock, Paul Rich, Yuping Fan, and Zhiling Lan. 2018. Experience and Practice of Batch Scheduling on Leadership Supercomputers at Argonne. In Job Scheduling Strategies for Parallel Processing , Dalibor Klusáček, Walfredo Cirne, and Narayan Desai (Eds.). Springer International Publishing
work page 2018
-
[3]
Tyler Allen and Rong Ge. 2016. Characterizing Power and Performance of GPU Memory Access. In 2016 4th International Workshop on Energy Efficient Supercomputing (E2SC). 46–53. doi:10.1109/E2SC.2016.012
-
[4]
Apache Software Foundation. 2024. Apache Kafka. https://kafka.apache.org Accessed: 2025-02-27
work page 2024
-
[5]
Eishi Arima, Minjoon Kang, Issa Saba, Josef Weidendorfer, Carsten Trinitis, and Martin Schulz. 2023. Optimizing Hardware Resource Partitioning and Job Allocations on Modern GPUs under Power Caps. In Workshop Proceedings of the 51st International Conference on Parallel Processing (Bordeaux, France) (ICPP Workshops ’22). Association for Computing Machinery,...
-
[6]
Bridges, Neena Imam, and Tiffany M
Robert A. Bridges, Neena Imam, and Tiffany M. Mintz. 2016. Understanding GPU Power: A Survey of Profiling, Modeling, and Simulation Methods. ACM Comput. Surv. 49, 3, Article 41 (Sept. 2016), 27 pages. doi:10.1145/2962131
doi:10.1145/2962131 2016
-
[7]
George Casella and Roger L. Berger. 2002. Statistical Inference (2nd ed.). Duxbury Press
work page 2002
-
[8]
Yann Collet. 2016. Zstandard - Fast real-time compression algorithm. https: //facebook.github.io/zstd/. Accessed: 2025-04-13
work page 2016
Show all 37 references
-
[9]
NVIDIA Corporation. 2011. Enabling High Performance Graphics Rendering on Optimus Systems. https://developer.download.nvidia.com/devzone/devcenter/ gamegraphics/files/OptimusRenderingPolicies.pdf Accessed: 2025-02-26
2011
-
[10]
NVIDIA Corporation. 2025. NVAPI GPU P-State Documentation. https://docs.nvidia.com/gameworks/content/gameworkslibrary/coresdk/ nvapi/group__gpupstate.html Accessed: 2025-02-23
2025
-
[11]
NVIDIA Corporation. 2025. NVAPI GPU P-state Reference. https: //docs.nvidia.com/gameworks/content/gameworkslibrary/coresdk/nvapi/ group__gpupstate.html Accessed: 2025-02-26
2025
-
[12]
Hariharan Devarajan and Kathryn Mohror. 2022. Extracting and characterizing I/O behavior of HPC workloads. In 2022 IEEE International Conference on Cluster Computing (CLUSTER). 243–255. doi:10.1109/CLUSTER51413.2022.00037
2022
-
[13]
Jinghua Feng, Guangming Liu, Jian Zhang, Zhiwei Zhang, Jie Yu, and Zhaoning Zhang. 2018. Workload Characterization and Evolutionary Analyses of Tianhe- 1A Supercomputer. In Computational Science – ICCS 2018 , Yong Shi, Haohuan Fu, Yingjie Tian, Valeria V. Krzhizhanovskaya, Mic...
2018
-
[14]
IBM Corporation. 2024. IBM Db2 Database. https://www.ibm.com/products/db2 Accessed: 2025-02-27
2024
-
[15]
Bhuyan, and Daniel Wong
Ziyang Jia, Laxmi N. Bhuyan, and Daniel Wong. 2024. PCCL: Energy-Efficient LLM Training with Power-Aware Collective Communication. In2024 IEEE 42nd In- ternational Conference on Computer Design (ICCD). 84–91. doi:10.1109/ICCD63220. 2024.00023
2024
-
[16]
Ahmad Maroof Karimi, Matthias Maiterth, Woong Shin, Naw Safrin Sattar, Hao Lu, and Feiyi Wang. 2024. Exploring the Frontiers of Energy Efficiency using Power Management at System Scale. In SC24-W: Workshops of the International Conference for High Performance Computing, Networ...
2024
-
[17]
Siu Kwan Lam, Antoine Pitrou, and Stanley Seibert. 2015. Numba: A LLVM-based Python JIT compiler. Proceedings of the Second Workshop on the LLVM Compiler Infrastructure in HPC (2015), 1–6
2015
-
[18]
Baolin Li, Rohin Arora, Siddharth Samsi, Tirthak Patel, William Arcand, David Bestor, Chansup Byun, Rohan Basu Roy, Bill Bergeron, John Holodnak, Michael Houle, Matthew Hubbell, Michael Jones, Jeremy Kepner, Anna Klein, Peter Michaleas, Joseph McDonald, Lauren Milechin, Julie ...
2022
-
[19]
Jie Li, George Michelogiannakis, Brandon Cook, Dulanya Cooray, and Yong Chen. 2023. Analyzing Resource Utilization in HPC System: A Case Study of NERSC’s Perlmutter. In High Performance Computing: 38th International Con- ference, ISC High Performance 2023, Hamburg, Germany, Ma...
2023 doi
-
[20]
Samuel Maloney, Estela Suarez, Norbert Eicker, Filipe Guimarães, and Wolfgang Frings. 2024. Analyzing HPC Monitoring Data With a View Towards Efficient Resource Utilization. In 2024 IEEE 36th International Symposium on Computer Architecture and High Performance Computing (SBAC...
2024
-
[21]
Wes McKinney. 2010. Data structures for statistical computing in Python. Pro- ceedings of the 9th Python in Science Conference 445 (2010), 51–56
2010
-
[22]
Alessio Netti, Woong Shin, Michael Ott, Torsten Wilde, and Natalie Bates. 2021. A Conceptual Framework for HPC Operational Data Analytics. In 2021 IEEE International Conference on Cluster Computing (CLUSTER) . 596–603. doi:10.1109/ Cluster48925.2021.00086
2021
-
[23]
Nvidia Corporation. 2024. NVAPI Reference Documentation | GPU Performance State Interface. https://docs.nvidia.com/gameworks/content/gameworkslibrary/ coresdk/nvapi/group__gpupstate.html
2024
-
[24]
NVIDIA Corporation. 2025. NVIDIA Management Library (NVML) API Reference . Accessed: February 5, 2025
2025
-
[25]
Tirthak Patel, Zhengchun Liu, Raj Kettimuthu, Paul Rich, William Allcock, and Devesh Tiwari. 2020. Job Characteristics on Large-Scale Systems: Long-Term Analysis, Quantification, and Implications. In SC20: International Conference for High Performance Computing, Networking, St...
2020 arXiv
-
[26]
Tirthak Patel, Adam Wagenhäuser, Christopher Eibel, Timo Hönig, Thomas Zeiser, and Devesh Tiwari. 2020. What does Power Consumption Behavior of HPC Jobs Reveal? : Demystifying, Quantifying, and Predicting Power Consumption Characteristics. In 2020 IEEE International Parallel a...
2020
-
[27]
Karl Pearson and Francis Galton. 1895. VII. Note on regression and inheritance in the case of two parents. Proceedings of the Royal So- ciety of London 58, 347-352 (1895), 240–242. doi:10.1098/rspl.1895.0041 arXiv:https://royalsocietypublishing.org/doi/pdf/10.1098/rspl.1895.0041
-
[28]
Ivy Peng, Ian Karlin, Maya Gokhale, Kathleen Shoga, Matthew Legendre, and Todd Gamblin. 2022. A Holistic View of Memory Utilization on HPC Systems: Current and Future Trends. In Proceedings of the International Symposium on Memory Systems (Washington DC, DC, USA) (MEMSYS ’21) ...
2022
-
[29]
Siddharth Samsi, Matthew L Weiss, David Bestor, Baolin Li, Michael Jones, Al- bert Reuther, Daniel Edelman, William Arcand, Chansup Byun, John Holod- nack, Matthew Hubbell, Jeremy Kepner, Anna Klein, Joseph McDonald, Adam Michaleas, Peter Michaleas, Lauren Milechin, Julia Mull...
2021
-
[30]
Badrudduza, and Lawrence T
Giby Samson, Nagaraj Ananthapadmanabhan, Sayeed A. Badrudduza, and Lawrence T. Clark. 2008. Low-Power Dynamic Memory Word Line Decoding for Static Random Access Memories. IEEE Journal of Solid-State Circuits 43, 11 (2008), 2524–2532. doi:10.1109/JSSC.2008.2005813
2008
-
[31]
Pavel Shvets, Vadim Voevodin, and Dmitry Nikitenko. 2020. Approach to Work- load Analysis of Large HPC Centers. In Parallel Computational Technologies , Leonid Sokolinsky and Mikhail Zymbler (Eds.). Springer International Publish- ing, Cham, 16–30
2020
-
[32]
Skinner and W
D. Skinner and W. Kramer. 2005. Understanding the causes of performance variability in HPC workloads. In IEEE International. 2005 Proceedings of the IEEE Workload Characterization Symposium, 2005. 137–149. doi:10.1109/IISWC.2005. 1526010
2005 doi
-
[33]
TOP500. 2024. June 2024 | TOP500. https://top500.org/lists/top500/2024/06/ 11 SC25, Nov. 16–21, 2025, St. Louis, USA Melanie Cornelius, Greg Cross, Shilpika, Matthew T. Dearing, and Zhiling Lan
2024
-
[34]
Oznur Ozkasap Tuncer, William Kramer, Ata Turk, James M Brandt, and Sarp Oral. 2017. A Big Data Analytics Framework for HPC Log Data: Three Case Studies Using the Titan Supercomputer Log. In2017 IEEE International Conference on Cluster Computing (CLUSTER) . IEEE, 758–765. doi:...
2017 doi
-
[35]
Allcock, Susan Cogh- lan, Michael E
Sean Wallace, Xu Yang, Venkatram Vishwanath, William E. Allcock, Susan Cogh- lan, Michael E. Papka, and Zhiling Lan. 2016. A Data Driven Scheduling Approach for Power Management on HPC Systems. InSC ’16: Proceedings of the International Conference for High Performance Computin...
2016 doi
-
[36]
Grant Wilkins, Srinivasan Keshav, and Richard Mortier. 2024. Hybrid Heteroge- neous Clusters Can Lower the Energy Consumption of LLM Inference Workloads. In Proceedings of the 15th ACM International Conference on Future and Sustainable Energy Systems (Singapore, Singapore) (e-...
2024
-
[37]
Zhengji Zhao, Ermal Rrapaj, Sridutt Bhalachandra, Brian Austin, Hai Ah Nam, and Nicholas Wright. 2023. Power Analysis of NERSC Production Workloads. In Proceedings of the SC ’23 Workshops of The International Conference on High Performance Computing, Network, Storage, and Anal...
2023
Reviewed August 7, 2026 · model on record in the stance chip above.
Discussion (0). Continue with ORCID to comment.