REVIEW 4 major objections 5 minor 33 references
Coincident Learning for Beam-based RF Station Fault Identification Using Phase Information at the SLAC Linac Coherent Light Source
T0 review · 4 major / 5 minor · reviewed 2026-08-07 · deepseek-v4-flash
Pith's one-line read At SLAC's LCLS, Coincident Anomaly Detection on fast RF phase data finds 482 confirmed station faults versus 185 for amplitude data, and clusters the signatures into distinct fault families.
desk verdict Solid applied extension of CoAD to phase data with a credible 3x detection gain; main caveats are the pipeline-level comparison and an untested independence assumption. read the letter →
The pith
A machine-rendered reading of the paper's core claim, the machinery that carries it, and where it could break.
The reading
What carries the argument
The load-bearing mechanism is the Coincident Anomaly Detection principle: in normal operation the RF station diagnostic stream $s$ (here, phase) and the beam quality stream $q$ (position and charge from four BPMs) fluctuate independently, but a genuine fault makes both change at the same instant. CoAD trains two neural networks $A_{\theta_s}(s)$ and $A_{\theta_q}(q)$ to output anomaly confidences $p_s, p_q \in [0,1]$, optimizing the unsupervised $\hat{F}_\beta$ objective (with $\beta = \infty$ this reduces to the covariance between the two scores), so the networks learn to flag only the simultaneous changes that causal faults produce. A candidate-generation stage first uses a MAD-based beam anomaly score with geometric-mean aggregation to isolate candidate time windows, then selects the five RF stations whose phase deviates most from zero (after subtracting the fifth-largest phase to suppress system-level faults), pairing each station's phase with the beam window for CoAD.
What would settle it
Run the trained CoAD pair on a stretch of operation that operators and status bits agree was entirely healthy and count the anomalies it flags; if phase and BPM signals show correlated motion during normal running, or if the false-positive rate on clean data is far above the roughly one-percent rate reported on the candidate set, the coincidence principle fails. A second check is to repeat the January 19-31, 2024 analysis on another month and see whether the near-threefold gain of phase over amplitude reproduces.
Extended reading notes
Core claim
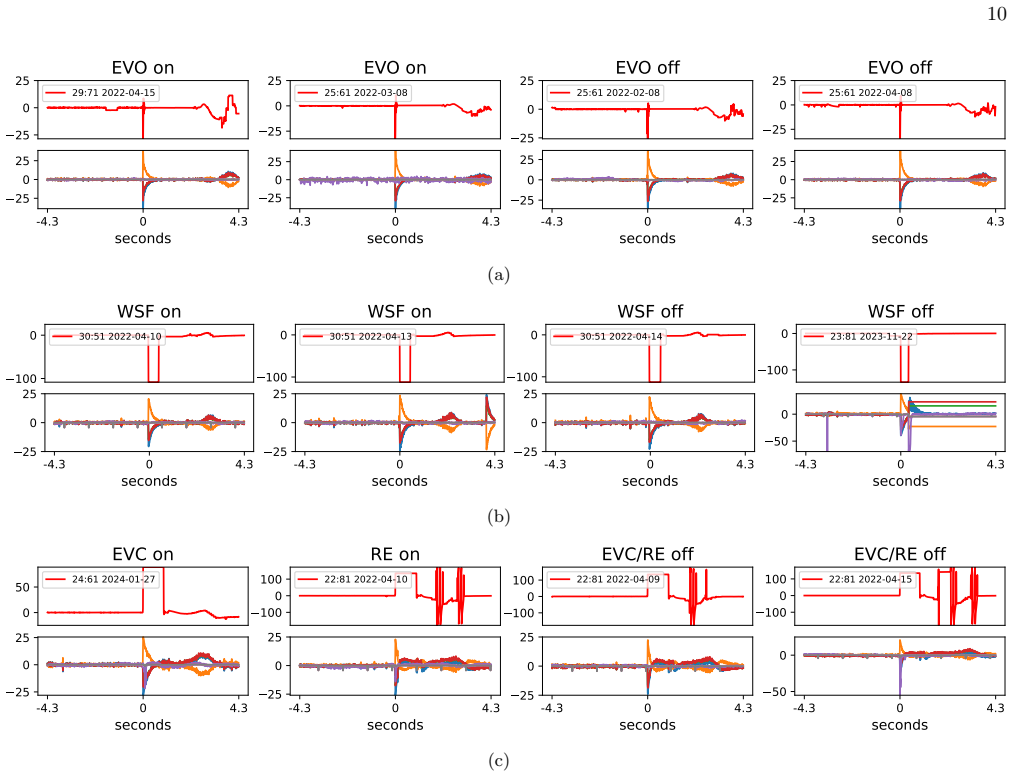
The paper's central claim is that the RF station phase stream at LCLS, recorded at the full 120 Hz beam rate and time-synchronized with beam position monitors, carries far more fault information than the low-rate asynchronous amplitude stream, and that deep neural networks trained with the Coincident Anomaly Detection objective can extract it without any fault labels. Over a thirteen-day operating window the method confirmed 482 anomalies from phase data versus 185 from amplitude data with essentially equal precision (about 88%), roughly tripling detected faults and covering stations — including critical injector stations in sector 20 — that amplitude data cannot see. The same phase signatures, embedded and clustered with UMAP and HDBSCAN, separate into groups whose shapes match specific modulator and water-system faults: a wave-like oscillation about 3 to 4 seconds after the initial spike identifies modulator EVOC overcurrent faults, a sharp rectangular drop of more than 100 degrees marks water summary faults, and a rectangular jump of about 100 degrees followed by ringing tags EOLC and reflected-energy faults. The paper takes this as evidence that phase data supports both broader detection and root-cause analysis.
Load-bearing premise
The load-bearing premise is that RF phase and beam-position signals are statistically independent during normal operation and move together only during genuine faults; if ordinary running ever makes them fluctuate together, through RF feedback, energy jitter, or slow drift, the detector will call healthy operation anomalous, and the paper does not test this assumption on held-out known-normal data.
Editorial extensions
If this is right
- Phase-based CoAD detection roughly triples the number of expert-confirmed RF faults found in the same operating window (482 vs 185) at comparable precision, and recovers faults in stations, such as the injector sector, that amplitude monitoring entirely misses.
- Anomalous phase signals cluster into families that line up with specific fault mechanisms — modulator EVO, EOLC, reflected energy, and water summary faults — so operators receive a short list of likely root causes rather than a bare alarm.
- CoAD beats classical baselines (CCA, isolation forest, OCSVM) and deep baselines (DGHL, OmniAnomaly) on phase data, and its performance stays stable across threshold-selection methods, so it can set its own operating threshold without labels.
- RF hardware status bits have limited recall: phase-visible anomalies with the same signature as known faults often have inactive status bits, meaning phase data surfaces genuine faults the hardware interlocks miss.
- Shapley-value analysis confirms the networks attend to the center of the candidate window as designed, and exposes a concrete failure mode — ignoring the window's overall variance — that suggests adding a standard-deviation feature to suppress false positives from repetitive spikes.
Reading between the lines
- The paper's own appendix implies that thousands of repeated-spike faults per day on a single station fall below the candidate-generation threshold, so the headline recall figures cover only the harder faults; a separate low-threshold jitter channel would be needed to monitor persistent instability.
- The coincidence structure is exactly what other accelerator subsystems need — magnet power supplies, vacuum, and other RF hardware all have a fast local signal that should move in lockstep with beam quality only when something breaks — so the two-stream CoAD recipe could port directly to those systems.
- Because status bits sample at only 0.2 Hz while phase data runs at 120 Hz, the phase-derived fault signatures could be used to recalibrate the hardware interlock triggers, turning a detection channel into a better alarm source.
Editorial analysis
A structured set of objections, weighed in public.
Referee Report
Summary. The paper presents a two-stage unsupervised pipeline for RF station fault identification at LCLS: candidate generation selects time windows from BPM anomaly scores and then selects the most anomalous RF station(s), and Coincident Anomaly Detection (CoAD) is trained on paired phase/BPM windows. On a 12-day operational dataset the authors report that the phase-based pipeline identifies 482 true anomalies versus 185 for an amplitude-based pipeline, with claimed precision around 88% for both and recall of 87% versus 78%. They further cluster the anomalous phase signals with UMAP/HDBSCAN and associate clusters with status bits such as EVO, WSF, EVC, and RE, and use Shapley values to show that the model focuses on the center of the time window. The central claim is that phase data, analyzed with deep CoAD models, detects substantially more RF anomalies than amplitude data and provides root-cause-relevant signatures.
Significance. If the claims hold, the work would offer a practical, label-free improvement in RF fault detection at LCLS, with broader station coverage and potential diagnostic insight from phase signatures. The paper has notable strengths: it uses real operational data from a running accelerator, requires no labeled fault examples and no clean training set, benchmarks against several baselines, and provides interpretability and clustering analyses. The reported threefold improvement is an important operational result for the accelerator physics community. However, the evaluation depends on several assumptions and methodological choices that are not fully validated, so the significance of the headline result is currently contingent on additional evidence.
major comments (4)
- [IV B] The CoAD coincidence principle assumes that 'fluctuations in s and q are uncorrelated during normal operating conditions.' This assumption is load-bearing and is not validated on held-out normal data. The four BPMs used are explicitly described as located in dispersive regions and sensitive to beam energy (Section III A), while RF phase directly sets the beam energy. Normal pulse-to-pulse phase jitter can therefore produce correlated phase and BPM signals. Because candidate generation (Section IV A) already selects high-BPM-anomaly windows and the station selection step (Appendix C) further enriches for large phase deviations, CoAD is applied to a set that may be concentrated in exactly these correlated-but-healthy excursions. The reported 482 phase anomalies could be inflated by false positives from normal correlated operation. I request a concrete test: run the pipeline on known fault-free periods, or use a shuffled/phase-shifted alignment between BPM and phase streams as a negative control, and report the anomaly rates.
- [V A, footnote 1] Recall is computed only on the anomaly candidate dataset and is extrapolated from 300 negative examples. The footnote states this explicitly, but the abstract and conclusion do not carry this caveat, and the headline 'nearly three times as many anomalies' depends on treating these numbers as operational recall. Appendix A further shows that repeated spike faults are deliberately excluded from the candidate set and are labeled as normal samples during labeling; these are known anomalies in the 'negative' pool. This makes the claimed false-negative rate of about 1% unreliable as an estimate of true operational recall. The authors should either provide a held-out period with complete manual labels or rephrase all recall and '3x' claims as candidate-conditional metrics.
- [V A and Fig. 2] The comparison between phase and amplitude is a comparison of two full pipelines whose candidate generation differs: the phase-based pipeline selects stations using phase deviations (Appendix C), while the amplitude-based pipeline uses amplitude-based station selection. The number of final anomalies can therefore differ because the candidate sets differ, not only because phase carries more information. To support the claim that phase data is responsible for the improvement, the authors should either apply identical candidate-generation logic to both data streams or report the anomaly counts conditioned on matched candidate sets.
- [V A, Table II] Precision and recall values are based on manual expert inspection without reported inter-labeler agreement or uncertainty estimates. The 88.52% versus 87.95% precision difference is within any reasonable labeling noise, and the recall extrapolation from 300 negatives has no confidence interval. At minimum, the paper should state the labeling protocol in more detail and provide error bars or a sensitivity analysis for the main counts.
minor comments (5)
- [III B, Table I] The column header 'Current' is ambiguous; consider renaming it 'This work' to match the preceding column.
- [Fig. 1] The figure caption and axis labels are minimal; the units for the phase and BPM signals and the meaning of the time axis should be stated explicitly.
- [Appendix C, Algorithm 1] The station-specific trigger times t_n^i are used in Algorithm 1 but are not defined before the algorithm; please clarify how they are obtained for each station.
- [V D] The text describing subplot (c) of Fig. 7 says the model 'incorrectly classifies a normal sample as an anomaly,' which is the same as a false positive; consider using consistent terminology throughout.
- [II] The related-work section would benefit from a brief comparison to [2] on the same LCLS dataset, since [2] is the direct predecessor and the reader needs to know exactly what is new beyond the use of phase data.
Circularity Check
No circular derivation: phase-based anomaly counts are externally validated by manual labels and benchmarked baselines; self-citations to prior CoAD work are not load-bearing.
full rationale
The central claims are empirical, not definitional. The phase-vs-amplitude comparison is measured on operational data and checked against expert manual inspection (Section V A: 'predicts 548 anomalies, of which 482 are true anomalies, yielding a precision of 87.95%') and against SLAC CATER fault records and status bits (Section V C). The CoAD method and the Fβ/covariance objective are adopted from the authors' prior paper [2], and the data filtering protocol from [1]; these are applications of previously published methods, not arguments that assume the present result. CoAD is additionally benchmarked in this paper against CCA, IForest, OCSVM, DGHL, and OmniAnomaly (Table III), so the method's effectiveness does not rest solely on a self-citation. The candidate-generation stage does preselect time windows using BPM anomaly scores and RF stations using phase deviation, so phase anomalies are not mined from raw data with no guidance; however, the final labels are confirmed by independent manual review and status-bit associations, and no fitted parameter is renamed as a prediction. The main caveat is not circularity but validity: Section IV B asserts that 'fluctuations in s and q are uncorrelated during normal operating conditions,' yet the four BPMs are in dispersive regions and RF phase directly sets beam energy, so normal pulse-to-pulse correlated jitter could in principle inflate the phase anomaly count. This unvalidated independence assumption is a correctness risk and should be weighed in the verdict, but it does not make the derivation equivalent to its inputs. No equation-level or definitional reduction, and no load-bearing uniqueness theorem imported from the authors, was found.
Assumptions & free parameters
free parameters (5)
- Anomaly fraction estimate alpha for CoAD objective =
not reported
- BPM candidate threshold tau =
not reported
- Station phase deviation threshold tau =
25 degrees
- Window size w =
~530 samples (4.3 s)
- Rolling MAD window l and aggregation k =
not reported
assumptions (4)
- domain assumption During normal operation, fluctuations in RF phase and BPM signals are uncorrelated; during faults, both change simultaneously.
- domain assumption The BOCPD-based filtering and 'healthy conditions' protocol from [1] correctly identify and exclude bad data periods.
- domain assumption Manual expert inspection provides reliable ground truth for anomaly labels.
- domain assumption Status bits, despite known low recall, are informative enough to associate clusters with fault types.
Cite this review
Pith. "Pith review of Coincident Learning for Beam-based RF Station Fault Identification Using Phase Information at the SLAC Linac Coherent Light Source." pith.science (2026). https://pith.science/paper/3AML7LGH
@misc{pith2026250516052,
  author       = {Pith},
  title        = {Pith review of: Coincident Learning for Beam-based RF Station Fault Identification Using Phase Information at the SLAC Linac Coherent Light Source},
  year         = {2026},
  howpublished = {\url{https://pith.science/paper/3AML7LGH}},
  note         = {Machine review of arXiv:2505.16052}
}
read the original abstract
Anomalies in radio-frequency (RF) stations can result in unplanned downtime and performance degradation in linear accelerators such as SLAC's Linac Coherent Light Source (LCLS). Detecting these anomalies is challenging due to the complexity of accelerator systems, high data volume, and scarcity of labeled fault data. Prior work identified faults using beam-based detection, combining RF amplitude and beam-position monitor data. Due to the simplicity of the RF amplitude data, classical methods are sufficient to identify faults, but the recall is constrained by the low-frequency and asynchronous characteristics of the data. In this work, we leverage high-frequency, time-synchronous RF phase data to enhance anomaly detection in the LCLS accelerator. Due to the complexity of phase data, classical methods fail, and we instead train deep neural networks within the Coincident Anomaly Detection (CoAD) framework. We find that applying CoAD to phase data detects nearly three times as many anomalies as when applied to amplitude data, while achieving broader coverage across RF stations. Furthermore, the rich structure of phase data enables us to cluster anomalies into distinct physical categories. Through the integration of auxiliary system status bits, we link clusters to specific fault signatures, providing additional granularity for uncovering the root cause of faults. We also investigate interpretability via Shapley values, confirming that the learned models focus on the most informative regions of the data and providing insight for cases where the model makes mistakes. This work demonstrates that phase-based anomaly detection for RF stations improves both diagnostic coverage and root cause analysis in accelerator systems and that deep neural networks are essential for effective analysis.
Figures


Figures from the paper (7 more)




Reference graph
Works this paper leans on
-
[1]
can be effective, but requires significant effort and manual data inspection to choose the right hyperparam- eters. Shifts in data distribution over time can make the selected hyperparameters—and, consequently, the algo- rithm—ineffective. More critically, the classical approach has only been applied to the low-rate amplitude data stream. The full-rate ph...
work page Pith review arXiv 2025
-
[2]
cross-reference BPM data with RF AMM/AMPL data to detect RF anomalies. B. Phase data In this work, we aim to leverage phase data from the RF station subsystem(s) to detect RF anomalies. To en- sure stable acceleration, the RF oscillations must align precisely with the periodic arrival of the particle beam in the cavity. The particle’s arrival time relativ...
work page 2024
-
[3]
Anomaly Detection of Particle Orbit in Accelerator using LSTM Deep Learning Technology
Zhiyuan Chen, Wei Lu, Radhika Bhong, Yimin Hu, Brian Freeman, and Adam Carpenter. Anomaly detection of particle orbit in accelerator using lstm deep learning tech- nology. arXiv preprint arXiv:2401.15543 , 2024
work page Pith review arXiv 2024
-
[4]
Beam-based rf station fault identification at the slac linac coherent light source
Ryan Humble, Finn H O’Shea, William Colocho, Matt Gibbs, Helen Chaffee, Eric Darve, and Daniel Ratner. Beam-based rf station fault identification at the slac linac coherent light source. Physical Review Accelerators and Beams, 25(12):122804, 2022
work page 2022
-
[5]
Coincident learning for unsupervised anomaly detection of scientific instruments
Ryan Humble, Zhe Zhang, Finn O’Shea, Eric Darve, and Daniel Ratner. Coincident learning for unsupervised anomaly detection of scientific instruments. Machine Learning: Science and Technology, 5(3):035036, 2024
work page 2024
-
[6]
Willem Blokland, Kishansingh Rajput, Malachi Schram, Torri Jeske, Pradeep Ramuhalli, Charles Peters, Yigit Yucesan, and Alexander Zhukov. Uncertainty aware anomaly detection to predict errant beam pulses in the oak ridge spallation neutron source accelerator. Physical Review Accelerators and Beams, 25(12):122802, 2022
work page 2022
-
[7]
A smart alarm for particle accelera- tor beamline operations
Chris Tennant, Brian Freeman, Reza Kazimi, Daniel Moser, Dan Abell, Jonathan Edelen, and Joshua Einstein-Curtis. A smart alarm for particle accelera- tor beamline operations. Machine Learning: Science and Technology, 4(1):015021, 2023
work page 2023
-
[8]
Time-series deep learning anomaly detection for parti- cle accelerators
Davide Marcato, Damiano Bortolato, Valentina Mar- tinelli, Giovanni Savarese, and Gian Antonio Susto. Time-series deep learning anomaly detection for parti- cle accelerators. IF AC-PapersOnLine, 56(2):1566–1571, 2023
work page 2023
Show all 33 references
-
[9]
Robust errant beam prognostics with conditional modeling for particle ac- celerators
Kishansingh Rajput, Malachi Schram, Willem Blokland, Yasir Alanazi, Pradeep Ramuhalli, Alexander Zhukov, Charles Peters, and Ricardo Vilalta. Robust errant beam prognostics with conditional modeling for particle ac- celerators. Machine Learning: Science and Technology , 5(1):0...
2024
-
[10]
Long short-term memory networks for anomaly detection in magnet power supplies of particle accelerators
Ihar Lobach and Michael Borland. Long short-term memory networks for anomaly detection in magnet power supplies of particle accelerators. arXiv preprint arXiv:2405.18321, 2024
2024 arXiv
-
[11]
Machine-learning-based pressure- anomaly detection system for superkekb accelerator
Yusuke Suetsugu. Machine-learning-based pressure- anomaly detection system for superkekb accelerator. Physical Review Accelerators and Beams , 27(6):063201, 2024
2024
-
[12]
Particle accel- erator power system early fault diagnosis based on deep learning and multi-sensor feature fusion
Zhou Jiqing, Li Deming, and Su Haijun. Particle accel- erator power system early fault diagnosis based on deep learning and multi-sensor feature fusion. Engineering Re- search Express, 6(2):025225, 2024
2024
-
[13]
Early fault detection in particle accelerator power electronics using ensemble learning
Majdi I Radaideh, Chris Pappas, Mark Wezensky, Pradeep Ramuhalli, and Sarah Cousineau. Early fault detection in particle accelerator power electronics using ensemble learning. International Journal of Prognostics and Health Management , 14(1), 2023
2023
-
[14]
Accelerating cavity fault predic- tion using deep learning at jefferson laboratory
Md M Rahman, Adam Carpenter, Khan Iftekharuddin, and Chris Tennant. Accelerating cavity fault predic- tion using deep learning at jefferson laboratory. Machine Learning: Science and Technology, 5(3):035078, 2024
2024
-
[15]
Anomaly de- tection in particle accelerators using autoencoders
Jonathan P Edelen and Nathan M Cook. Anomaly de- tection in particle accelerators using autoencoders. arXiv preprint arXiv:2112.07793, 2021
2021 arXiv
-
[16]
Few-shot fault diagnosis of particle accelerator power system using a bidirectional discriminative prototype network
Zhe Yang, Rongbing Ye, Lingli Jiang, Jianyu Long, Yun- wei Huang, and Chuan Li. Few-shot fault diagnosis of particle accelerator power system using a bidirectional discriminative prototype network. Applied Soft Comput- ing, 170:112726, 2025
2025
-
[17]
A machine learning approach for particle accelerator errant beam prediction using spatial phase deviation
Yigit A Yucesan, Willem Blokland, Pradeep Ramuhalli, Alexander Zhukov, Charles Peters, David Brown, and Cary Long. A machine learning approach for particle accelerator errant beam prediction using spatial phase deviation. Nuclear Instruments and Methods in Physics Research Sec...
2024
-
[18]
Pyrcca: regular- ized kernel canonical correlation analysis in python and its applications to neuroimaging
Natalia Y Bilenko and Jack L Gallant. Pyrcca: regular- ized kernel canonical correlation analysis in python and its applications to neuroimaging. Frontiers in neuroin- formatics, 10:49, 2016
2016
-
[19]
Lcls beam- position monitor data acquisition system
T Straumann, R Akre, RG Johnson, D Kotturi, P Kre- jcik, E Medvedko, J Olsen, and S Smith. Lcls beam- position monitor data acquisition system. Proceedings of ICALEPCS07, Knoxville, Tennessee, USA , 2007
2007
-
[20]
Bayesian online changepoint detection
Ryan Prescott Adams and David JC MacKay. Bayesian online changepoint detection. arXiv preprint arXiv:0710.3742, 2007
2007 arXiv
-
[21]
One-class svms for document classification
Larry M Manevitz and Malik Yousef. One-class svms for document classification. Journal of machine Learning research, 2(Dec):139–154, 2001
2001
-
[22]
Tensor canonical correlation analysis
Eun Jeong Min, Eric C Chi, and Hua Zhou. Tensor canonical correlation analysis. Stat, 8(1):e253, 2019
2019
-
[23]
Isola- tion forest
Fei Tony Liu, Kai Ming Ting, and Zhi-Hua Zhou. Isola- tion forest. In 2008 eighth ieee international conference on data mining , pages 413–422. IEEE, 2008
2008
-
[24]
Filter- ing approaches for dealing with noise in anomaly detection
Navid Hashemi, Eduardo Verdugo German, Jonatan Pena Ramirez, and Justin Ruths. Filter- ing approaches for dealing with noise in anomaly detection. In 2019 IEEE 58th Conference on Decision and Control (CDC) , pages 5356–5361. IEEE, 2019
2019
-
[25]
Deep generative model with hierarchical latent factors for time series anomaly detection
Cristian I Challu, Peihong Jiang, Ying Nian Wu, and Laurent Callot. Deep generative model with hierarchical latent factors for time series anomaly detection. In Inter- national Conference on Artificial Intelligence and Statis- tics, pages 1643–1654. PMLR, 2022
2022
-
[26]
Robust anomaly detection for multivariate time series through stochastic recurrent neural network
Ya Su, Youjian Zhao, Chenhao Niu, Rong Liu, Wei Sun, and Dan Pei. Robust anomaly detection for multivariate time series through stochastic recurrent neural network. In Proceedings of the 25th ACM SIGKDD international conference on knowledge discovery & data mining , pages 2828...
2019
-
[27]
Umap: Uniform manifold approximation and projection for di- mension reduction
Leland McInnes, John Healy, and James Melville. Umap: Uniform manifold approximation and projection for di- mension reduction. arXiv preprint arXiv:1802.03426 , 2018
2018 arXiv
-
[28]
Automat- ing outlier detection via meta-learning
Yue Zhao, Ryan A Rossi, and Leman Akoglu. Automat- ing outlier detection via meta-learning. arXiv preprint arXiv:2009.10606, 2020
2009 arXiv
-
[29]
As shown in Fig
at SLAC—a system where operators manually record faults and their resolutions—indicated that station 23:81 experienced a water leak fault, and the embeddings of its anomalous phase signals lie within Region C. As shown in Fig. 5, nearly all Modulator EVOC Faults are grouped in...
2024
-
[30]
Application of mixture models to threshold anomaly scores
Willem van Veluw. Application of mixture models to threshold anomaly scores. Master’s thesis, Utrecht Uni- versity, 2023
2023
-
[31]
hdbscan: Hierarchical density based clustering
Leland McInnes, John Healy, Steve Astels, et al. hdbscan: Hierarchical density based clustering. J. Open Source Softw., 2(11):205, 2017
2017
-
[32]
Integrated management tool for controls software problems, requests and project 16 tasking at slac
D Rogind, W Allen, W Colocho, G DeContreras, J Gor- don, P Pandey, and H Shoaee. Integrated management tool for controls software problems, requests and project 16 tasking at slac. Proceedings of ICALEPCS, 2011
2011
-
[33]
A unified approach to interpreting model predictions
Scott M Lundberg and Su-In Lee. A unified approach to interpreting model predictions. Advances in neural information processing systems, 30, 2017
2017
Reviewed August 7, 2026 · model on record in the stance chip above.
Discussion (0). Continue with ORCID to comment.