Full Two-Port S-Parameters at mK Temperatures: a Calibration Strategy and Uncertainty Budget
Pith reviewed 2026-05-19 13:34 UTC · model grok-4.3
The pith
A single-cycle Short-Open-Load-Reciprocal calibration referenced to room-temperature standards enables full two-port S-parameter measurements at millikelvin temperatures with a complete uncertainty budget.
A machine-rendered reading of the paper's core claim, the machinery that carries it, and where it could break.
Core claim
The system exploits the Short-Open-Load-Reciprocal technique to realize error-corrected cryogenic measurements within a single cooling cycle, with calibration standards referenced to SI-traceable room-temperature measurements and a numerical approach to evaluate response shift upon cooling for the uncertainty budget.
What carries the argument
Short-Open-Load-Reciprocal (SOLR) calibration combined with numerical modeling of the cryogenic response shift of the calibration standards.
If this is right
- Devices under test can receive full two-port error correction at mK temperatures without requiring separate warm-up and re-cool cycles for each calibration.
- Uncertainty budgets for cryogenic microwave measurements now include a traceable cryogenic contribution derived from the numerical shift model.
- The method supports coaxial measurements from 4 to 12 GHz at millikelvin temperatures with quantified uncertainties.
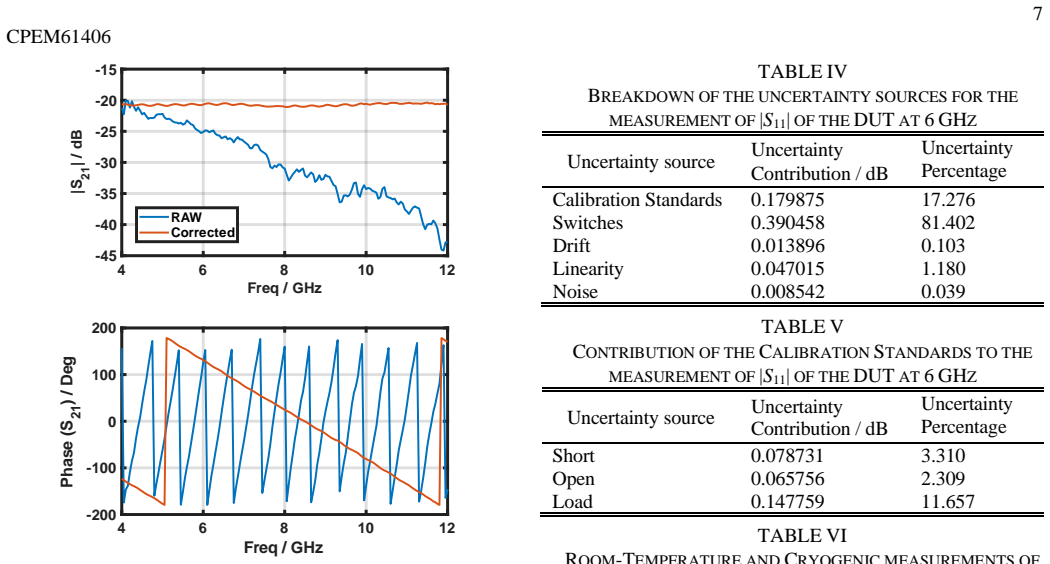
- Test results such as the 20.70 dB attenuation value at 6 GHz can be reported with an expanded uncertainty of 0.08 dB at 95 percent .
Where Pith is reading between the lines
- The approach could reduce the number of thermal cycles needed when characterizing multiple devices in the same cryostat.
- Similar numerical-shift corrections might be adapted to other calibration kits or frequency bands to extend traceable cryogenic metrology.
- Closing the remaining gap to full SI-traceable verification would require developing primary standards that can be measured directly at mK temperatures.
Load-bearing premise
The numerical approach accurately captures all relevant changes in the calibration artifacts when cooled and produces a valid additional uncertainty term without large unmodeled biases.
What would settle it
A direct comparison of the same attenuator measured both with this method and with an independent cryogenic reference standard at 6 GHz that shows a difference larger than the stated 0.08 dB uncertainty.
Figures


read the original abstract
This paper describes the developed setup and characterization approach for full two-port calibrated S-parameter measurements at cryogenic temperatures, together with a complete uncertainty budget. The system developed at the Istituto Nazionale di Ricerca Metrologica (INRiM, Italy), exploits the Short-Open-Load-Reciprocal technique to realize error-corrected cryogenic measurements within a single cooling cycle. The system operates down to mK temperatures over the 4-12 GHz band in coaxial line. Calibration standards are referenced to SI-traceable room-temperature measurements, while a numerical approach is used to evaluate the response shift of the artifacts upon cooling and to derive an additional cryogenic uncertainty contribution for the measurement uncertainty budget. Moreover, relevant measurement uncertainty contributions are evaluated according to internationally agreed procedures, and a comprehensive uncertainty budget is presented. Test measurements on a 20 dB attenuator are shown as an example. An attenuation of 20.70 +/- 0.08 dB (95% confidence interval) was obtained at 6 GHz. Full SI-traceable verification at mK temperatures remains an open challenge; however, an initial calibration verification is also presented.
Editorial analysis
A structured set of objections, weighed in public.
Referee Report
Summary. The manuscript presents a calibration strategy for full two-port S-parameter measurements at millikelvin temperatures (down to mK) over 4-12 GHz in coaxial line, using the Short-Open-Load-Reciprocal (SOLR) technique within a single cooling cycle. Room-temperature SI-traceable characterizations of the standards are combined with a numerical model to quantify response shifts upon cooling, which is incorporated into a comprehensive uncertainty budget following international procedures. A test result on a 20 dB attenuator at 6 GHz is reported as 20.70 ± 0.08 dB (95% confidence), with the authors explicitly noting that full SI-traceable verification at mK temperatures remains an open challenge.
Significance. If the numerical model for cryogenic response shifts is shown to capture relevant effects without significant bias, the work provides a practical, single-cycle approach to error-corrected S-parameter measurements that is valuable for quantum device characterization and low-temperature metrology. Strengths include the concrete numerical example with stated uncertainty, the explicit uncertainty budget, and honest acknowledgment of verification limitations; these elements support reproducibility and metrological transparency in the field.
major comments (2)
- [Numerical model for response shift] Section describing the numerical approach to evaluate the response shift of the artifacts upon cooling: The derivation of the additional cryogenic uncertainty contribution rests on this model. The manuscript does not specify which physical effects (e.g., frequency-dependent connector repeatability, dielectric loss variations, or possible superconducting transitions in the coaxial line) are included versus omitted, nor does it provide cross-validation against direct cryogenic measurements of the same standards. This is load-bearing for the central claim because an incomplete model could systematically underestimate the reported ±0.08 dB uncertainty at 6 GHz.
- [Test measurements] Test measurements and uncertainty budget section: The reported attenuation result of 20.70 ± 0.08 dB for the 20 dB attenuator at 6 GHz is presented as an example, but without independent cryogenic verification of the standards or explicit propagation steps showing how the numerical shift term combines with other contributions, the budget's completeness cannot be fully assessed.
minor comments (2)
- [Abstract] Abstract: The phrasing 'a numerical approach is used to evaluate the response shift... and to derive an additional cryogenic uncertainty contribution' would benefit from a single sentence summarizing the main assumptions of the model to aid reader assessment.
- Figure captions and legends: Ensure all plots of S-parameters or uncertainty components include explicit axis labels, units, and identification of which trace corresponds to the cryogenic correction term.
Simulated Author's Rebuttal
We thank the referee for the constructive comments and for recognizing the practical value of the single-cycle SOLR approach with SI-traceable room-temperature references. We respond point-by-point to the major comments below, providing clarifications on the numerical model and uncertainty budget. Where the comments identify areas for improved transparency, we will revise the manuscript accordingly.
read point-by-point responses
-
Referee: Section describing the numerical approach to evaluate the response shift of the artifacts upon cooling: The derivation of the additional cryogenic uncertainty contribution rests on this model. The manuscript does not specify which physical effects (e.g., frequency-dependent connector repeatability, dielectric loss variations, or possible superconducting transitions in the coaxial line) are included versus omitted, nor does it provide cross-validation against direct cryogenic measurements of the same standards. This is load-bearing for the central claim because an incomplete model could systematically underestimate the reported ±0.08 dB uncertainty at 6 GHz.
Authors: We agree that explicit specification of the modeled physical effects is required for metrological rigor. In the revised manuscript we will expand the relevant section to list the effects included in the numerical model: thermal contraction of the inner and outer conductors, temperature dependence of the dielectric permittivity, and effective electrical-length changes arising from connector interface variations. Effects omitted from the model include frequency-dependent connector repeatability beyond the length-shift term, cryogenic dielectric-loss variations (bounded conservatively from room-temperature data), and superconducting transitions (not applicable for the coaxial materials and frequency range employed). Direct cross-validation against separate cryogenic measurements of the standards was not performed, consistent with the single-cycle design; instead, an additional uncertainty term derived from the model sensitivity analysis is included in the budget. We will also add a short discussion of possible residual model bias and its contribution to the stated uncertainty. revision: yes
-
Referee: Test measurements and uncertainty budget section: The reported attenuation result of 20.70 ± 0.08 dB for the 20 dB attenuator at 6 GHz is presented as an example, but without independent cryogenic verification of the standards or explicit propagation steps showing how the numerical shift term combines with other contributions, the budget's completeness cannot be fully assessed.
Authors: We will revise the uncertainty-budget section to include the explicit propagation steps, showing how the numerical cryogenic-shift contribution is combined with the room-temperature calibration uncertainties, connector repeatability, and noise terms according to the GUM law of propagation of uncertainty. The 20.70 ± 0.08 dB result is presented strictly as an example application of the calibrated system; the manuscript already states that full independent cryogenic verification of the standards remains an open challenge and is outside the scope of this work. revision: yes
- Direct experimental cross-validation of the numerical model via separate cryogenic measurements of the calibration standards, which would require additional thermal cycles incompatible with the single-cycle strategy.
Circularity Check
No significant circularity; derivation relies on external SI-traceable references and standard SOLR procedure.
full rationale
The paper's central method applies the established Short-Open-Load-Reciprocal (SOLR) calibration with standards tied to independent room-temperature SI-traceable measurements. The numerical evaluation of artifact response shift upon cooling is described as a separate modeling step used only to augment the uncertainty budget, not as a fit that re-derives the target S-parameter values from the same data. The reported attenuator result (20.70 +/- 0.08 dB) is presented as an outcome of the calibrated measurement rather than a quantity that reduces by the paper's own equations to a parameter defined in terms of itself. No self-citation chains, ansatz smuggling, or uniqueness theorems imported from prior author work appear as load-bearing elements in the provided derivation. The approach remains self-contained against external metrological benchmarks.
Axiom & Free-Parameter Ledger
free parameters (1)
- additional cryogenic uncertainty contribution
axioms (2)
- domain assumption The Short-Open-Load-Reciprocal (SOLR) technique can be applied to realize error-corrected measurements at cryogenic temperatures
- domain assumption Room-temperature measurements of calibration standards are SI-traceable and can be extrapolated via numerical modeling to cryogenic conditions
Lean theorems connected to this paper
-
IndisputableMonolith/Cost/FunctionalEquationwashburn_uniqueness_aczel unclear?
unclearRelation between the paper passage and the cited Recognition theorem.
a numerical approach is used to evaluate the response shift of the artifacts upon cooling and to derive an additional cryogenic uncertainty contribution
-
IndisputableMonolith/Foundation/RealityFromDistinctionreality_from_one_distinction unclear?
unclearRelation between the paper passage and the cited Recognition theorem.
Full SI-traceable verification at mK temperatures remains an open challenge
What do these tags mean?
- matches
- The paper's claim is directly supported by a theorem in the formal canon.
- supports
- The theorem supports part of the paper's argument, but the paper may add assumptions or extra steps.
- extends
- The paper goes beyond the formal theorem; the theorem is a base layer rather than the whole result.
- uses
- The paper appears to rely on the theorem as machinery.
- contradicts
- The paper's claim conflicts with a theorem or certificate in the canon.
- unclear
- Pith found a possible connection, but the passage is too broad, indirect, or ambiguous to say the theorem truly supports the claim.
Reference graph
Works this paper leans on
-
[1]
Microwave metrology for superconducting quantum circuits,
M. Bieler, et.al., “Microwave metrology for superconducting quantum circuits,” in Proc. CPEM2022, Wellington, New Zealand, 2022, p. 463
work page 2022
-
[2]
Two -port microwave calibration at millikelvin temperatures,
L. Ranzani, L. Spietz, Z. Popovic and J. Aumentado, “Two -port microwave calibration at millikelvin temperatures,” Rev. Sci. Instrum., 84, 034704, Mar. 2013, doi: 10.1063/1.4794910
-
[3]
Cryogenic single -port calibration for superconducting microwave resonator measurements,
H. Wang, et.al., “Cryogenic single -port calibration for superconducting microwave resonator measurements,” Quantum. Sci. Technol. , 6, 035015, Jun. 2021, doi: 10.1088/2058-9565/AC070E
-
[4]
Microwave calibration of qubit drive line components at millikelvin temperatures,
S. Simbierowicz, V. Y. Monarkha, S. Singh, N. Messaoudi, P. Krantz and R. E. Lake, “Microwave calibration of qubit drive line components at millikelvin temperatures,” Appl. Phys. Lett. , 120, 054004, Feb. 2022, doi: 10.1063/5.0081861
-
[5]
M. Stanley, S. De Graaf, T. Hönigl -Decrinis, T. Lindström and N. Ridler, “Characterizing scattering parameters of superconducting quantum integrated circuits at milli- Kelvin temperatures,” IEEE Access, 10, pp. 43376 – 43386, Apr. 2022, doi: 10.1109/ACCESS.2022.3169787
-
[6]
Two -port network analyzer calibration using an unknown ’thru’,
A. Ferrero and U. Pisani, “Two -port network analyzer calibration using an unknown ’thru’,” IEEE Microwave and Guided Wave Letters , vol. 2, no. 12, pp. 505–507, Dec. 1992, doi: 10.1109/75.173410
-
[7]
Calibrated transmission and reflection from a multi-qubit microwave package,
S. Simbierowicz et al., “Calibrated transmission and reflection from a multi-qubit microwave package,” Rev. Sci. Instrum., vol. 94, no. 5, 054713, 2023, doi: 10.1063/5.0144840
-
[8]
T. Arakawa, and S. Kon, “Calibrated Two -Port Microwave Measurement up to 26.5 GHz for Wide Temperature Range From 4 to 300 K,” IEEE Trans. Instr. Meas. , vol. 72, 1009608, 2023, doi: 10.1109/TIM.2023.3315393
-
[9]
M. Stanley et al., “Characterizing S - Parameters of Microwave Coaxial Devices With up to Four Ports at Temperatures of 3 K and Above for Quantum Computing Applications,” IEEE Trans. Instr. Meas. , vol. 73, pp. 1–6, 2024, doi: 10.1109/TIM.2024.3369144
-
[10]
L. Oberto, et.al., “Measurement and Calibration Approaches for Two - Port Scattering Parameters at mK Temperatures,” in Proc. CPEM2024, 25-05168, Denver (CO), USA, 2024, doi: 10.1109/CPEM61406.2024.10646000
work page internal anchor Pith review Pith/arXiv arXiv doi:10.1109/cpem61406.2024.10646000 2024
-
[11]
Engineering cryogenic setups for 100 -qubit scale superconducting circuit systems,
S. Krinner, et. al., “Engineering cryogenic setups for 100 -qubit scale superconducting circuit systems,” EPJ Quantum Technology., vol. 6, 2, May. 2019, doi: 10.1140/EPJQT/S40507-019-0072-0
-
[12]
Ultra low noise readout with traveling wave parametric amplifiers: The DARTWARS project,
A. Rettaroli, et. a l., “Ultra low noise readout with traveling wave parametric amplifiers: The DARTWARS project,” Nucl. Instrum. Methods Phys. Res. A , vol. 1046, 167679, Jan. 2023, doi: 10.1016/J.NIMA.2022.167679
-
[13]
Development of Quantum Limited Superconducting Amplifiers for Advanced Detection ,
S. Pagano, et. al., “Development of Quantum Limited Superconducting Amplifiers for Advanced Detection ,” IEEE Trans. Appl. Supercond. , vol. 32, no. 4, 1500405, Jun. 2022, doi: 10.1109/TASC.2022.3145782
-
[14]
Characterization of Traveling -Wave Josephson Parametric Amplifiers at T = 0.3 K,
V. Granata, et. al., “Characterization of Traveling -Wave Josephson Parametric Amplifiers at T = 0.3 K,” IEEE Trans. Appl. Supercond., vol. 33, no. 1, 0500107, Jan. 2023, doi: 10.1109/TASC.2022.3214656
-
[15]
XMA Corp, https://www.xmacorp.com/
-
[16]
“Microwave Studio (MWS). (2022). CST —Computer Simulation Technology AG. [Online]. Available: www.cst.com/products/cstmws.”
work page 2022
-
[17]
E. Shokrolahzade et al., “Thermo -Mechanical EM Models for Broadband Cryogenic VNA Calibration Including Numerical Uncertainties Down to 4.2 K,” IEEE Trans. Microw. Theory Tech., vol. 73, no. 11, pp. 9058 -9069, Nov. 2025 , doi: 10.1109/TMTT.2025.3584196
-
[18]
VNA Tools II: S -parameter uncertainty calculation,
M. Wollensack, J. Hoffmann, J. Ruefenacht and M. Zeier, “VNA Tools II: S -parameter uncertainty calculation,” in Proc. 79th Microwave Measurement Conference (ARFTG), Montreal, Canada, 2012, doi: 10.1109/ARFTG79.2012.6291183
-
[19]
https://www.metas.ch/vnatools
-
[20]
VNA Tools – a software for metrology and industry
M. Zeier, J. Rüfenacht, M. Wollensack, “VNA Tools – a software for metrology and industry”, METinfo, vol. 27, no. 2, pp. 4-7, 2020
work page 2020
-
[21]
EURAMET. Calibration Guide No. 12, Version 3.0 ( Mar. 2018). Guidelines on the Evaluation of Vector Network Analyzers (VNA) . 10 CPEM61406 [Online]. Available: https://www.euramet.org/publications-media- centre/calibration-guidelines
work page 2018
-
[22]
BIPM, IEC, IFCC, ILAC, ISO, IUPAC, IUPAP and OIML. JCGM 100:2008 (2008). Evaluation of measurement data - Guide to the expression of uncertainty in measurement . [Online]. D oi: 10.59161/JCGM100-2008E
-
[23]
M. Stanley et al., “A Technique to Improve Accuracy of S -Parameter Measurements of Coaxial Connectorized Devices at Cryogenic Temperatures,” IEEE Trans. Instr. Meas., vol. 74, 8005612, 2025, doi: 10.1109/TIM.2025.3595257
-
[24]
Kerr reversal in Josephson meta- material and traveling wave parametric amplification,
A. Ranadive, et. al., “Kerr reversal in Josephson meta- material and traveling wave parametric amplification,” Nat. Commun. , vol. 13, 1737, Apr. 2022, doi: 10.1038/S41467-022-29375-5
-
[25]
L. Fasolo, et. al., “Experimental Characterization of RF -SQUIDs Based Josephson Traveling Wave Parametric Amplifier Exploiting Resonant Phase Matching Scheme,” IEEE Trans. Appl. Supercond., vol. 34, no. 3, 1101406, Jan. 2024, doi: 10.1109/TASC.2024.3359163
-
[26]
Broadband Coaxial S -Parameter Measurements for Cryogenic Quantum Technologies,
S. H. Shin et al., “Broadband Coaxial S -Parameter Measurements for Cryogenic Quantum Technologies,” IEEE Trans. Microw. Theory Tech., vol. 72, no. 4, pp. 2193–2201, 2024, doi: 10.1109/TMTT.2023.3322909
-
[27]
J. Skinner et al., “Characterizing precision coaxial air lines as reference standards for cryogenic S -parameter measurements at milli -kelvin temperatures,” in IEEE MTT- S Int. Microw. Symp. Dig., San Diego, CA, USA, Jun. 2023, pp. 1–4, doi: 10.1109/IMS37964.2023.10188171
-
[28]
N. M. Ridler and M. Salter, “Measuring the capacitance coefficients of coaxial open -circuits with traceability to national standards,” IEEE Microwave Journal, vol. 49, no. 10, pp. 138–154, 2006
work page 2006
discussion (0)
Sign in with ORCID, Apple, or X to comment. Anyone can read and Pith papers without signing in.