REVIEW 4 major objections 5 minor 16 references
Stereo Radargrammetry Using Deep Learning from Airborne SAR Images
T0 review · 4 major / 5 minor · reviewed 2026-08-07 · deepseek-v4-flash
Pith's one-line read Fine-tuning RoMa on airborne SAR images makes deep-learning stereo radargrammetry more accurate and denser than POC-based and camera-pretrained matching.
desk verdict Useful fine-tuning result, but the ground truth is aligned to POC on the test areas—so treat the absolute accuracy claim with caution. read the letter →
The pith
A machine-rendered reading of the paper's core claim, the machinery that carries it, and where it could break.
The reading
What carries the argument
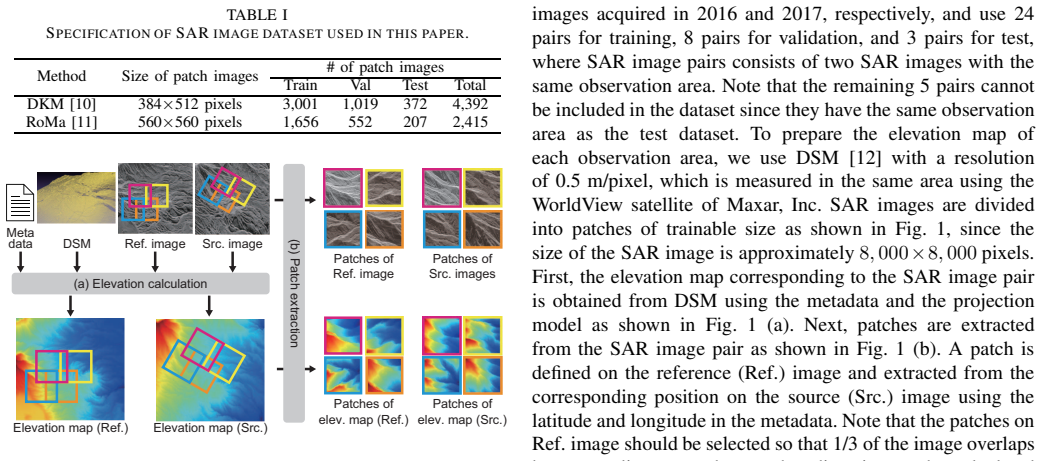
RoMa, a dense deep feature matcher that first estimates global deformation between an image pair and then refines it to dense correspondence, is the central mechanism. The paper's adaptation has three components: patch-wise extraction of corresponding slant-range SAR patches from metadata coordinates, which makes roughly 8,000 by 8,000 pixel images trainable; fine-tuning with a confidence-weighted disparity regression loss plus a binary cross-entropy confidence loss, supervised by DSM-derived disparity; and 3D reconstruction through the existing SAR projection model. The key identity is the disparity map D, obtained from the difference of ground-truth elevation maps, which turns DSM elevation into a per-pixel matching target.
What would settle it
An independent evaluation using lidar or field-surveyed ground truth, without aligning the DSM to the POC reconstruction, would settle the claim: if RoMa(S)'s within-2-m advantage over POC shrinks or reverses, the reported gains are an artifact of the DSM labels or of the alignment. Alternatively, training labels generated from two different high-resolution DSMs of the same area should produce similar fine-tuned accuracy, and large divergence would show the method is learning the label source rather than SAR geometry.
Extended reading notes
Core claim
The central claim, stated in the paper's terms, is that geometric image modulation stops being the limiting factor for stereo radargrammetry once the matcher has seen SAR data. The paper shows that RoMa fine-tuned on its created SAR patch dataset yields 42.20%, 60.52%, and 74.10% of points within 2 m error on the three 2 km by 2 km test areas, with error standard deviations of 9.94, 6.52, and 4.28 m, beating the POC-based method, DKM fine-tuned on the same data, and both camera-pretrained baselines. It also establishes that ground projection is unnecessary: patches are taken directly from slant-range images, so pixel interpolation does not degrade the input. The disparity ground truth is derived from a 0.5 m resolution DSM through the SAR projection model, and the same projection model converts matched point pairs to 3D coordinates.
Load-bearing premise
The load-bearing premise is that the DSM-derived disparity labels and the POC-based alignment used in evaluation are accurate enough that fine-tuning learns genuine SAR correspondence rather than reproducing DSM errors or favoring one method.
Editorial extensions
If this is right
- A deep matcher fine-tuned on SAR patch pairs can serve as the correspondence engine for radargrammetry, producing denser elevation maps than POC-based matching.
- Ground projection is not needed for deep matching; processing slant-range patches directly avoids the image-quality loss from pixel interpolation.
- Camera-image pretraining alone is insufficient: camera-pretrained RoMa and DKM show larger errors and wider scatter than their SAR-fine-tuned versions, so domain-specific fine-tuning carries the improvement.
- The reported comparison is framed around correspondence accuracy because the DSM is aligned to the POC result before evaluation, so the method's advantage is about matching density and consistency rather than absolute geolocation accuracy.
- The created dataset and patch-based recipe make deep radargrammetry trainable on SAR imagery even when the full images are too large for current matchers.
Reading between the lines
- An implicit consequence is that the same patch-wise fine-tuning recipe could transfer to satellite SAR stereo pairs if a high-resolution DSM is available to synthesize disparity labels, since the matching step is platform-agnostic.
- A testable extension is to use the network's confidence map to mask layover, shadow, and occlusion regions in the final elevation map, which would likely improve the measured percentages further in mountainous areas.
- The comparison also suggests that architecture choice matters less than domain adaptation: DKM fine-tuned on the same data remains less accurate than RoMa(S), consistent with the paper's point that tolerance to geometric modulation is the limiting factor.
Editorial analysis
A structured set of objections, weighed in public.
Referee Report
Summary. The paper proposes a deep-learning-based stereo radargrammetry pipeline for airborne SAR. It creates a dataset from Pi-SAR2 X-band images around Mt. Aso with AW3D DSM-derived elevation maps; patches slant-range images; generates disparity ground truth from the DSM and projection model; fine-tunes RoMa with regression and confidence losses; and reconstructs 3D points from matched patches. Experiments on three 2 km x 2 km test areas compare POC, DKM, and RoMa with and without fine-tuning. The paper claims that RoMa fine-tuned on SAR (RoMa(S)) has the smallest error standard deviation and the largest percentage of points within 2 m (Table II).
Significance. If the evaluation were clean, the main result would be useful: fine-tuning a dense deep matcher on SAR imagery yields denser, more consistent elevation maps than POC, and processing slant-range images directly avoids interpolation degradation. The paper also provides a concrete dataset-construction recipe and a clear fine-tuning protocol with a confidence loss. However, the evidence is weakened by the evaluation protocol, the very limited single-site test set, and the absence of a public dataset/code release. The absolute-accuracy claim is not yet established, although the relative comparison of error standard deviations and 2-m coverage percentages is suggestive.
major comments (4)
- [Section III-A / Table II] The statement in Section III-A that "the external parameters are optimized by aligning DSM with the results of the POC-based method [6]" is load-bearing because Table II is the sole quantitative evidence for the central claim. If the alignment is a rigid similarity fit, POC's mean errors in Table II (0.90, -0.56, -0.14 m) are partly produced by the fitting itself; if the alignment also absorbs scale, rotation, or terrain-dependent deformation, then the ground truth is warped toward POC's systematic errors and every other method is scored against a POC-anchored reference. Please report (i) the exact alignment model and the number of fitted parameters, (ii) the fitted parameter values for each of the three areas, and (iii) the same table computed against the original unaligned DSM or against independently georeferenced ground control. Without this, the reader cannot determine whether the reported advantage of RoMa(S) over POC is an artifact of the alignment.
- [Section III-B / Table II] The interpretation of Table II is not robust to the alignment used in Section III-A. The sentence "The POC-based method [6] has the smallest average error but the large standard deviation" is misleading because the average error of POC was minimized by aligning the DSM to POC's own results; the cancellation argument would apply only to an independently referenced elevation map. Please either remove the mean-error comparison or discuss it explicitly in light of the alignment procedure, and report the residual of the alignment fit.
- [Section II-C] The derivation of the training target is under-specified. Section II-C(ii) states that D is "calculated from the difference of the elevation maps of the ground truth," but disparity is a pixel-coordinate difference between the reference and source images. The exact projection equations used to convert DSM elevations into disparity are not given, so the reader cannot assess how DSM errors or metadata errors propagate into the training target. Please state the projection model, explain how the source-patch elevation map enters the disparity computation, and quantify the vertical accuracy of the AW3D DSM relative to the 2-m threshold used in evaluation.
- [Section III / Data availability] The evaluation uses only three test areas from one volcano region, one sensor (Pi-SAR2), and one intersection angle (about 43 degrees). Moreover, the dataset and code are not released, despite the abstract emphasizing the creation of a SAR image dataset, and no data/code availability statement is provided. This prevents independent verification of the alignment procedure and the claimed coverage. Please add a data/code availability statement, report per-area point coverage and the number of valid matched points for each method, and, if possible, evaluate on additional areas or at least quantify how the reported metrics vary under different alignment references.
minor comments (5)
- [Section II-B] The sentence "the patches on Ref. image should be selected so that 1/3 of the image overlaps between adjacent patches so that disparity can be calculated from a patch pair" is unclear, since disparity is computed within each patch pair rather than between adjacent patches.
- [Section III-B] The claim that "DKM (S) can measure a wider area than DKM (M)" is not supported by a quantitative coverage metric; the 2-m percentages in Table II are lower for DKM (S) than for DKM (M) in all three areas, so the coverage claim needs a separate statistic.
- [Fig. 4] The elevation color scale (550-1030 m) and the error color scale (+30/-30 m) make visual comparison difficult; consider using a common scale across methods and separate panels with equal ranges.
- [Table II] In Area 2, RoMa (M) achieves a 2-m percentage of 56.50%, which is close to RoMa (S)'s 60.52%; the discussion in Section III-B should address this close call rather than presenting fine-tuning as uniformly decisive.
- [Section II-C(ii)] The confidence loss in Eq. (2) is stated as binary cross-entropy, but the handling of pixels for which no ground-truth disparity is available should be clarified: are these pixels excluded from the regression loss, included with weight zero, or treated as negative examples in the confidence loss?
Circularity Check
No central circularity; the only by-construction element is that the evaluation DSM is aligned to the POC baseline before errors are computed.
-
fitted input called prediction
[Section III-A (Experiments), Table II and Fig. 4]
"Note that the external parameters are optimized by aligning DSM with the results of the POC-based method [6] to minimize the influence of errors in the external parameters."
The DSM used as 'Ground truth' for the accuracy evaluation is aligned to the point cloud of the POC-based method, which is one of the compared methods. This fit on the test areas makes POC's average error nearly zero by construction (Area 1: 0.90 m, Area 2: -0.56 m, Area 3: -0.14 m). Thus the reported errors in Table II are measured against a reference that is partially derived from a method under comparison, rather than an independent geodetic elevation reference. The paper's central claim about RoMa(S)'s lower standard deviation and higher 2-m coverage is not forced by this alignment, so this is a partial, non-central circularity rather than a collapse of the derivation.
full rationale
The derivation chain is: create a SAR dataset from Pi-SAR2 images and AW3D DSM, compute ground-truth disparity D from elevation maps via the SAR projection model, fine-tune RoMa with regression and binary cross-entropy losses, and evaluate on held-out areas by comparing reconstructed elevation to the DSM. This is a standard supervised learning setup with separate training and test areas, and the training targets are not derived from the method's own predictions. The only by-construction component is the evaluation: the DSM is aligned to the POC-based method's reconstruction using optimized external parameters before Table II errors are computed. For POC this makes the average error near zero by construction, so the absolute accuracy comparison is not against an independent reference. However, this alignment does not force the proposed method's lower standard deviation or higher percentage of points within 2 m; those are independent outputs of the fine-tuned network. No load-bearing self-citation chain, uniqueness import, ansatz smuggling, or renaming of known results is present. The disclosed evaluation alignment is a soundness concern but does not make the central claim circular.
Assumptions & free parameters
free parameters (5)
- lambda (weight on confidence loss) =
0.01
- learning rates =
1e-6 for encoder, 2e-5 for others
- number of epochs and batch size =
31 epochs, batch size 2
- patch overlap ratio =
1/3
- external parameter alignment transform =
not reported
assumptions (4)
- domain assumption AW3D DSM is an accurate ground truth for elevation and disparity.
- domain assumption The SAR projection model and metadata from [6] correctly map elevation to image coordinates.
- domain assumption RoMa's DINOv2/VGG features, originally trained on camera images, can transfer to SAR imagery after fine-tuning on a relatively small dataset.
- domain assumption The three test areas are representative of the training distribution (same sensor, same terrain type).
Cite this review
Pith. "Pith review of Stereo Radargrammetry Using Deep Learning from Airborne SAR Images." pith.science (2026). https://pith.science/paper/XHWGYRGJ
@misc{pith2026250520876,
  author       = {Pith},
  title        = {Pith review of: Stereo Radargrammetry Using Deep Learning from Airborne SAR Images},
  year         = {2026},
  howpublished = {\url{https://pith.science/paper/XHWGYRGJ}},
  note         = {Machine review of arXiv:2505.20876}
}
read the original abstract
In this paper, we propose a stereo radargrammetry method using deep learning from airborne Synthetic Aperture Radar (SAR) images. Deep learning-based methods are considered to suffer less from geometric image modulation, while there is no public SAR image dataset used to train such methods. We create a SAR image dataset and perform fine-tuning of a deep learning-based image correspondence method. The proposed method suppresses the degradation of image quality by pixel interpolation without ground projection of the SAR image and divides the SAR image into patches for processing, which makes it possible to apply deep learning. Through a set of experiments, we demonstrate that the proposed method exhibits a wider range and more accurate elevation measurements compared to conventional methods. The project web page is available at: https://gsisaoki.github.io/IGARSS2025_sasayama/
Figures


Figures from the paper (2 more)


Reference graph
Works this paper leans on
-
[6]
Accurate 3D measurement from two SAR images without prior knowledge of scene,
K. Insfran, K. Ito, and T. Aoki, “Accurate 3D measurement from two SAR images without prior knowledge of scene,” Proc. IEEE Int’l Geoscience and Remote Sensing Symposium , pp. 4814– 4817, Jul. 2021
work page 2021
-
[1]
J. A. Richards, Remote Sensing with Imaging Radar . Springer, 2009
work page 2009
-
[2]
Kerle, Encyclopedia of Natural Hazards
N. Kerle, Encyclopedia of Natural Hazards . Springer Nether- lands, 2013
work page 2013
-
[3]
Stereo radargrammetry using airborne SAR images wit h- out GCP,
D. Maruki, S. Sakai, K. Ito, T. Aoki, J. Uemoto, and S. Urat - suka, “Stereo radargrammetry using airborne SAR images wit h- out GCP,” Proc. IEEE Int’l Conf. Image Processing , pp. 3585– 3589, Sep. 2015
work page 2015
-
[4]
Elevation measurement from single-pass SAR images,
S. Hishinuma, K. Ito, T. Aoki, J. Uemoto, and S. Uratsuka, “Elevation measurement from single-pass SAR images,” Proc. IEEE Int’l Geoscience and Remote Sensing Symp. , pp. 5662– 5665, 2017
work page 2017
-
[5]
K. Ito, S. Hishinuma, T. Aoki, J. Uemoto, and S. Uratsuka, “Towards on-board elevation measurement using interferom etry and radargrammetry from single-pass SAR images,” Proc. IEEE Int’l Geoscience and Remote Sensing Symp. , pp. 5816–5819, 2018
work page 2018
-
[7]
Maˆ ıtre, Processing of Synthetic Aperture Radar Images
H. Maˆ ıtre, Processing of Synthetic Aperture Radar Images . John Wiley & Sons, Ltd., 2010
work page 2010
-
[8]
Synthetic aperture radar interferometr y,
P . Rosen, S. Hensley, I. Joughin, F. Li, S. Madsen, E. Rodr iguez, and R. Goldstein, “Synthetic aperture radar interferometr y,” Proc. IEEE , vol. 88, no. 3, pp. 333–382, Mar. 2000
work page 2000
Show all 16 references
-
[9]
A sub-pixe l cor- respondence search technique for computer vision applicat ions,
K. Takita, M. Muquit, T. Aoki, and T. Higuchi, “A sub-pixe l cor- respondence search technique for computer vision applicat ions,” IEICE Trans. Fundamentals, vol. E87-A, no. 8, pp. 1913–1923, Aug. 2004
1913
-
[10]
DKM: Dense kernelized feature matching for geometry esti- mation,
J. Edstedt, I. Athanasiadis, M. Wadenb¨ aack, and M. Fel sberg, “DKM: Dense kernelized feature matching for geometry esti- mation,” Proc. IEEE/CVF Conf. Computer Vision and Pattern Recognition, pp. 17 765–17 775, Jun. 2023
2023
-
[11]
RoMa: Robust dense feature matching,
J. Edstedt, Q. Sun, G. B¨ okman, M. Wadenb¨ ack, and M. Fel s- berg, “RoMa: Robust dense feature matching,” Proc. IEEE/CVF Conf. Computer Vision and Pattern Recognition , pp. 19 790– 19 800, Jun. 2024
2024
-
[12]
V ali dation of ’AW3D’ global DSM generated from ALOS PRISM,
J. Takaku, T. Tadono, K. Tsutsui, and M. Ichikawa, “V ali dation of ’AW3D’ global DSM generated from ALOS PRISM,” ISPRS Ann. Photogramm. Remote Sens. Spatial Inf. Sci. , vol. III-4, pp. 25–31, Jul. 2016
2016
-
[13]
Development of X-band airborne polarimetric and interfer o- metric SAR with submeter spatial resolution,
A. Nadai, S. Uratsuka, T. Umehara, T. Matsuoka, and M. Sa take, “Development of X-band airborne polarimetric and interfer o- metric SAR with submeter spatial resolution,” Proc. IEEE Int’l Geoscience and Remote Sensing Symposium , vol. 2, pp. 913– 916, Jul. 2009
2009
-
[14]
DINOv2: Learning robust visual features without supervis ion,
M. Oquab, T. Darcet, T. Moutakanni, H. V . V o, M. Szafrani ec, V . Khalidov, P . Fernandez, D. Haziza, F. Massa, A. El-Nouby, M. Assran, N. Ballas, W. Galuba, R. Howes, P .-Y . Huang, S.- W. Li, I. Misra, M. Rabbat, V . Sharma, G. Synnaeve, H. Xu, H. Jegou, J. Mairal, P . Lab...
2024
-
[15]
V ery deep convolutional net works for large-scale image recognition,
S. Karen and A. Zisserman, “V ery deep convolutional net works for large-scale image recognition,” Proc. Int’l Conf. Learning Representations, pp. 1–14, May 2015
2015
-
[16]
MegaDepth: Learning single-view depth prediction from internet photos,
Z. Li and N. Snavely, “MegaDepth: Learning single-view depth prediction from internet photos,” Proc. IEEE/CVF Conf. Computer Vision and Pattern Recognition , pp. 2041–2050, Jun. 2018
2018
Reviewed August 7, 2026 · model on record in the stance chip above.
Discussion (0). Continue with ORCID to comment.