REVIEW 3 major objections 5 minor 15 references
Parameter Effects in ReCom Ensembles
T0 review · 3 major / 5 minor · reviewed 2026-08-07 · deepseek-v4-flash
Pith's one-line read ReCom ensemble statistics depend on algorithm variant and county-preservation parameters, while population tolerance has no material effect.
desk verdict A substantial multi-state study of ReCom parameter sensitivity with a plausible average-margin consistency claim, held back by placeholder data links and significance testing that ignores effective sample sizes. read the letter →
The pith
A machine-rendered reading of the paper's core claim, the machinery that carries it, and where it could break.
The reading
What carries the argument
The machinery is the ReCom (recombination) Markov chain and its parameterized variants: ReCom-A through D, which differ in how they choose the adjacent district pair and how they draw spanning trees, plus county-aware versions R25–R100 that add a surcharge to edges crossing county lines, and RevReCom, the reversible variant. The load-bearing statistical tools are the AR(1)-based effective sample size approximation $n_{\text{eff}} \approx n \cdot (1-\gamma_1)/(1+\gamma_1)$ and two redundancy measures, $\phi_{\text{avg}}$ and $\phi_{\text{max}}$, which together support the convergence claims. The explanatory identity for the most consistent parameter effect is $AM = (V_D - 0.5) + 2S_R$, decomposing the average margin into the statewide Democratic share plus twice the Republican surplus-vote fraction, which makes the average margin a monotone function of compactness under the paper's assumptions.
What would settle it
Compute the lag-2 and lag-3 autocorrelations of a score along a ReCom chain and compare them with the squares and cubes of the lag-1 correlation; if the measured values are systematically larger, the geometric-decay model fails and the reported effective sample sizes would shrink. A second check would rerun the full 315-ensemble experiment with chains several times longer and see whether any of the significant parameter effects in the paper's main tables change sign or lose significance.
Extended reading notes
Core claim
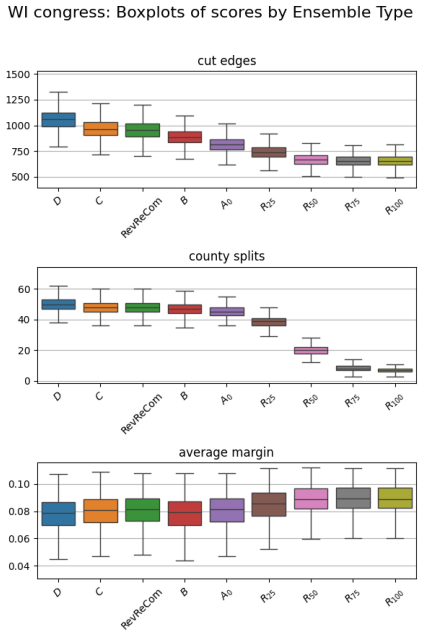
The central discovery is that there is no single 'ReCom ensemble' for a state and chamber: the distribution of maps, and hence the statistics used in redistricting litigation, depends on modeling choices. Across seven states and three chambers, the paper finds that altering the population tolerance barely moves any score, whereas switching among ReCom variants (A–D) and increasing the county-aware surcharge from 0.25 to 1.00 frequently produces statistically significant and sometimes material changes in Democratic seat counts, minority-majority districts, and competitive-seat counts. These effects are directionally inconsistent across states and chambers for partisan and minority-opportunity scores, but the average margin score increases consistently with compactness and county preservation. The paper argues this consistency follows from an identity: the average margin equals the surplus-vote fraction, which is a monotone function of compactness given a fixed statewide Democratic vote share. In addition, the paper claims that its autocorrelation-based effective sample sizes and redundancy measurements show the non-reversible chains are well mixed, with RevReCom the notable exception in some jurisdictions.
Load-bearing premise
The chain's scores are assumed to lose correlation with each other at a fixed rate as they get further apart in the chain; if the correlation actually lingers longer, the effective sample sizes are overestimated and the significance levels are too optimistic.
Editorial extensions
If this is right
- Practitioners using ReCom ensembles in court or policy work should report the algorithm variant and county-preservation surcharge alongside the resulting statistics, because these choices can move partisan and minority-opportunity scores by half a seat or more.
- Population tolerance can be varied freely within the studied ranges without altering substantive conclusions, so it can be chosen to satisfy legal or computational constraints.
- Because the average margin score responds consistently and monotonically to compactness and county preservation, comparisons of competitiveness across ensembles should control for these parameters or use the same settings.
- The convergence diagnostics (effective sample size and redundancy) give a practical template for checking whether a chain is long enough before interpreting ensemble statistics.
- RevReCom ensembles are not reliably proxied by the cheaper ReCom variants, so users who need the reversible algorithm's target distribution should generate RevReCom chains directly.
Reading between the lines
- Extending the paper's logic, sensitivity analysis across parameter settings could become a standard robustness check in redistricting litigation, since a single ensemble from one parameter setting may understate the uncertainty in the statistics.
- The monotone relationship between compactness and average margin might generalize beyond ReCom: any algorithm that increases compactness by reducing long district boundaries would tend to increase surplus votes and thus average margins, a testable claim for other sampling algorithms.
- The effective-sample-size method could be applied to judge chain length in other MCMC sampling contexts where only a single run is available, with the caveat that the AR(1) assumption should be checked against higher-lag autocorrelations.
- Future work could test whether the inconsistency of partisan-score effects across states is itself predictable from state political geography, such as the distribution of Democratic strongholds relative to county lines.
Editorial analysis
A structured set of objections, weighed in public.
Referee Report
Summary. The paper reports a systematic study of how ReCom algorithm parameters affect redistricting ensemble statistics. For seven states and three legislative chambers, the authors generate 315 ensembles of 20,000 plans, varying the population tolerance, the ReCom variant (A, B, C, D, and reversible ReCom), and a county-preservation surcharge (R25 through R100). They compare ensembles using compactness, partisan bias, competitiveness, minority-opportunity, and county-split scores. They introduce two convergence diagnostics: an effective sample size estimate based on an AR(1) autocorrelation model, and district-level redundancy measures. Their main empirical findings are that population tolerance has negligible effects, that county surcharge and algorithm variant affect partisan and minority-opportunity scores in directions that are inconsistent across states and chambers, and that the average-margin score increases consistently with compactness and county preservation, with the ordering D < B < C/RevReCom < A0 < R25 < R50 < R75 < R100. The paper also proposes an explanation for the average-margin pattern via the identity AM = SD + SR.
Significance. If the convergence and significance claims hold, this is a valuable large-scale contribution: it is the first multi-state, multi-chamber systematic parameter sweep for ReCom, and the convergence diagnostics (autocorrelation-based effective sample size and redundancy measures) are useful additions to the redistricting toolbox. The paper shares code and data links, and the tables report results for all 315 ensembles across many scores. The most novel and actionable claim is the surprisingly consistent effect of compactness and county preservation on average margin, which, if confirmed, would matter for practitioners choosing ReCom parameters in litigation and policy analyses. The main uncertainty is statistical: the reported p-values and convergence statements depend on effective sample size estimates and an AR(1) autocorrelation assumption that are not fully validated for the county-preserving and RevReCom ensembles.
major comments (3)
- [Section 5.2, Table 3; Section 6.5, Table 8] The paper's own convergence benchmark is neff >= 15,094 (Section 5.2), but several R75/R100 ensembles fall below it: for example, FL 120 R100 has neff = 5,776, MI 110 R75/R100 have 8,259/6,519, NC 120 R75/R100 have 7,411/5,922, NY 150 R75/R100 have 9,706/7,323, OH 99 R75/R100 have 10,249/7,752, and WI 99 R75/R100 have 10,299/6,299. The text asserts that these low values are due to the county-splits score alone, but Table 3 reports only the maximum autocorrelation over all non-MMD scores and does not identify which score produced the minimum neff. Since the central consistency claim concerns the average-margin score specifically (Table 8), the convergence evidence for that score is not documented. Please provide per-score autocorrelations and neff values for average margin (and for the other headline scores in Tables 6-11), or qualify the convergence claim accordingly.
- [Section 5.2, Eq. (5)] Equation (5) assumes the lag-k autocorrelation decays geometrically, gamma_i = gamma_1^i. The paper does not present any empirical lag-k autocorrelations or any test of this geometric-decay assumption. ReCom chains with county surcharges can exhibit persistent county-block structures whose autocorrelation plausibly decays more slowly than geometric; if so, the neff values in Table 3 would be overestimates. The consistency checks mentioned in Section 5.2 (multi-start dKS for A0 and redundancy measurements) do not test the decay model. Please add a concrete validation, such as plots or summaries of the empirical lag-k autocorrelation for representative chains, and consider a more robust neff estimator (e.g., initial-monotone-sequence or batch means). The headline convergence claims for R75/R100 and RevReCom currently rest on an unvalidated model.
- [Section 4.6, Tables 6-11] The p-values reported in Tables 6-11 appear to treat each ensemble as n = 20,000 independent draws. The paper introduces neff for convergence assessment but does not state that the significance tests in Tables 6-11 use neff-corrected sample sizes or standard errors. For autocorrelated ensembles, including R75/R100 and especially RevReCom (which has neff values as low as 46 for NY 150 and 77 for NC 120 in Table 3), these p-values are anti-conservative. Moreover, Table 5 explicitly omits RevReCom because its effective sample sizes are insufficient for accurate dKS comparisons, yet RevReCom columns are included with bold 'p < .001' entries in Tables 6-11. This is internally inconsistent. Please either recompute the significance tests using neff-adjusted effective sample sizes, or clearly flag comparisons with insufficient effective sample size, and reconcile the treatment of RevReCom.
minor comments (5)
- [Tables 5-11] The first column of Tables 5-11 is labeled 'A1' in the headers but the text and captions refer to this ensemble as A0; please make the labels consistent.
- [Table 10 caption] The caption contains 'hisanic' instead of 'Hispanic'; please fix the typo.
- [Section 6.2 heading] The heading reads 'dramatically effects compactness' but should read 'dramatically affects compactness'; please correct the verb.
- [Section 6.5] The sentence 'the formula AM = .05 + 2SD shows that AM would increase monotonically' does not follow from the preceding observation that the Dem-share-related quantity behaves in a complicated, not-necessarily-monotonic way; because AM is affine in SD, the monotonicity claim needs a separate argument or a conditional wording.
- [Supplementary Materials] The data and code links currently contain placeholders such as 'https://TBD-url' and 'github.com/proebsting/TBD'; please provide the actual URLs in the final version.
Circularity Check
No significant circularity: the ReCom parameter-sensitivity results are empirical measurements, not derivations from fitted inputs or self-citations.
full rationale
The paper is an empirical parameter-sensitivity study of ReCom ensembles, not a derivation. The central claims—population tolerance has negligible effects, while algorithm variant and county surcharge affect partisan, minority-opportunity, and competitiveness scores—are supported by comparing ensembles generated under different parameter settings and reporting mean differences, dKS distances, and p-values. No parameter is fitted to a subset of data and then renamed as a prediction. The AM = SD + SR identity in Section 6.5 is an interpretive aid used to rationalize why the average margin correlates with compactness; it does not by construction force the observed ordering, and the paper does not claim that it does. The effective-sample-size and redundancy analyses in Sections 5.2–5.3 are convergence heuristics; the AR(1) autocorrelation assumption of Equation 5 is an approximation whose fragility could weaken the convergence evidence, but that is a correctness or validity concern, not circular reasoning. The only self-citation is [Tap25], used in Section 4.4 to cite a partial explanation of why RMST algorithms produce more compact plans than UST algorithms; this is an aside and is not load-bearing for any of the paper's principal findings. Consequently, no circular step can be exhibited, and the appropriate finding is no significant circularity.
Assumptions & free parameters
free parameters (4)
- Population tolerance settings =
0.005/0.01/0.015 (congressional); 0.025/0.05/0.075 (legislative)
- County surcharge values =
0.25, 0.50, 0.75, 1.00
- Chain length and subsampling interval =
50 million steps / every 2500 for ReCom variants; 1 billion / 50000 for RevReCom
- dKS threshold for visible difference =
0.1
assumptions (5)
- ad hoc to paper The AR(1) model approximates the autocorrelation of score sequences in Equation 5.
- domain assumption ReCom chains mix to the stationary distribution within the chosen chain lengths.
- domain assumption Input data from Dave's Redistricting (precincts, population, VAP/CVAP, election returns) are accurate.
- domain assumption The blended election index is an appropriate summary of partisan voting behavior.
- domain assumption The chosen scores (Reock, Polsby-Popper, efficiency gap, etc.) are valid measures for their purposes.
Cite this review
Pith. "Pith review of Parameter Effects in ReCom Ensembles." pith.science (2026). https://pith.science/paper/UZ46MJSA
@misc{pith2026250521326,
  author       = {Pith},
  title        = {Pith review of: Parameter Effects in ReCom Ensembles},
  year         = {2026},
  howpublished = {\url{https://pith.science/paper/UZ46MJSA}},
  note         = {Machine review of arXiv:2505.21326}
}
read the original abstract
Ensemble analysis has become central to redistricting litigation, but parameter effects remain understudied. We analyze 315 ReCom ensembles across the three legislative chambers in 7 states, systematically varying the population tolerance, county preservation strength, and algorithm variant. To validate convergence, we introduce new methods to approximate effective sample size and measure redundancy. We find that varying the population tolerance has a negligible effect on all scores, whereas the algorithm and county-preservation parameters can significantly affect some metrics, inconsistently in some cases but surprisingly consistently in others across jurisdictions. These findings suggest parameter choices should be thoughtfully considered when using ReCom ensembles.
Figures


Figures from the paper (3 more)


Reference graph
Works this paper leans on
-
[1]
Herschlag, Zach Hunter, and Jonathan C
Eric Autry, Daniel Carter, Gregory J. Herschlag, Zach Hunter, and Jonathan C. Mattingly. Metropolized forest recombination for monte carlo sampling of graph partitions. SIAM Journal on Applied Mathematics , 83(4):1366–1391, August 2023
work page 2023
-
[2]
Colorado in Context: Congressional Redistricting and Competing Fairness Criteria in Colorado
Jeanne Clelland, Haley Colgate, Daryl DeFord, Beth Malmskog, and Flavia Sancier-Barbosa. Colorado in context: Congressional redistricting and competing fairness criteria in colorado, March 2021. arXiv:2011.06049
work page Pith review arXiv 2021
-
[3]
Repetition effects in a Sequential Monte Carlo sampler
Sarah Cannon, Daryl DeFord, and Moon Duchin. Repetition effects in a sequential monte carlo sampler, September 2024. arXiv:2409.19017
work page Pith review arXiv 2024
-
[4]
Spanning tree methods for sampling graph partitions, October 2022
Sarah Cannon, Moon Duchin, Dana Randall, and Parker Rule. Spanning tree methods for sampling graph partitions, October 2022. arXiv:2210.01401
arXiv 2022
-
[5]
Recombination: A family of markov chains for redistricting
Daryl DeFord, Moon Duchin, and Justin Solomon. Recombination: A family of markov chains for redistricting. Harvard Data Science Review , 3(1), December 2020
work page 2020
-
[6]
Discrete geometry for electoral geography, August 2023
Moon Duchin and Bridget Eileen Tenner. Discrete geometry for electoral geography, August 2023. arXiv:1808.05860
arXiv 2023
-
[7]
Benjamin Fifield, Kosuke Imai, Jun Kawahara, and Christopher T. Kenny. The essential role of empirical validation in legislative redistricting simulation. Statistics and Public Policy , 7(1):52–68, January 2020
work page 2020
-
[8]
Andrew Gelman, John B. Carlin, Hal S. Stern, David B. Dunson, Aki Vehtari, and Donald B. Rubin. Bayesian Data Analysis . CRC Press, November 2013. Google-Books-ID: eSHSBQAAQBAJ
work page 2013
Show all 15 references
-
[9]
Charles J. Geyer. Practical markov chain monte carlo. Statistical Science , 7(4):473–483, November 1992
1992
-
[10]
Charles J. Geyer. Introduction to markov chain monte carlo. In Handbook of Markov Chain Monte Carlo , pages 3--48. Chapman and Hall/CRC, 1st edition, 2011
2011
-
[11]
Katz, Gary King, and Elizabeth Rosenblatt
Jonathan N. Katz, Gary King, and Elizabeth Rosenblatt. Theoretical foundations and empirical evaluations of partisan fairness in district-based democracies. American Political Science Review , 114:1: 164--178, 2020
2020
-
[12]
Sequential monte carlo for sampling balanced and compact redistricting plans, February 2023
Cory McCartan and Kosuke Imai. Sequential monte carlo for sampling balanced and compact redistricting plans, February 2023. arXiv:2008.06131
2023 arXiv
-
[13]
Yossi Rubner, Carlo Tomasi, and Leonidas J. Guibas. The earth mover’s distance as a metric for image retrieval. International Journal of Computer Vision , 40(2):99–121, November 2000
2000
-
[14]
Partisan gerrymandering and the efficiency gap
Nicholas Stephanopoulos and Eric McGhee. Partisan gerrymandering and the efficiency gap. University of Chicago Law Review , 82(2), March 2015
2015
-
[15]
On the minimum spanning tree distribution in grids, January 2025
Kristopher Tapp. On the minimum spanning tree distribution in grids, January 2025. arXiv:2401.17947
2025
Reviewed August 7, 2026 · model on record in the stance chip above.
Discussion (0). Sign in to comment.